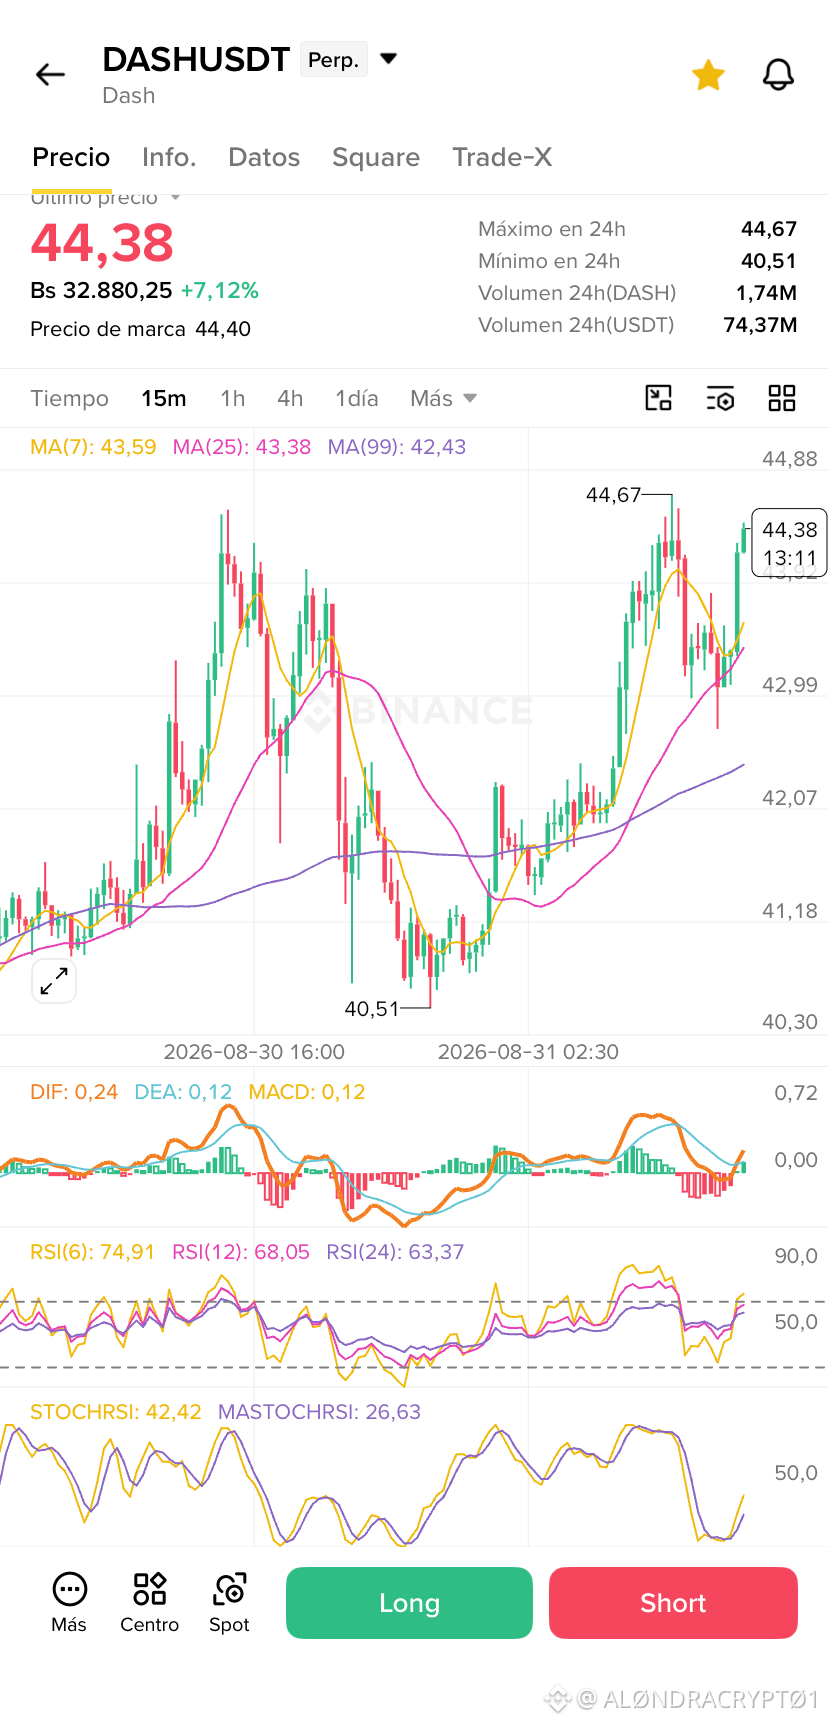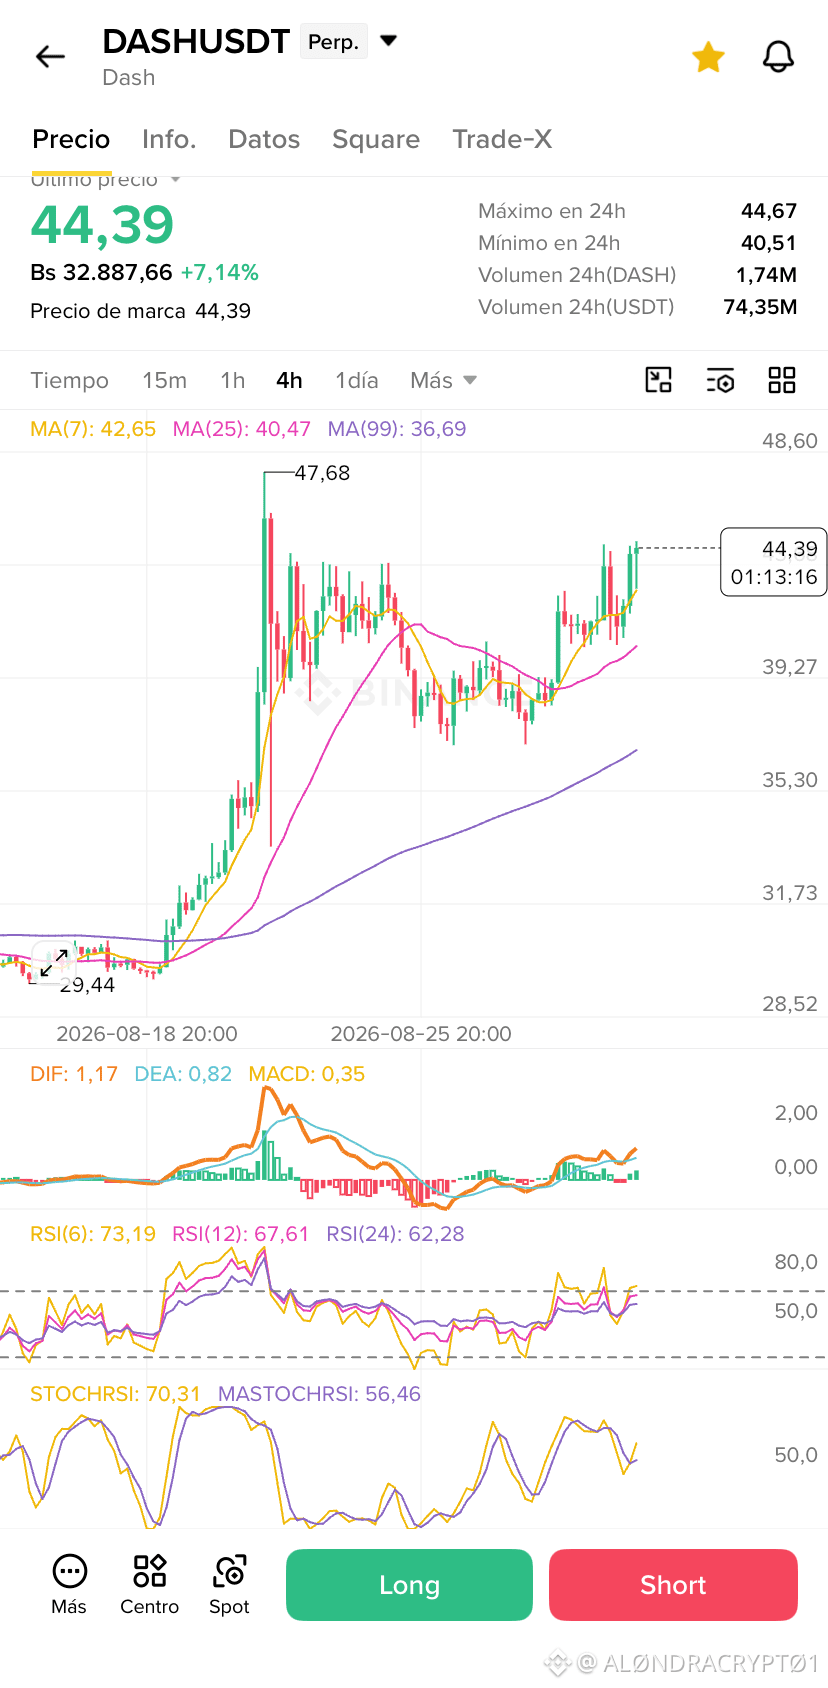

$DASH Analyzing the charts of $DASH , the price is trading at 44.38 USDT with a daily increase of +7.12%. After moving between a minimum of 40.51 USDT and a maximum of 44.67 USDT.
In the 15-minute timeframe, StochRSI is bouncing back from the lower zone (near 42) and pointing upward. If we check the order book, the strength is slightly tilted toward the sell side, with 53.31% versus 46.69% demand, reflecting the resistance being encountered at the upper range.
Key levels to watch:
- Support: The 42.99 to 43.59 USDT zone (supported by the local moving averages) and the strong 24-hour support at 40.51 USDT.
- Resistance: The 24-hour high at 44.67 USDT, followed by the next technical target at 47.68 USDT visible on higher timeframes.
What to do now?
The ideal moment to look for a Long entry is by watching for the price to hold the support of the moving averages, or waiting for a confirmed breakout above 44.67 USDT.
Ready to position ourselves in this $DASH move?
#analisistecnico
CLICK HERE ⬇️⬇️
In the 15-minute timeframe, StochRSI is bouncing back from the lower zone (near 42) and pointing upward. If we check the order book, the strength is slightly tilted toward the sell side, with 53.31% versus 46.69% demand, reflecting the resistance being encountered at the upper range.
Key levels to watch:
- Support: The 42.99 to 43.59 USDT zone (supported by the local moving averages) and the strong 24-hour support at 40.51 USDT.
- Resistance: The 24-hour high at 44.67 USDT, followed by the next technical target at 47.68 USDT visible on higher timeframes.
What to do now?
The ideal moment to look for a Long entry is by watching for the price to hold the support of the moving averages, or waiting for a confirmed breakout above 44.67 USDT.
Ready to position ourselves in this $DASH move?
#analisistecnico
CLICK HERE ⬇️⬇️