
Everyone is watching the $80,000 "new high"—no one is watching the RSI quietly making fresh lows
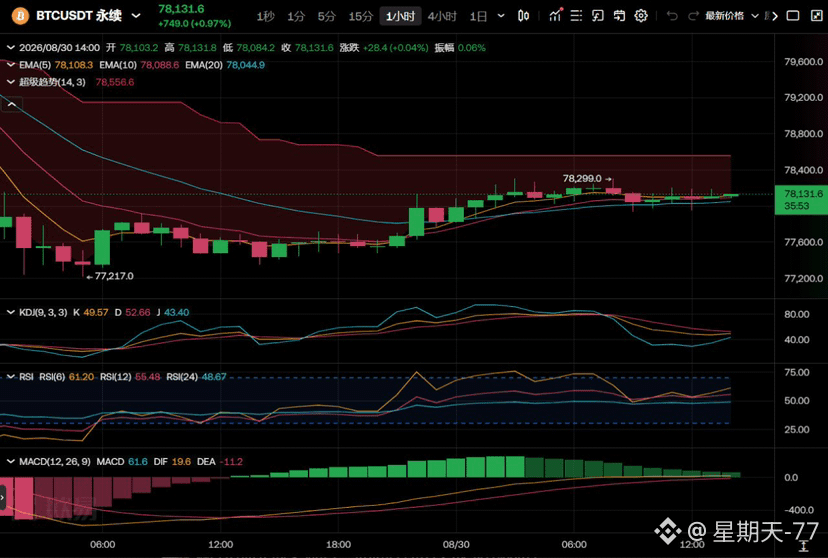
This technical analysis from Rekt Capital is definitely worth thinking about: Bitcoin’s February 2026 and June 2026 stage lows line up almost perfectly in price, and the RSI oversold levels are also nearly identical—textbook “double bottom.” But when you zoom in on the high end, it doesn’t hold up. Compared with the May high, this rebound really did set a new high and even tested around $80,000, yet the RSI’s overbought strength is clearly weaker. Higher price, weaker momentum—that’s a classic hidden bearish divergence. So $80,000 isn’t just a psychological integer level, but a psychological resistance zone where this divergence can—or can’t—be invalidated.
The liquidation chart provides another layer of confirmation. According to Coinglass, if BTC breaks above $80,000, the total liquidation intensity of mainstream CEX short positions would reach 619 million; but if it falls below $76,000, the liquidation intensity of long positions would be 661 million. In other words, there are more shorts stacked overhead, and longs aren’t doing great either below—this week looks more like a two-way minefield than a one-directional trend.
The real variable may be outside the chart. Next week features Non-Farm Payrolls (the last report before the September 16 rate decision), the G20 central bank governors’ meeting, and Broadcom/DeLL AI earnings all in the same week. Weakness in the NFP would reinforce expectations for “slower rate hikes,” while the AI capex storyline (with Nvidia’s valuation still considered possibly undervalued by Tom Lee, and Dell/AMD/Broadcom orders validating demand) if it keeps strengthening could raise the linkage risk between dollar liquidity and high-multiple assets—more than the $80,000 line itself.
Personal opinion only, not investment advice.
#比特币 #BTC #非农就业数据 #首笔抗量子比特币交易主网完成 $ZEC $ETH $BTC
This technical analysis from Rekt Capital is definitely worth thinking about: Bitcoin’s February 2026 and June 2026 stage lows line up almost perfectly in price, and the RSI oversold levels are also nearly identical—textbook “double bottom.” But when you zoom in on the high end, it doesn’t hold up. Compared with the May high, this rebound really did set a new high and even tested around $80,000, yet the RSI’s overbought strength is clearly weaker. Higher price, weaker momentum—that’s a classic hidden bearish divergence. So $80,000 isn’t just a psychological integer level, but a psychological resistance zone where this divergence can—or can’t—be invalidated.
The liquidation chart provides another layer of confirmation. According to Coinglass, if BTC breaks above $80,000, the total liquidation intensity of mainstream CEX short positions would reach 619 million; but if it falls below $76,000, the liquidation intensity of long positions would be 661 million. In other words, there are more shorts stacked overhead, and longs aren’t doing great either below—this week looks more like a two-way minefield than a one-directional trend.
The real variable may be outside the chart. Next week features Non-Farm Payrolls (the last report before the September 16 rate decision), the G20 central bank governors’ meeting, and Broadcom/DeLL AI earnings all in the same week. Weakness in the NFP would reinforce expectations for “slower rate hikes,” while the AI capex storyline (with Nvidia’s valuation still considered possibly undervalued by Tom Lee, and Dell/AMD/Broadcom orders validating demand) if it keeps strengthening could raise the linkage risk between dollar liquidity and high-multiple assets—more than the $80,000 line itself.
Personal opinion only, not investment advice.
#比特币 #BTC #非农就业数据 #首笔抗量子比特币交易主网完成 $ZEC $ETH $BTC