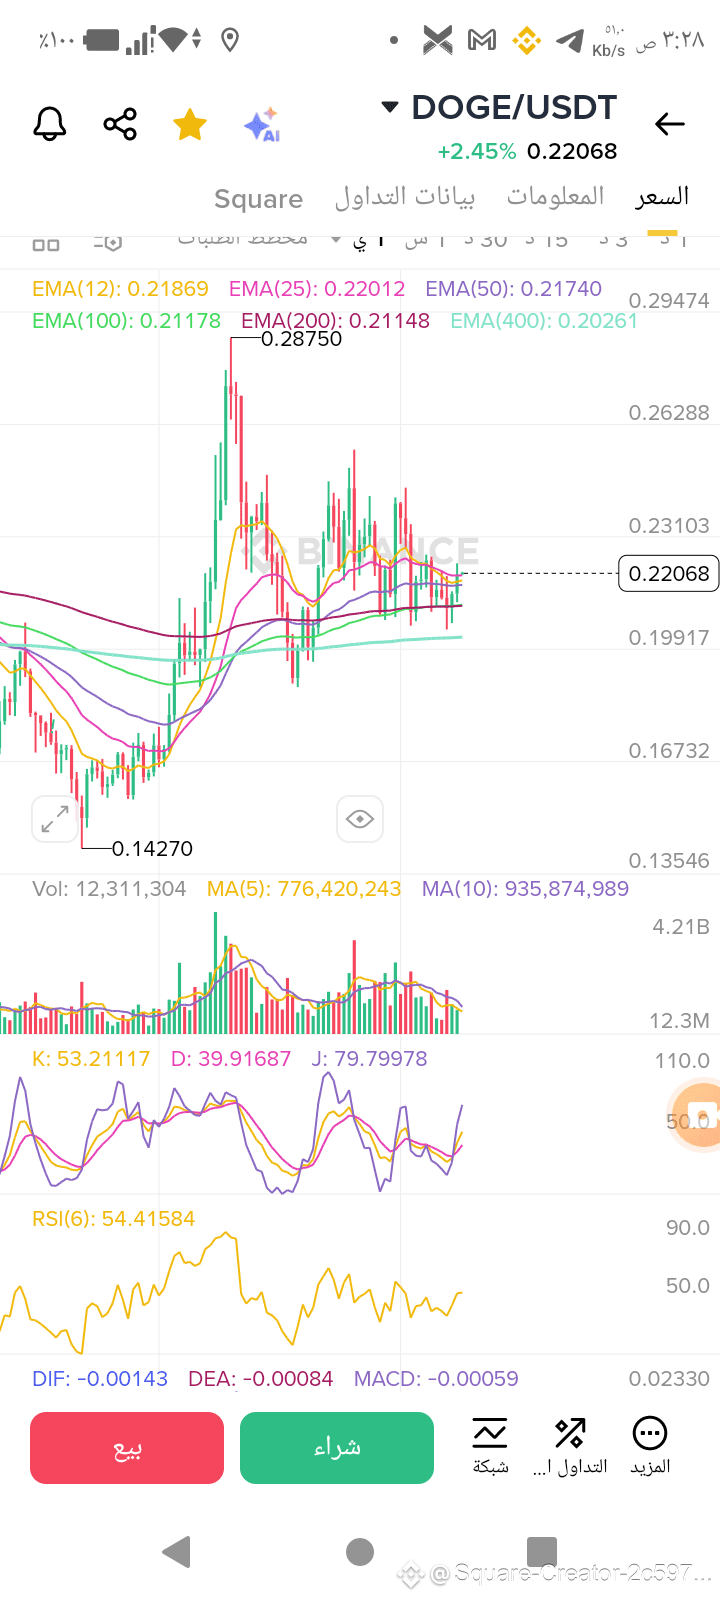
Done ✅ I saw the chart for Doge/USDT:
📊 Technical analysis from the image:
Current price: 0.22068 (+2.45%).
Moving Averages (EMA):
EMA 12 (0.21869) is above EMA 25 and EMA 50, which gives a short-term positive signal.
The price is close to EMA 25 and EMA 50, meaning the market is in a support/resistance testing area.
Indicators:
RSI (54.4): Neutral leaning towards bullish (above 50).
MACD: Close to zero with a weak bullish crossover signal (positive but not strong).
Stochastic K (53) and D (39): Crossover upwards, bullish signal.
Trading volumes: Medium and not very strong, indicating that the movement may not be strong without additional liquidity.
📈 Conclusion:
The current short-term trend is leaning towards gradual upward movement (light Bullish).
If the price breaks the level of 0.2310 with a strong close and large trading volume → continuation of the rise.
If it breaks the level of 0.1990 downwards → possibility of a decline.
🔑 Important levels:
Support: 0.199 – 0.202
Resistance: 0.231 – 0.262
Simplified analysis: The price is now in a consolidation area, leaning towards an upward movement provided it breaks the nearby resistance.
📊 Technical analysis from the image:
Current price: 0.22068 (+2.45%).
Moving Averages (EMA):
EMA 12 (0.21869) is above EMA 25 and EMA 50, which gives a short-term positive signal.
The price is close to EMA 25 and EMA 50, meaning the market is in a support/resistance testing area.
Indicators:
RSI (54.4): Neutral leaning towards bullish (above 50).
MACD: Close to zero with a weak bullish crossover signal (positive but not strong).
Stochastic K (53) and D (39): Crossover upwards, bullish signal.
Trading volumes: Medium and not very strong, indicating that the movement may not be strong without additional liquidity.
📈 Conclusion:
The current short-term trend is leaning towards gradual upward movement (light Bullish).
If the price breaks the level of 0.2310 with a strong close and large trading volume → continuation of the rise.
If it breaks the level of 0.1990 downwards → possibility of a decline.
🔑 Important levels:
Support: 0.199 – 0.202
Resistance: 0.231 – 0.262
Simplified analysis: The price is now in a consolidation area, leaning towards an upward movement provided it breaks the nearby resistance.