

💹 It can be seen that $LINK is attempting to close weekly above the macro downtrend line. A successful retest of the downtrend could propel LINK to revisit the macro range high. This article will analyze the price change of LINK token.
1. On-chain Analysis 1️⃣
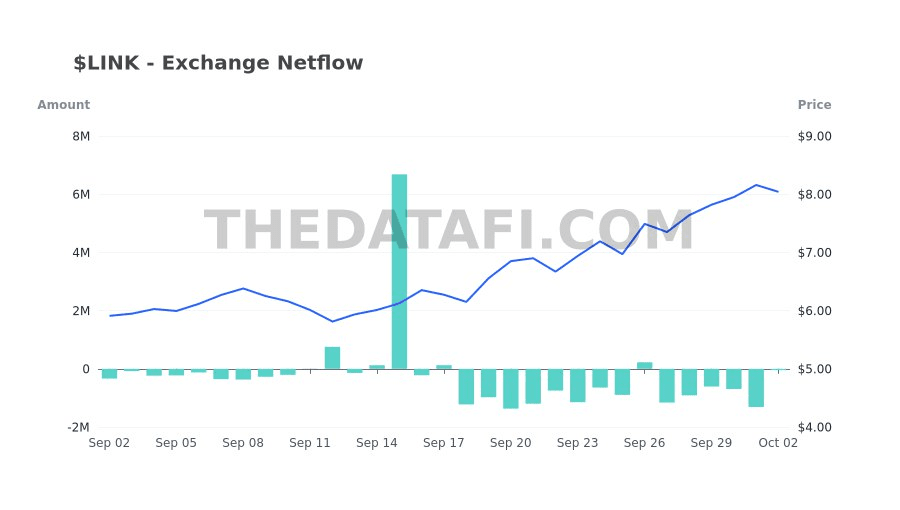
Exchange NetFlow
In the last 30 days, $LINK has undergone substantial exchanges. The largest trend was $41.66M (12.62% volume 24H) deposited on 15/09. Following a consecutive trend of $67.01M in total were withdrawn (18/09 - 25/09). The largest price fluctuation was +54.16% on 22/09.
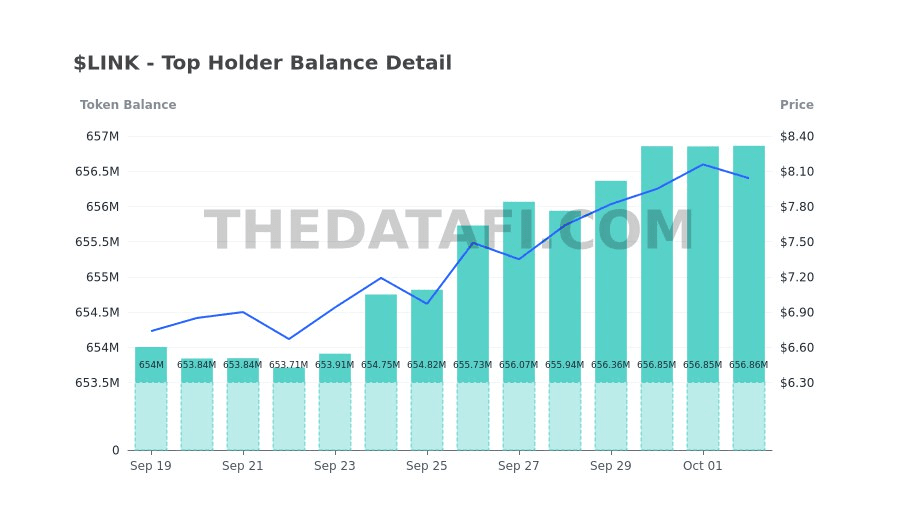
Top Holder - Brief Summary
With a total of 200 Wallets analyzed, the total amount of #LINK they are currently holding is 656.86M ($5.28B), which
+ Balance Change 24H was +$67.53K (0.00%)
+ Balance Change 14D was +$22.97M (0.44%)
We also rank Top wallets according to their dominance in LINK market.
+ From 1 to 20 - 67.75%
+ From 21 to 50 - 10.87%
+ From 51 to 100 - 8.02%
+ From 101 to 150 - 3.4%
+ From 151 to 200 - 2.23%
+ Ranking of above 200 - 7.72%
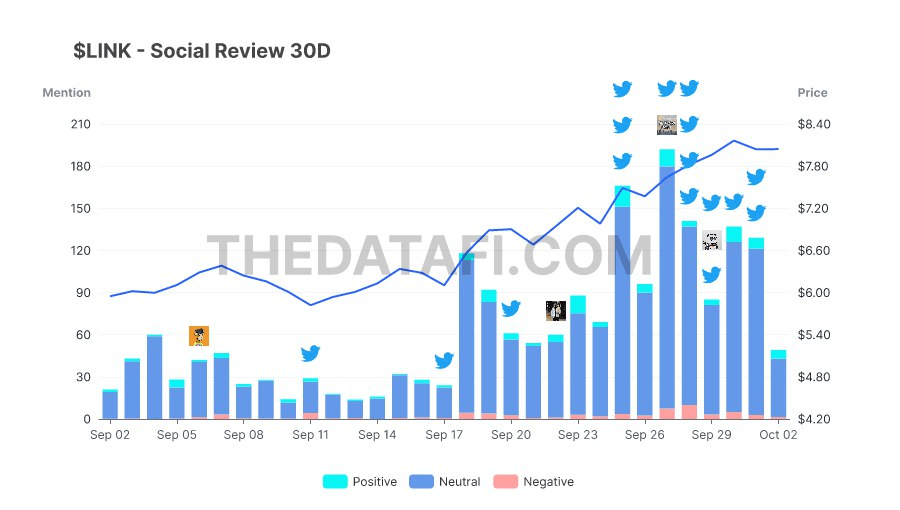
Social Review
Being mentioned about 2000 times on many Social platforms, as well as Accounts Mentioned at 543 times. The Social Sentiment for #LINK is relatively neutral with 4% of the posts being positive for the tokens and only 3% as being negative.
2. Technical Analysis 2️⃣
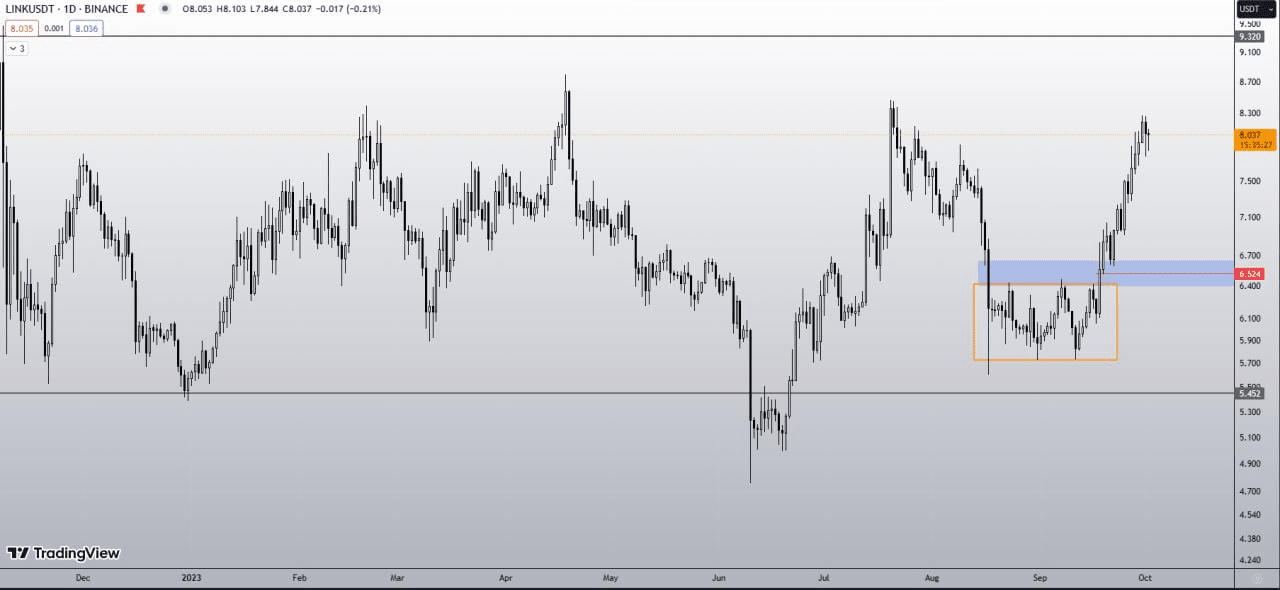
- 1W chart: $LINK has been trading within a price range of 5.3$ - 9$ for over a year.
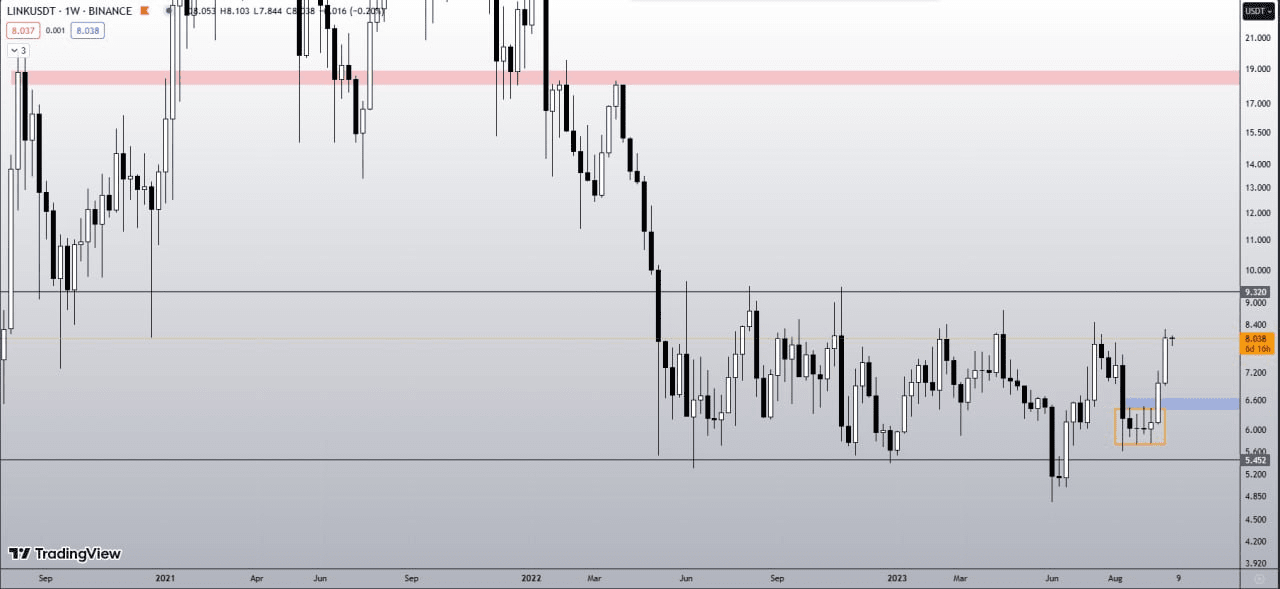
- 1D chart: After successfully breaking out of the trading range between 5.7$ - 6.4$. #LINK is currently making its way towards a significant resistance level (around 9$). If it breaks above the range, we should keep an eye on the price area around $18.
👉 The key level on 1D is around 6.5$.
🎯 Insights
DEX Trades 7D: Dolphins took profit. Their Buy Volume on DEXs was $9.1K and Sell Volume was $118.32K. PnL 7D changed from $217.82K to $283.14K.
