
Bit_Guru
42.4k Posts

Bit_Guru
 Square Verified+
Report
Block User
Only Live Trader on Binance Square 💛 // Binance, CMC & X kols handle @bitgu_ru // PnL is always Live

Live Trader

Creator Awards 2024
Open Trade
Frequent Trader
2.6 Years
63 Following
156.6K+ Followers
300.5K+ Liked
3 Badges
Posts
Portfolio
All
Quotes
Videos
Live
PINNED
·
--
Article
See translation
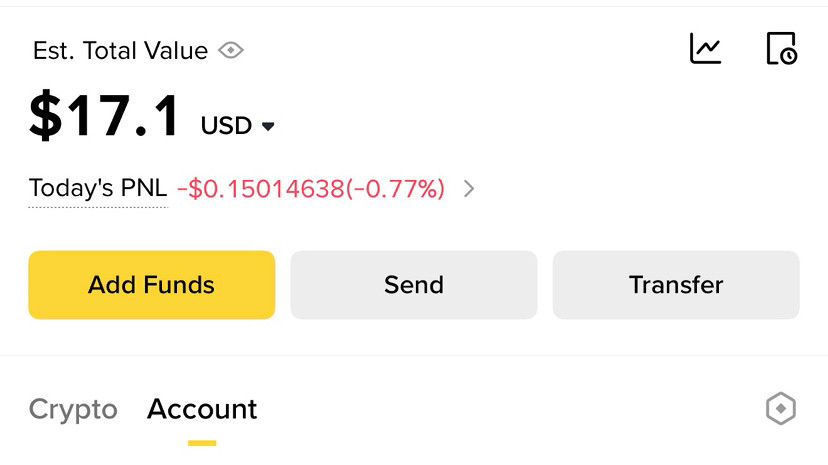
Is it possible to make $100 with only $17Many people think you need a big account to make real money in trading. That’s not true. The truth is simple it’s not about how much you start with, it’s about how you manage what you have.
Yes, it is absolutely possible to turn $17 into $100. But not by luck, not by gambling, and definitely not by chasing every pump you see. It requires discipline, patience, and a clear plan.
First, you need to understand one thing: small capital requires smart execution. You can’t afford big mistakes. One bad trade with high risk can wipe out your account. That’s why risk management becomes your strongest weapon.
Set a daily target. It doesn’t need to be huge. Even 3%–5% per day is enough. It may sound small, but consistency compounds faster than you think. If you stay disciplined, those small wins start building into something big.
Second, patience is everything. You don’t need to trade every day or every setup. Wait for clear opportunities strong support and resistance, clean breakouts, or obvious rejection zones. The market always gives chances, but only patient traders take the right ones.
Third, control your emotions. With a small account, people often overtrade because they want fast results. That’s where most fail. They increase leverage, take random entries, and ignore their plan. You have to do the opposite stay calm, follow your setup, and accept slow growth.
Another important point is consistency over hype. You don’t need one big win. You need many small correct decisions. That’s what builds your account. Even if you grow your account from $17 to $20, then $25, then $35 you are already winning.
Also, protect your capital at all costs. If you lose your account, the journey ends. If you protect it, you always have another chance.
In simple terms:
You don’t grow a small account by rushing
You grow it by repeating a disciplined process again and again
So yes, turning $17 into $100 is possible. But only for those who are willing to stay patient, follow a plan, and trade with control instead of emotion.
The market rewards consistency, not desperation
Start small
Stay focused
And let your discipline do the work
Trade Only coins Like $ETH , $BNB & $SOL
#cryptotradingpro #RiskManagementMastery
{future}(ETHUSDT)
{future}(BNBUSDT)
{future}(SOLUSDT)
Is it possible to make $100 with only $17
Many people think you need a big account to make real money in trading. That’s not true. The truth is simple it’s not about how much you start with, it’s about how you manage what you have.
Yes, it is absolutely possible to turn $17 into $100. But not by luck, not by gambling, and definitely not by chasing every pump you see. It requires discipline, patience, and a clear plan.
First, you need to understand one thing: small capital requires smart execution. You can’t afford big mistakes. One bad trade with high risk can wipe out your account. That’s why risk management becomes your strongest weapon.
Set a daily target. It doesn’t need to be huge. Even 3%–5% per day is enough. It may sound small, but consistency compounds faster than you think. If you stay disciplined, those small wins start building into something big.
Second, patience is everything. You don’t need to trade every day or every setup. Wait for clear opportunities strong support and resistance, clean breakouts, or obvious rejection zones. The market always gives chances, but only patient traders take the right ones.
Third, control your emotions. With a small account, people often overtrade because they want fast results. That’s where most fail. They increase leverage, take random entries, and ignore their plan. You have to do the opposite stay calm, follow your setup, and accept slow growth.
Another important point is consistency over hype. You don’t need one big win. You need many small correct decisions. That’s what builds your account. Even if you grow your account from $17 to $20, then $25, then $35 you are already winning.
Also, protect your capital at all costs. If you lose your account, the journey ends. If you protect it, you always have another chance.
In simple terms:
You don’t grow a small account by rushing
You grow it by repeating a disciplined process again and again
So yes, turning $17 into $100 is possible. But only for those who are willing to stay patient, follow a plan, and trade with control instead of emotion.
The market rewards consistency, not desperation
Start small
Stay focused
And let your discipline do the work
Trade Only coins Like $ETH , $BNB & $SOL
#cryptotradingpro #RiskManagementMastery
Yes, it is absolutely possible to turn $17 into $100. But not by luck, not by gambling, and definitely not by chasing every pump you see. It requires discipline, patience, and a clear plan.
First, you need to understand one thing: small capital requires smart execution. You can’t afford big mistakes. One bad trade with high risk can wipe out your account. That’s why risk management becomes your strongest weapon.
Set a daily target. It doesn’t need to be huge. Even 3%–5% per day is enough. It may sound small, but consistency compounds faster than you think. If you stay disciplined, those small wins start building into something big.
Second, patience is everything. You don’t need to trade every day or every setup. Wait for clear opportunities strong support and resistance, clean breakouts, or obvious rejection zones. The market always gives chances, but only patient traders take the right ones.
Third, control your emotions. With a small account, people often overtrade because they want fast results. That’s where most fail. They increase leverage, take random entries, and ignore their plan. You have to do the opposite stay calm, follow your setup, and accept slow growth.
Another important point is consistency over hype. You don’t need one big win. You need many small correct decisions. That’s what builds your account. Even if you grow your account from $17 to $20, then $25, then $35 you are already winning.
Also, protect your capital at all costs. If you lose your account, the journey ends. If you protect it, you always have another chance.
In simple terms:
You don’t grow a small account by rushing
You grow it by repeating a disciplined process again and again
So yes, turning $17 into $100 is possible. But only for those who are willing to stay patient, follow a plan, and trade with control instead of emotion.
The market rewards consistency, not desperation
Start small
Stay focused
And let your discipline do the work
Trade Only coins Like $ETH , $BNB & $SOL
#cryptotradingpro #RiskManagementMastery
312
55
744
689k
PINNED
·
--
Bullish
See translation
It took me 4 years in the crypto market to realize these things & you only need 2 minutes to read: 🤏
1. No matter the market condition, one thing stays the same: 8% of people will own 21 million Bitcoin.
2. Financial, capital, and risk management skills are 100 times more important than technical analysis or crypto research.
3. Earning while you sleep: There are many ways to make money in the crypto market without actively trading.
On average, #Bitcoin has increased more than 100% per year over the past 15 years. Yet, why do so few people make money? Because getting rich quickly is a common mentality. If you can't dedicate at least 4 hours a day to crypto, stick to Bitcoin and ETH—70% in BTC and 30% in ETH.
Trust no one: Trust leads to hope, disappointment, and errors. Learn independently and take responsibility for your actions. This is how to gain automatic minting experience!
The ultimate goal of investing: Make life more meaningful. If crypto investing can achieve that, do it. If not, reconsider.
Crypto is now a financial market: Originally born from technology, it's now influenced by macroeconomics and connected to mainstream financial markets.
People may discourage you from buying Bitcoin, but remember, once something is widely accepted, the opportunity might be gone. Seize your chance now!
Invest wisely, make meaningful choices, and let crypto pave the way to a better future.
#CryptoInvesting #ethbeta #Write2Earn! #BinanceTurns7 $BTC $ETH $SOL
{spot}(SOLUSDT)
{spot}(ETHUSDT)
{spot}(BTCUSDT)
It took me 4 years in the crypto market to realize these things & you only need 2 minutes to read: 🤏
1. No matter the market condition, one thing stays the same: 8% of people will own 21 million Bitcoin.
2. Financial, capital, and risk management skills are 100 times more important than technical analysis or crypto research.
3. Earning while you sleep: There are many ways to make money in the crypto market without actively trading.
On average, #Bitcoin has increased more than 100% per year over the past 15 years. Yet, why do so few people make money? Because getting rich quickly is a common mentality. If you can't dedicate at least 4 hours a day to crypto, stick to Bitcoin and ETH—70% in BTC and 30% in ETH.
Trust no one: Trust leads to hope, disappointment, and errors. Learn independently and take responsibility for your actions. This is how to gain automatic minting experience!
The ultimate goal of investing: Make life more meaningful. If crypto investing can achieve that, do it. If not, reconsider.
Crypto is now a financial market: Originally born from technology, it's now influenced by macroeconomics and connected to mainstream financial markets.
People may discourage you from buying Bitcoin, but remember, once something is widely accepted, the opportunity might be gone. Seize your chance now!
Invest wisely, make meaningful choices, and let crypto pave the way to a better future.
#CryptoInvesting #ethbeta #Write2Earn! #BinanceTurns7 $BTC $ETH $SOL
1. No matter the market condition, one thing stays the same: 8% of people will own 21 million Bitcoin.
2. Financial, capital, and risk management skills are 100 times more important than technical analysis or crypto research.
3. Earning while you sleep: There are many ways to make money in the crypto market without actively trading.
On average, #Bitcoin has increased more than 100% per year over the past 15 years. Yet, why do so few people make money? Because getting rich quickly is a common mentality. If you can't dedicate at least 4 hours a day to crypto, stick to Bitcoin and ETH—70% in BTC and 30% in ETH.
Trust no one: Trust leads to hope, disappointment, and errors. Learn independently and take responsibility for your actions. This is how to gain automatic minting experience!
The ultimate goal of investing: Make life more meaningful. If crypto investing can achieve that, do it. If not, reconsider.
Crypto is now a financial market: Originally born from technology, it's now influenced by macroeconomics and connected to mainstream financial markets.
People may discourage you from buying Bitcoin, but remember, once something is widely accepted, the opportunity might be gone. Seize your chance now!
Invest wisely, make meaningful choices, and let crypto pave the way to a better future.
#CryptoInvesting #ethbeta #Write2Earn! #BinanceTurns7 $BTC $ETH $SOL

302
102
2.2k
1.1M
·
--
See translation
$MTL caught my eye… 👀🔥 UP!
Entry: 0.31303 - 0.31334
SL: 0.31164
TP1: 0.3167 | TP2: 0.31838 | TP3: 0.32005
$MTL caught my eye… 👀🔥 UP!
Entry: 0.31303 - 0.31334
SL: 0.31164
TP1: 0.3167 | TP2: 0.31838 | TP3: 0.32005
Entry: 0.31303 - 0.31334
SL: 0.31164
TP1: 0.3167 | TP2: 0.31838 | TP3: 0.32005
107
·
--
See translation
Wait wait wait… 🚨 $POWR UP!
Entry: 0.072271 - 0.072344
SL: 0.071801
TP1: 0.073386 | TP2: 0.073907 | TP3: 0.074428
Wait wait wait… 🚨 $POWR UP!
Entry: 0.072271 - 0.072344
SL: 0.071801
TP1: 0.073386 | TP2: 0.073907 | TP3: 0.074428
Entry: 0.072271 - 0.072344
SL: 0.071801
TP1: 0.073386 | TP2: 0.073907 | TP3: 0.074428
321
·
--
See translation
$FOLKS caught my eye… 👀🔥 DOWN!
Entry: 1.972 - 1.974
SL: 1.9848
TP1: 1.951 | TP2: 1.9406 | TP3: 1.9301
$FOLKS caught my eye… 👀🔥 DOWN!
Entry: 1.972 - 1.974
SL: 1.9848
TP1: 1.951 | TP2: 1.9406 | TP3: 1.9301
Entry: 1.972 - 1.974
SL: 1.9848
TP1: 1.951 | TP2: 1.9406 | TP3: 1.9301
349
·
--
See translation
Look at $BNB … 👀🚨 DOWN setup!
Entry: 727.073 - 727.8
SL: 729.503
TP1: 723.803 | TP2: 722.168 | TP3: 720.533
Look at $BNB … 👀🚨 DOWN setup!
Entry: 727.073 - 727.8
SL: 729.503
TP1: 723.803 | TP2: 722.168 | TP3: 720.533
Entry: 727.073 - 727.8
SL: 729.503
TP1: 723.803 | TP2: 722.168 | TP3: 720.533
343
·
--
See translation
Allora (ALLO) Faces Continued Selling Pressure as Short-Term Structure Weakens𝗔 𝘀𝗵𝗮𝗿𝗽 𝘀𝗲𝗹𝗹-𝗼𝗳𝗳 𝗽𝘂𝘁𝘀 𝗔𝗹𝗹𝗼𝗿𝗮 𝗯𝗮𝗰𝗸 𝗼𝗻 𝘁𝗵𝗲 𝘁𝗿𝗮𝗱𝗲𝗿’𝘀 𝗿𝗮𝗱𝗮𝗿
ALLOUSDT is showing a clear loss of momentum in the latest market snapshot. Binance records a price of 0.22224 USDT, down 5.922% over the measured 24-hour period. Quote volume is approximately 7.02 million USDT, with more than 30.58 million ALLO traded. CoinGecko’s snapshot is similar, showing a price of 0.222499 US dollars, a 5.79% daily decline, and roughly 5.70 million dollars in total volume.
Price is sitting close to the session low after a sequence of lower highs, while trading activity remains meaningful. Bit Guru’s RR Trader scanner selected ALLOUSDT as a TOP_LOSER candidate and returned a SHORT direction with a 96.85 confidence score. That score reflects the scanner’s internal pattern reading rather than a certainty about the next market move. The key issue is whether selling pressure continues or whether the recent decline produces a relief bounce.
𝗪𝗵𝗮𝘁 𝗔𝗹𝗹𝗼𝗿𝗮 𝗶𝘀 𝗮𝗻𝗱 𝘄𝗵𝗮𝘁 𝗶𝘁 𝗮𝗶𝗺𝘀 𝘁𝗼 𝘀𝗼𝗹𝘃𝗲
Allora is described in the supplied project data as a decentralized intelligence network designed to make artificial intelligence more adaptive, collaborative, and efficient. Its core concept is to coordinate specialized AI models in real time rather than rely on one model or one fixed source of intelligence.
The network is intended to let participants contribute models, data, or validation. These inputs are combined to produce what the project describes as superior inferences for users and applications. In practical terms, Allora is positioned for applications that need changing, context-sensitive predictions instead of static outputs. The stated target areas include AI agents, decentralized finance systems, and cross-chain AI applications.
That is the available project description in the research. The supplied data does not provide a detailed account of Allora’s founding team, incorporation history, original launch date, or first deployment. Those background details cannot be established from this material.
𝗨𝘁𝗶𝗹𝗶𝘁𝘆 𝗮𝗻𝗱 𝗲𝗰𝗼𝘀𝘆𝘀𝘁𝗲𝗺 𝗱𝗮𝘁𝗮
The documented utility of the Allora ecosystem is connected to intelligence production and coordination. Users and applications can consume inferences, while contributors can provide models, data, or validation. The project is positioned as a network for machine intelligence that develops through the participation and evaluation of specialized contributors.
The available ecosystem categories associate Allora with artificial intelligence, AI frameworks, BNB Chain, Base, Binance Alpha Spotlight, and Base Native. Contract references are included for Ethereum, BNB Chain, and Base, indicating that ALLO-related token references exist across those networks. However, the research does not provide a complete breakdown of how the token is used for network fees, staking, governance, rewards, model access, validation, or settlement. Those specific utility details remain unavailable.
The same limitation applies to adoption metrics. The research includes no total value locked figure, developer activity statistics, or application usage data. CoinGecko reports total value locked as unavailable. The project’s decentralized AI description provides context, but it does not quantify active users, recurring demand, or the amount of network activity connected to ALLO.
𝗦𝘂𝗽𝗽𝗹𝘆, 𝘃𝗮𝗹𝘂𝗮𝘁𝗶𝗼𝗻, 𝗮𝗻𝗱 𝘁𝗵𝗲 𝗱𝗶𝗹𝘂𝘁𝗶𝗼𝗻 𝗾𝘂𝗲𝘀𝘁𝗶𝗼𝗻
The verified token figures show a maximum supply of 1 billion ALLO, total supply of approximately 788.19 million, and circulating supply of approximately 250.07 million. At the supplied CoinGecko price, the reported market capitalization is about 55.65 million dollars, while fully diluted valuation is about 175.40 million dollars. CoinGecko ranks the asset around 421 by market capitalization in this snapshot.
Circulating supply represents roughly 25% of the stated maximum supply. The reported market-cap-to-FDV ratio is 0.32, showing a substantial difference between the current circulating amount and the maximum supply. The data does not provide an unlock calendar, vesting schedule, allocation table, or dates for future emissions. It is therefore not possible to determine from this research when additional tokens may enter the market or how they may be distributed.
If network growth creates sufficient demand, future supply could be absorbed. If demand remains weak while more tokens become tradable, dilution could weigh on price. For ALLO, the difference between circulating supply and maximum supply is an important medium-term variable, although the available figures do not establish how that supply will enter the market.
ALLO remains well below its recorded all-time high of 1.60 dollars on November 11, 2025. The supplied data places the token approximately 86% below that peak. It is also well above the recorded all-time low of approximately 0.04769 dollars from February 5, 2026. This wide historical range highlights the token’s volatility and shows why previous highs and lows do not establish future price targets.
𝗧𝗵𝗲 𝗰𝘂𝗿𝗿𝗲𝗻𝘁 𝗺𝗮𝗿𝗸𝗲𝘁 𝘀𝘁𝗿𝘂𝗰𝘁𝘂𝗿𝗲 𝗿𝗲𝗺𝗮𝗶𝗻𝘀 𝘄𝗲𝗮𝗸
The Binance ticker records an open price of 0.23623 and a latest price of 0.22224, with a 24-hour high of 0.23761 and low of 0.22200. The weighted average price is 0.2295299, leaving the latest trade below the day’s average activity area. CoinGecko’s figures similarly show a high near 0.23725 and a low near 0.22241.
The hourly candles show a gradual decline through several lower zones. ALLO traded around 0.235 to 0.237 early in the measured period, then moved through 0.231, 0.228, 0.225, and 0.223 areas. There were several pauses and attempted rebounds, but the recoveries did not establish a higher high. The latest hourly data is around 0.22224, close to the session floor.
The four-hour structure shows an earlier spike to 0.25083 followed by a retreat. That expansion candle traded more than 33.86 million ALLO, and the following four-hour periods produced lower closes and lower trading ranges. The supplied candles are consistent with a failed continuation after a sharp expansion, although the research does not establish why the spike occurred.
The broader performance data reinforces the recent weakness. ALLO is down 10.46% over seven days, 12.20% over 14 days, 17.73% over 30 days, and 41.32% over 60 days. The 200-day change remains positive at 111.92%, meaning the longer-term recovery from earlier lows has not been erased even though the recent trend is negative.
𝗪𝗵𝘆 𝘁𝗵𝗲 𝘀𝗰𝗮𝗻𝗻𝗲𝗿 𝗶𝗱𝗲𝗻𝘁𝗶𝗳𝗶𝗲𝘀 𝗮 𝘀𝗵𝗼𝗿𝘁 𝘀𝗲𝘁𝘂𝗽
The scanner lists a current price of 0.22236 and a proposed entry zone from 0.22247118 to 0.22269354. That area is slightly above the latest market price, which fits a pullback-based framework: the system is looking for a revisit of a nearby overhead zone rather than relying on a continuation at the session low.
The scanner marks 0.22315239 as resistance and 0.21199780 as support. Its invalidation point, labelled stop loss, is 0.22406164. The projected downside levels are 0.21940822, 0.21787674, and 0.21634527. The displayed risk-reward figure is 2.23883542585787. The setup also carries a hot priority of 9.45525, a selection score of 174.61, and a TOP_LOSER rank of 13.
The internal reading appears to reflect momentum, proximity to resistance, and the sequence of lower highs. The 15-minute move is negative at -0.825%, while the scanner reports a volume ratio of 1.22297. In plain terms, recent activity is above its comparison baseline while price is still weakening. That combination can accompany continuation, but it can also reflect late participation after a significant decline.
A 96.85 confidence reading does not remove slippage, sudden reversals, liquidation risk, or the possibility that price does not revisit the proposed entry area. The listed levels are reference points for evaluating structure, not outcomes established in advance.
𝗕𝗶𝘁𝗰𝗼𝗶𝗻’𝘀 𝘀𝘁𝗮𝗯𝗶𝗹𝗶𝘁𝘆 𝗺𝗮𝗸𝗲𝘀 𝗔𝗟𝗟𝗢’𝘀 𝘄𝗲𝗮𝗸𝗻𝗲𝘀𝘀 𝗺𝗼𝗿𝗲 𝗻𝗼𝘁𝗶𝗰𝗲𝗮𝗯𝗹𝗲
Bitcoin’s supplied Binance snapshot shows BTC at 77,194.20 USDT, up 0.022% over the measured 24-hour period. Its range is 77,025.10 to 77,477.40, with more than 3.01 billion USDT in quote volume. This is a relatively stable Bitcoin backdrop rather than a major BTC sell-off.
That context makes ALLO’s decline more distinct. ALLO is down almost 6% while BTC is nearly flat. One possible interpretation is that the selling pressure is specific to ALLO or to the lower-cap AI and altcoin segment, rather than being caused by a broad Bitcoin decline. The research does not include enough data to confirm that interpretation across the wider altcoin market.
A sudden Bitcoin move could still affect ALLO. Stronger BTC momentum may influence risk appetite across digital assets, while a sharp BTC reversal could add pressure to weaker altcoins. The supplied research does not include total crypto market capitalization, Bitcoin dominance, funding rates, or a full altcoin index, so broader market conditions cannot be classified from this snapshot alone.
𝗡𝗲𝘄𝘀 𝗴𝗮𝗽𝘀 𝗮𝗻𝗱 𝗽𝗼𝘀𝘀𝗶𝗯𝗹𝗲 𝗰𝗵𝗮𝗻𝗴𝗲𝘀 𝗶𝗻 𝘁𝗵𝗲 𝗽𝗶𝗰𝘁𝘂𝗿𝗲
The supplied data lists no recent verified news items for Allora. There is no confirmed partnership, product release, exchange announcement, governance event, token unlock notice, or protocol upgrade included in the research. This does not establish that no news exists elsewhere; it means no verified catalyst is available in the material supporting this analysis.
Evidence of real Allora usage, new applications consuming its intelligence, stronger model participation, or measurable developer and user growth could affect the fundamental narrative. Clearer information about token utility, staking, governance, or emissions could also make the asset easier to evaluate. None of those developments is confirmed in the supplied data.
On the technical side, a reclaim of 0.22315 and especially 0.22406 would weaken the scanner’s immediate bearish structure. A move through those areas with rising volume could turn the current breakdown into a failed breakdown. Conversely, rejection below resistance followed by a move through 0.21941 would keep the continuation framework active, with 0.21788 and 0.21635 as additional scanner reference points.
The larger support marker at 0.21200 sits below the three projected targets. A decisive break there would indicate that the market is searching for a lower range. A defense of that level alongside improving volume and a higher low would provide evidence that selling pressure is easing.
𝗥𝗶𝘀𝗸𝘀 𝗮𝗻𝗱 𝘁𝗵𝗲 𝗺𝗮𝗶𝗻 𝗱𝗮𝘁𝗮 𝗴𝗮𝗽𝘀
The first risk is that ALLO has already fallen substantially over a relatively short period. The 60-day decline of more than 41% raises the possibility of a sharp countertrend bounce, even if the broader structure remains weak. A reversal can become more pronounced when selling meets limited liquidity or when an unexpected development changes sentiment.
The second risk is token supply. With approximately 250.07 million ALLO circulating against a 1 billion maximum, future distribution could create continuing pressure. Because the research does not show an unlock schedule or allocation structure, the timing and scale of that pressure cannot be modeled from the available figures. The gap between market capitalization and FDV is therefore a material uncertainty.
The third risk is execution. The scanner’s entry zone sits just above the current price, and the proposed invalidation level is only a small distance higher. Tokens with this market profile can move through nearby levels quickly when volume expands. The Binance ticker reports 167,674 trades in the measured period, but trade count alone does not reveal order-book depth or slippage.
There is also a fundamental verification gap. The AI use case is clearly described, but the available data does not quantify active users, protocol revenue, model quality, developer activity, or demand for ALLO itself. The project has a defined architecture, yet the token’s long-term value depends on adoption that cannot be confirmed from these figures alone.
Open interest is reported at 38,741,867 ALLO. Without a longer history or funding data, that figure cannot establish whether traders are positioned for further downside. The most relevant observations remain price behavior around 0.22315 to 0.22406, reactions at 0.21941, 0.21788, 0.21635, and 0.21200, changes in volume and open interest, Bitcoin’s direction, and any verified information about utility, emissions, or network usage.
𝗕𝗮𝗹𝗮𝗻𝗰𝗲𝗱 𝗰𝗼𝗻𝗰𝗹𝘂𝘀𝗶𝗼𝗻
ALLOUSDT is notable because the technical and fundamental stories are developing at different speeds. Technically, recent evidence is weak: price is down across most short and medium timeframes, the four-hour chart shows a retreat from 0.25083, and the scanner identifies a short setup near nearby resistance. Bitcoin’s stability makes ALLO’s relative weakness more visible.
Fundamentally, Allora belongs to the decentralized AI category. Its stated goal is to coordinate specialized models, data, and validation for adaptive intelligence across AI agents, decentralized finance systems, and cross-chain applications. That concept could become more important if measurable network use develops. However, the supplied research does not verify the scale of adoption, and the token data shows a substantial difference between circulating supply and maximum supply.
The clearest reading is that ALLO is a high-volatility AI token in a weak short-term structure, while its longer-term project case remains incomplete from the available evidence. The scanner levels offer a framework for judging whether sellers retain control, but price can reverse before reaching any listed level. Fundamental updates and supply disclosures will be important in determining whether Allora’s network narrative is matched by token demand. The next significant clues are likely to come from price behavior around 0.22315 to 0.22406 and the market’s response to the 0.21200 support zone.
Allora (ALLO) Faces Continued Selling Pressure as Short-Term Structure Weakens
𝗔 𝘀𝗵𝗮𝗿𝗽 𝘀𝗲𝗹𝗹-𝗼𝗳𝗳 𝗽𝘂𝘁𝘀 𝗔𝗹𝗹𝗼𝗿𝗮 𝗯𝗮𝗰𝗸 𝗼𝗻 𝘁𝗵𝗲 𝘁𝗿𝗮𝗱𝗲𝗿’𝘀 𝗿𝗮𝗱𝗮𝗿
ALLOUSDT is showing a clear loss of momentum in the latest market snapshot. Binance records a price of 0.22224 USDT, down 5.922% over the measured 24-hour period. Quote volume is approximately 7.02 million USDT, with more than 30.58 million ALLO traded. CoinGecko’s snapshot is similar, showing a price of 0.222499 US dollars, a 5.79% daily decline, and roughly 5.70 million dollars in total volume.
Price is sitting close to the session low after a sequence of lower highs, while trading activity remains meaningful. Bit Guru’s RR Trader scanner selected ALLOUSDT as a TOP_LOSER candidate and returned a SHORT direction with a 96.85 confidence score. That score reflects the scanner’s internal pattern reading rather than a certainty about the next market move. The key issue is whether selling pressure continues or whether the recent decline produces a relief bounce.
𝗪𝗵𝗮𝘁 𝗔𝗹𝗹𝗼𝗿𝗮 𝗶𝘀 𝗮𝗻𝗱 𝘄𝗵𝗮𝘁 𝗶𝘁 𝗮𝗶𝗺𝘀 𝘁𝗼 𝘀𝗼𝗹𝘃𝗲
Allora is described in the supplied project data as a decentralized intelligence network designed to make artificial intelligence more adaptive, collaborative, and efficient. Its core concept is to coordinate specialized AI models in real time rather than rely on one model or one fixed source of intelligence.
The network is intended to let participants contribute models, data, or validation. These inputs are combined to produce what the project describes as superior inferences for users and applications. In practical terms, Allora is positioned for applications that need changing, context-sensitive predictions instead of static outputs. The stated target areas include AI agents, decentralized finance systems, and cross-chain AI applications.
That is the available project description in the research. The supplied data does not provide a detailed account of Allora’s founding team, incorporation history, original launch date, or first deployment. Those background details cannot be established from this material.
𝗨𝘁𝗶𝗹𝗶𝘁𝘆 𝗮𝗻𝗱 𝗲𝗰𝗼𝘀𝘆𝘀𝘁𝗲𝗺 𝗱𝗮𝘁𝗮
The documented utility of the Allora ecosystem is connected to intelligence production and coordination. Users and applications can consume inferences, while contributors can provide models, data, or validation. The project is positioned as a network for machine intelligence that develops through the participation and evaluation of specialized contributors.
The available ecosystem categories associate Allora with artificial intelligence, AI frameworks, BNB Chain, Base, Binance Alpha Spotlight, and Base Native. Contract references are included for Ethereum, BNB Chain, and Base, indicating that ALLO-related token references exist across those networks. However, the research does not provide a complete breakdown of how the token is used for network fees, staking, governance, rewards, model access, validation, or settlement. Those specific utility details remain unavailable.
The same limitation applies to adoption metrics. The research includes no total value locked figure, developer activity statistics, or application usage data. CoinGecko reports total value locked as unavailable. The project’s decentralized AI description provides context, but it does not quantify active users, recurring demand, or the amount of network activity connected to ALLO.
𝗦𝘂𝗽𝗽𝗹𝘆, 𝘃𝗮𝗹𝘂𝗮𝘁𝗶𝗼𝗻, 𝗮𝗻𝗱 𝘁𝗵𝗲 𝗱𝗶𝗹𝘂𝘁𝗶𝗼𝗻 𝗾𝘂𝗲𝘀𝘁𝗶𝗼𝗻
The verified token figures show a maximum supply of 1 billion ALLO, total supply of approximately 788.19 million, and circulating supply of approximately 250.07 million. At the supplied CoinGecko price, the reported market capitalization is about 55.65 million dollars, while fully diluted valuation is about 175.40 million dollars. CoinGecko ranks the asset around 421 by market capitalization in this snapshot.
Circulating supply represents roughly 25% of the stated maximum supply. The reported market-cap-to-FDV ratio is 0.32, showing a substantial difference between the current circulating amount and the maximum supply. The data does not provide an unlock calendar, vesting schedule, allocation table, or dates for future emissions. It is therefore not possible to determine from this research when additional tokens may enter the market or how they may be distributed.
If network growth creates sufficient demand, future supply could be absorbed. If demand remains weak while more tokens become tradable, dilution could weigh on price. For ALLO, the difference between circulating supply and maximum supply is an important medium-term variable, although the available figures do not establish how that supply will enter the market.
ALLO remains well below its recorded all-time high of 1.60 dollars on November 11, 2025. The supplied data places the token approximately 86% below that peak. It is also well above the recorded all-time low of approximately 0.04769 dollars from February 5, 2026. This wide historical range highlights the token’s volatility and shows why previous highs and lows do not establish future price targets.
𝗧𝗵𝗲 𝗰𝘂𝗿𝗿𝗲𝗻𝘁 𝗺𝗮𝗿𝗸𝗲𝘁 𝘀𝘁𝗿𝘂𝗰𝘁𝘂𝗿𝗲 𝗿𝗲𝗺𝗮𝗶𝗻𝘀 𝘄𝗲𝗮𝗸
The Binance ticker records an open price of 0.23623 and a latest price of 0.22224, with a 24-hour high of 0.23761 and low of 0.22200. The weighted average price is 0.2295299, leaving the latest trade below the day’s average activity area. CoinGecko’s figures similarly show a high near 0.23725 and a low near 0.22241.
The hourly candles show a gradual decline through several lower zones. ALLO traded around 0.235 to 0.237 early in the measured period, then moved through 0.231, 0.228, 0.225, and 0.223 areas. There were several pauses and attempted rebounds, but the recoveries did not establish a higher high. The latest hourly data is around 0.22224, close to the session floor.
The four-hour structure shows an earlier spike to 0.25083 followed by a retreat. That expansion candle traded more than 33.86 million ALLO, and the following four-hour periods produced lower closes and lower trading ranges. The supplied candles are consistent with a failed continuation after a sharp expansion, although the research does not establish why the spike occurred.
The broader performance data reinforces the recent weakness. ALLO is down 10.46% over seven days, 12.20% over 14 days, 17.73% over 30 days, and 41.32% over 60 days. The 200-day change remains positive at 111.92%, meaning the longer-term recovery from earlier lows has not been erased even though the recent trend is negative.
𝗪𝗵𝘆 𝘁𝗵𝗲 𝘀𝗰𝗮𝗻𝗻𝗲𝗿 𝗶𝗱𝗲𝗻𝘁𝗶𝗳𝗶𝗲𝘀 𝗮 𝘀𝗵𝗼𝗿𝘁 𝘀𝗲𝘁𝘂𝗽
The scanner lists a current price of 0.22236 and a proposed entry zone from 0.22247118 to 0.22269354. That area is slightly above the latest market price, which fits a pullback-based framework: the system is looking for a revisit of a nearby overhead zone rather than relying on a continuation at the session low.
The scanner marks 0.22315239 as resistance and 0.21199780 as support. Its invalidation point, labelled stop loss, is 0.22406164. The projected downside levels are 0.21940822, 0.21787674, and 0.21634527. The displayed risk-reward figure is 2.23883542585787. The setup also carries a hot priority of 9.45525, a selection score of 174.61, and a TOP_LOSER rank of 13.
The internal reading appears to reflect momentum, proximity to resistance, and the sequence of lower highs. The 15-minute move is negative at -0.825%, while the scanner reports a volume ratio of 1.22297. In plain terms, recent activity is above its comparison baseline while price is still weakening. That combination can accompany continuation, but it can also reflect late participation after a significant decline.
A 96.85 confidence reading does not remove slippage, sudden reversals, liquidation risk, or the possibility that price does not revisit the proposed entry area. The listed levels are reference points for evaluating structure, not outcomes established in advance.
𝗕𝗶𝘁𝗰𝗼𝗶𝗻’𝘀 𝘀𝘁𝗮𝗯𝗶𝗹𝗶𝘁𝘆 𝗺𝗮𝗸𝗲𝘀 𝗔𝗟𝗟𝗢’𝘀 𝘄𝗲𝗮𝗸𝗻𝗲𝘀𝘀 𝗺𝗼𝗿𝗲 𝗻𝗼𝘁𝗶𝗰𝗲𝗮𝗯𝗹𝗲
Bitcoin’s supplied Binance snapshot shows BTC at 77,194.20 USDT, up 0.022% over the measured 24-hour period. Its range is 77,025.10 to 77,477.40, with more than 3.01 billion USDT in quote volume. This is a relatively stable Bitcoin backdrop rather than a major BTC sell-off.
That context makes ALLO’s decline more distinct. ALLO is down almost 6% while BTC is nearly flat. One possible interpretation is that the selling pressure is specific to ALLO or to the lower-cap AI and altcoin segment, rather than being caused by a broad Bitcoin decline. The research does not include enough data to confirm that interpretation across the wider altcoin market.
A sudden Bitcoin move could still affect ALLO. Stronger BTC momentum may influence risk appetite across digital assets, while a sharp BTC reversal could add pressure to weaker altcoins. The supplied research does not include total crypto market capitalization, Bitcoin dominance, funding rates, or a full altcoin index, so broader market conditions cannot be classified from this snapshot alone.
𝗡𝗲𝘄𝘀 𝗴𝗮𝗽𝘀 𝗮𝗻𝗱 𝗽𝗼𝘀𝘀𝗶𝗯𝗹𝗲 𝗰𝗵𝗮𝗻𝗴𝗲𝘀 𝗶𝗻 𝘁𝗵𝗲 𝗽𝗶𝗰𝘁𝘂𝗿𝗲
The supplied data lists no recent verified news items for Allora. There is no confirmed partnership, product release, exchange announcement, governance event, token unlock notice, or protocol upgrade included in the research. This does not establish that no news exists elsewhere; it means no verified catalyst is available in the material supporting this analysis.
Evidence of real Allora usage, new applications consuming its intelligence, stronger model participation, or measurable developer and user growth could affect the fundamental narrative. Clearer information about token utility, staking, governance, or emissions could also make the asset easier to evaluate. None of those developments is confirmed in the supplied data.
On the technical side, a reclaim of 0.22315 and especially 0.22406 would weaken the scanner’s immediate bearish structure. A move through those areas with rising volume could turn the current breakdown into a failed breakdown. Conversely, rejection below resistance followed by a move through 0.21941 would keep the continuation framework active, with 0.21788 and 0.21635 as additional scanner reference points.
The larger support marker at 0.21200 sits below the three projected targets. A decisive break there would indicate that the market is searching for a lower range. A defense of that level alongside improving volume and a higher low would provide evidence that selling pressure is easing.
𝗥𝗶𝘀𝗸𝘀 𝗮𝗻𝗱 𝘁𝗵𝗲 𝗺𝗮𝗶𝗻 𝗱𝗮𝘁𝗮 𝗴𝗮𝗽𝘀
The first risk is that ALLO has already fallen substantially over a relatively short period. The 60-day decline of more than 41% raises the possibility of a sharp countertrend bounce, even if the broader structure remains weak. A reversal can become more pronounced when selling meets limited liquidity or when an unexpected development changes sentiment.
The second risk is token supply. With approximately 250.07 million ALLO circulating against a 1 billion maximum, future distribution could create continuing pressure. Because the research does not show an unlock schedule or allocation structure, the timing and scale of that pressure cannot be modeled from the available figures. The gap between market capitalization and FDV is therefore a material uncertainty.
The third risk is execution. The scanner’s entry zone sits just above the current price, and the proposed invalidation level is only a small distance higher. Tokens with this market profile can move through nearby levels quickly when volume expands. The Binance ticker reports 167,674 trades in the measured period, but trade count alone does not reveal order-book depth or slippage.
There is also a fundamental verification gap. The AI use case is clearly described, but the available data does not quantify active users, protocol revenue, model quality, developer activity, or demand for ALLO itself. The project has a defined architecture, yet the token’s long-term value depends on adoption that cannot be confirmed from these figures alone.
Open interest is reported at 38,741,867 ALLO. Without a longer history or funding data, that figure cannot establish whether traders are positioned for further downside. The most relevant observations remain price behavior around 0.22315 to 0.22406, reactions at 0.21941, 0.21788, 0.21635, and 0.21200, changes in volume and open interest, Bitcoin’s direction, and any verified information about utility, emissions, or network usage.
𝗕𝗮𝗹𝗮𝗻𝗰𝗲𝗱 𝗰𝗼𝗻𝗰𝗹𝘂𝘀𝗶𝗼𝗻
ALLOUSDT is notable because the technical and fundamental stories are developing at different speeds. Technically, recent evidence is weak: price is down across most short and medium timeframes, the four-hour chart shows a retreat from 0.25083, and the scanner identifies a short setup near nearby resistance. Bitcoin’s stability makes ALLO’s relative weakness more visible.
Fundamentally, Allora belongs to the decentralized AI category. Its stated goal is to coordinate specialized models, data, and validation for adaptive intelligence across AI agents, decentralized finance systems, and cross-chain applications. That concept could become more important if measurable network use develops. However, the supplied research does not verify the scale of adoption, and the token data shows a substantial difference between circulating supply and maximum supply.
The clearest reading is that ALLO is a high-volatility AI token in a weak short-term structure, while its longer-term project case remains incomplete from the available evidence. The scanner levels offer a framework for judging whether sellers retain control, but price can reverse before reaching any listed level. Fundamental updates and supply disclosures will be important in determining whether Allora’s network narrative is matched by token demand. The next significant clues are likely to come from price behavior around 0.22315 to 0.22406 and the market’s response to the 0.21200 support zone.
ALLOUSDT is showing a clear loss of momentum in the latest market snapshot. Binance records a price of 0.22224 USDT, down 5.922% over the measured 24-hour period. Quote volume is approximately 7.02 million USDT, with more than 30.58 million ALLO traded. CoinGecko’s snapshot is similar, showing a price of 0.222499 US dollars, a 5.79% daily decline, and roughly 5.70 million dollars in total volume.
Price is sitting close to the session low after a sequence of lower highs, while trading activity remains meaningful. Bit Guru’s RR Trader scanner selected ALLOUSDT as a TOP_LOSER candidate and returned a SHORT direction with a 96.85 confidence score. That score reflects the scanner’s internal pattern reading rather than a certainty about the next market move. The key issue is whether selling pressure continues or whether the recent decline produces a relief bounce.
𝗪𝗵𝗮𝘁 𝗔𝗹𝗹𝗼𝗿𝗮 𝗶𝘀 𝗮𝗻𝗱 𝘄𝗵𝗮𝘁 𝗶𝘁 𝗮𝗶𝗺𝘀 𝘁𝗼 𝘀𝗼𝗹𝘃𝗲
Allora is described in the supplied project data as a decentralized intelligence network designed to make artificial intelligence more adaptive, collaborative, and efficient. Its core concept is to coordinate specialized AI models in real time rather than rely on one model or one fixed source of intelligence.
The network is intended to let participants contribute models, data, or validation. These inputs are combined to produce what the project describes as superior inferences for users and applications. In practical terms, Allora is positioned for applications that need changing, context-sensitive predictions instead of static outputs. The stated target areas include AI agents, decentralized finance systems, and cross-chain AI applications.
That is the available project description in the research. The supplied data does not provide a detailed account of Allora’s founding team, incorporation history, original launch date, or first deployment. Those background details cannot be established from this material.
𝗨𝘁𝗶𝗹𝗶𝘁𝘆 𝗮𝗻𝗱 𝗲𝗰𝗼𝘀𝘆𝘀𝘁𝗲𝗺 𝗱𝗮𝘁𝗮
The documented utility of the Allora ecosystem is connected to intelligence production and coordination. Users and applications can consume inferences, while contributors can provide models, data, or validation. The project is positioned as a network for machine intelligence that develops through the participation and evaluation of specialized contributors.
The available ecosystem categories associate Allora with artificial intelligence, AI frameworks, BNB Chain, Base, Binance Alpha Spotlight, and Base Native. Contract references are included for Ethereum, BNB Chain, and Base, indicating that ALLO-related token references exist across those networks. However, the research does not provide a complete breakdown of how the token is used for network fees, staking, governance, rewards, model access, validation, or settlement. Those specific utility details remain unavailable.
The same limitation applies to adoption metrics. The research includes no total value locked figure, developer activity statistics, or application usage data. CoinGecko reports total value locked as unavailable. The project’s decentralized AI description provides context, but it does not quantify active users, recurring demand, or the amount of network activity connected to ALLO.
𝗦𝘂𝗽𝗽𝗹𝘆, 𝘃𝗮𝗹𝘂𝗮𝘁𝗶𝗼𝗻, 𝗮𝗻𝗱 𝘁𝗵𝗲 𝗱𝗶𝗹𝘂𝘁𝗶𝗼𝗻 𝗾𝘂𝗲𝘀𝘁𝗶𝗼𝗻
The verified token figures show a maximum supply of 1 billion ALLO, total supply of approximately 788.19 million, and circulating supply of approximately 250.07 million. At the supplied CoinGecko price, the reported market capitalization is about 55.65 million dollars, while fully diluted valuation is about 175.40 million dollars. CoinGecko ranks the asset around 421 by market capitalization in this snapshot.
Circulating supply represents roughly 25% of the stated maximum supply. The reported market-cap-to-FDV ratio is 0.32, showing a substantial difference between the current circulating amount and the maximum supply. The data does not provide an unlock calendar, vesting schedule, allocation table, or dates for future emissions. It is therefore not possible to determine from this research when additional tokens may enter the market or how they may be distributed.
If network growth creates sufficient demand, future supply could be absorbed. If demand remains weak while more tokens become tradable, dilution could weigh on price. For ALLO, the difference between circulating supply and maximum supply is an important medium-term variable, although the available figures do not establish how that supply will enter the market.
ALLO remains well below its recorded all-time high of 1.60 dollars on November 11, 2025. The supplied data places the token approximately 86% below that peak. It is also well above the recorded all-time low of approximately 0.04769 dollars from February 5, 2026. This wide historical range highlights the token’s volatility and shows why previous highs and lows do not establish future price targets.
𝗧𝗵𝗲 𝗰𝘂𝗿𝗿𝗲𝗻𝘁 𝗺𝗮𝗿𝗸𝗲𝘁 𝘀𝘁𝗿𝘂𝗰𝘁𝘂𝗿𝗲 𝗿𝗲𝗺𝗮𝗶𝗻𝘀 𝘄𝗲𝗮𝗸
The Binance ticker records an open price of 0.23623 and a latest price of 0.22224, with a 24-hour high of 0.23761 and low of 0.22200. The weighted average price is 0.2295299, leaving the latest trade below the day’s average activity area. CoinGecko’s figures similarly show a high near 0.23725 and a low near 0.22241.
The hourly candles show a gradual decline through several lower zones. ALLO traded around 0.235 to 0.237 early in the measured period, then moved through 0.231, 0.228, 0.225, and 0.223 areas. There were several pauses and attempted rebounds, but the recoveries did not establish a higher high. The latest hourly data is around 0.22224, close to the session floor.
The four-hour structure shows an earlier spike to 0.25083 followed by a retreat. That expansion candle traded more than 33.86 million ALLO, and the following four-hour periods produced lower closes and lower trading ranges. The supplied candles are consistent with a failed continuation after a sharp expansion, although the research does not establish why the spike occurred.
The broader performance data reinforces the recent weakness. ALLO is down 10.46% over seven days, 12.20% over 14 days, 17.73% over 30 days, and 41.32% over 60 days. The 200-day change remains positive at 111.92%, meaning the longer-term recovery from earlier lows has not been erased even though the recent trend is negative.
𝗪𝗵𝘆 𝘁𝗵𝗲 𝘀𝗰𝗮𝗻𝗻𝗲𝗿 𝗶𝗱𝗲𝗻𝘁𝗶𝗳𝗶𝗲𝘀 𝗮 𝘀𝗵𝗼𝗿𝘁 𝘀𝗲𝘁𝘂𝗽
The scanner lists a current price of 0.22236 and a proposed entry zone from 0.22247118 to 0.22269354. That area is slightly above the latest market price, which fits a pullback-based framework: the system is looking for a revisit of a nearby overhead zone rather than relying on a continuation at the session low.
The scanner marks 0.22315239 as resistance and 0.21199780 as support. Its invalidation point, labelled stop loss, is 0.22406164. The projected downside levels are 0.21940822, 0.21787674, and 0.21634527. The displayed risk-reward figure is 2.23883542585787. The setup also carries a hot priority of 9.45525, a selection score of 174.61, and a TOP_LOSER rank of 13.
The internal reading appears to reflect momentum, proximity to resistance, and the sequence of lower highs. The 15-minute move is negative at -0.825%, while the scanner reports a volume ratio of 1.22297. In plain terms, recent activity is above its comparison baseline while price is still weakening. That combination can accompany continuation, but it can also reflect late participation after a significant decline.
A 96.85 confidence reading does not remove slippage, sudden reversals, liquidation risk, or the possibility that price does not revisit the proposed entry area. The listed levels are reference points for evaluating structure, not outcomes established in advance.
𝗕𝗶𝘁𝗰𝗼𝗶𝗻’𝘀 𝘀𝘁𝗮𝗯𝗶𝗹𝗶𝘁𝘆 𝗺𝗮𝗸𝗲𝘀 𝗔𝗟𝗟𝗢’𝘀 𝘄𝗲𝗮𝗸𝗻𝗲𝘀𝘀 𝗺𝗼𝗿𝗲 𝗻𝗼𝘁𝗶𝗰𝗲𝗮𝗯𝗹𝗲
Bitcoin’s supplied Binance snapshot shows BTC at 77,194.20 USDT, up 0.022% over the measured 24-hour period. Its range is 77,025.10 to 77,477.40, with more than 3.01 billion USDT in quote volume. This is a relatively stable Bitcoin backdrop rather than a major BTC sell-off.
That context makes ALLO’s decline more distinct. ALLO is down almost 6% while BTC is nearly flat. One possible interpretation is that the selling pressure is specific to ALLO or to the lower-cap AI and altcoin segment, rather than being caused by a broad Bitcoin decline. The research does not include enough data to confirm that interpretation across the wider altcoin market.
A sudden Bitcoin move could still affect ALLO. Stronger BTC momentum may influence risk appetite across digital assets, while a sharp BTC reversal could add pressure to weaker altcoins. The supplied research does not include total crypto market capitalization, Bitcoin dominance, funding rates, or a full altcoin index, so broader market conditions cannot be classified from this snapshot alone.
𝗡𝗲𝘄𝘀 𝗴𝗮𝗽𝘀 𝗮𝗻𝗱 𝗽𝗼𝘀𝘀𝗶𝗯𝗹𝗲 𝗰𝗵𝗮𝗻𝗴𝗲𝘀 𝗶𝗻 𝘁𝗵𝗲 𝗽𝗶𝗰𝘁𝘂𝗿𝗲
The supplied data lists no recent verified news items for Allora. There is no confirmed partnership, product release, exchange announcement, governance event, token unlock notice, or protocol upgrade included in the research. This does not establish that no news exists elsewhere; it means no verified catalyst is available in the material supporting this analysis.
Evidence of real Allora usage, new applications consuming its intelligence, stronger model participation, or measurable developer and user growth could affect the fundamental narrative. Clearer information about token utility, staking, governance, or emissions could also make the asset easier to evaluate. None of those developments is confirmed in the supplied data.
On the technical side, a reclaim of 0.22315 and especially 0.22406 would weaken the scanner’s immediate bearish structure. A move through those areas with rising volume could turn the current breakdown into a failed breakdown. Conversely, rejection below resistance followed by a move through 0.21941 would keep the continuation framework active, with 0.21788 and 0.21635 as additional scanner reference points.
The larger support marker at 0.21200 sits below the three projected targets. A decisive break there would indicate that the market is searching for a lower range. A defense of that level alongside improving volume and a higher low would provide evidence that selling pressure is easing.
𝗥𝗶𝘀𝗸𝘀 𝗮𝗻𝗱 𝘁𝗵𝗲 𝗺𝗮𝗶𝗻 𝗱𝗮𝘁𝗮 𝗴𝗮𝗽𝘀
The first risk is that ALLO has already fallen substantially over a relatively short period. The 60-day decline of more than 41% raises the possibility of a sharp countertrend bounce, even if the broader structure remains weak. A reversal can become more pronounced when selling meets limited liquidity or when an unexpected development changes sentiment.
The second risk is token supply. With approximately 250.07 million ALLO circulating against a 1 billion maximum, future distribution could create continuing pressure. Because the research does not show an unlock schedule or allocation structure, the timing and scale of that pressure cannot be modeled from the available figures. The gap between market capitalization and FDV is therefore a material uncertainty.
The third risk is execution. The scanner’s entry zone sits just above the current price, and the proposed invalidation level is only a small distance higher. Tokens with this market profile can move through nearby levels quickly when volume expands. The Binance ticker reports 167,674 trades in the measured period, but trade count alone does not reveal order-book depth or slippage.
There is also a fundamental verification gap. The AI use case is clearly described, but the available data does not quantify active users, protocol revenue, model quality, developer activity, or demand for ALLO itself. The project has a defined architecture, yet the token’s long-term value depends on adoption that cannot be confirmed from these figures alone.
Open interest is reported at 38,741,867 ALLO. Without a longer history or funding data, that figure cannot establish whether traders are positioned for further downside. The most relevant observations remain price behavior around 0.22315 to 0.22406, reactions at 0.21941, 0.21788, 0.21635, and 0.21200, changes in volume and open interest, Bitcoin’s direction, and any verified information about utility, emissions, or network usage.
𝗕𝗮𝗹𝗮𝗻𝗰𝗲𝗱 𝗰𝗼𝗻𝗰𝗹𝘂𝘀𝗶𝗼𝗻
ALLOUSDT is notable because the technical and fundamental stories are developing at different speeds. Technically, recent evidence is weak: price is down across most short and medium timeframes, the four-hour chart shows a retreat from 0.25083, and the scanner identifies a short setup near nearby resistance. Bitcoin’s stability makes ALLO’s relative weakness more visible.
Fundamentally, Allora belongs to the decentralized AI category. Its stated goal is to coordinate specialized models, data, and validation for adaptive intelligence across AI agents, decentralized finance systems, and cross-chain applications. That concept could become more important if measurable network use develops. However, the supplied research does not verify the scale of adoption, and the token data shows a substantial difference between circulating supply and maximum supply.
The clearest reading is that ALLO is a high-volatility AI token in a weak short-term structure, while its longer-term project case remains incomplete from the available evidence. The scanner levels offer a framework for judging whether sellers retain control, but price can reverse before reaching any listed level. Fundamental updates and supply disclosures will be important in determining whether Allora’s network narrative is matched by token demand. The next significant clues are likely to come from price behavior around 0.22315 to 0.22406 and the market’s response to the 0.21200 support zone.
203
·
--
See translation
Wait… $ALLO is getting serious! ⚡ DOWN!
Entry: 0.22235 - 0.22257
SL: 0.22394
TP1: 0.21929 | TP2: 0.21776 | TP3: 0.21623
Wait… $ALLO is getting serious! ⚡ DOWN!
Entry: 0.22235 - 0.22257
SL: 0.22394
TP1: 0.21929 | TP2: 0.21776 | TP3: 0.21623
Entry: 0.22235 - 0.22257
SL: 0.22394
TP1: 0.21929 | TP2: 0.21776 | TP3: 0.21623
450
·
--
See translation
$ENSO is moving… 🚨🔥 DOWN!
Entry: 0.90685 - 0.90776
SL: 0.91365
TP1: 0.8938 | TP2: 0.88727 | TP3: 0.88075
$ENSO is moving… 🚨🔥 DOWN!
Entry: 0.90685 - 0.90776
SL: 0.91365
TP1: 0.8938 | TP2: 0.88727 | TP3: 0.88075
Entry: 0.90685 - 0.90776
SL: 0.91365
TP1: 0.8938 | TP2: 0.88727 | TP3: 0.88075
399
·
--
See translation
Wait wait wait… 🚨 $Q DOWN!
Entry: 0.023904 - 0.023928
SL: 0.024071
TP1: 0.023623 | TP2: 0.023483 | TP3: 0.023342
Wait wait wait… 🚨 $Q DOWN!
Entry: 0.023904 - 0.023928
SL: 0.024071
TP1: 0.023623 | TP2: 0.023483 | TP3: 0.023342
Entry: 0.023904 - 0.023928
SL: 0.024071
TP1: 0.023623 | TP2: 0.023483 | TP3: 0.023342
559
·
--
See translation
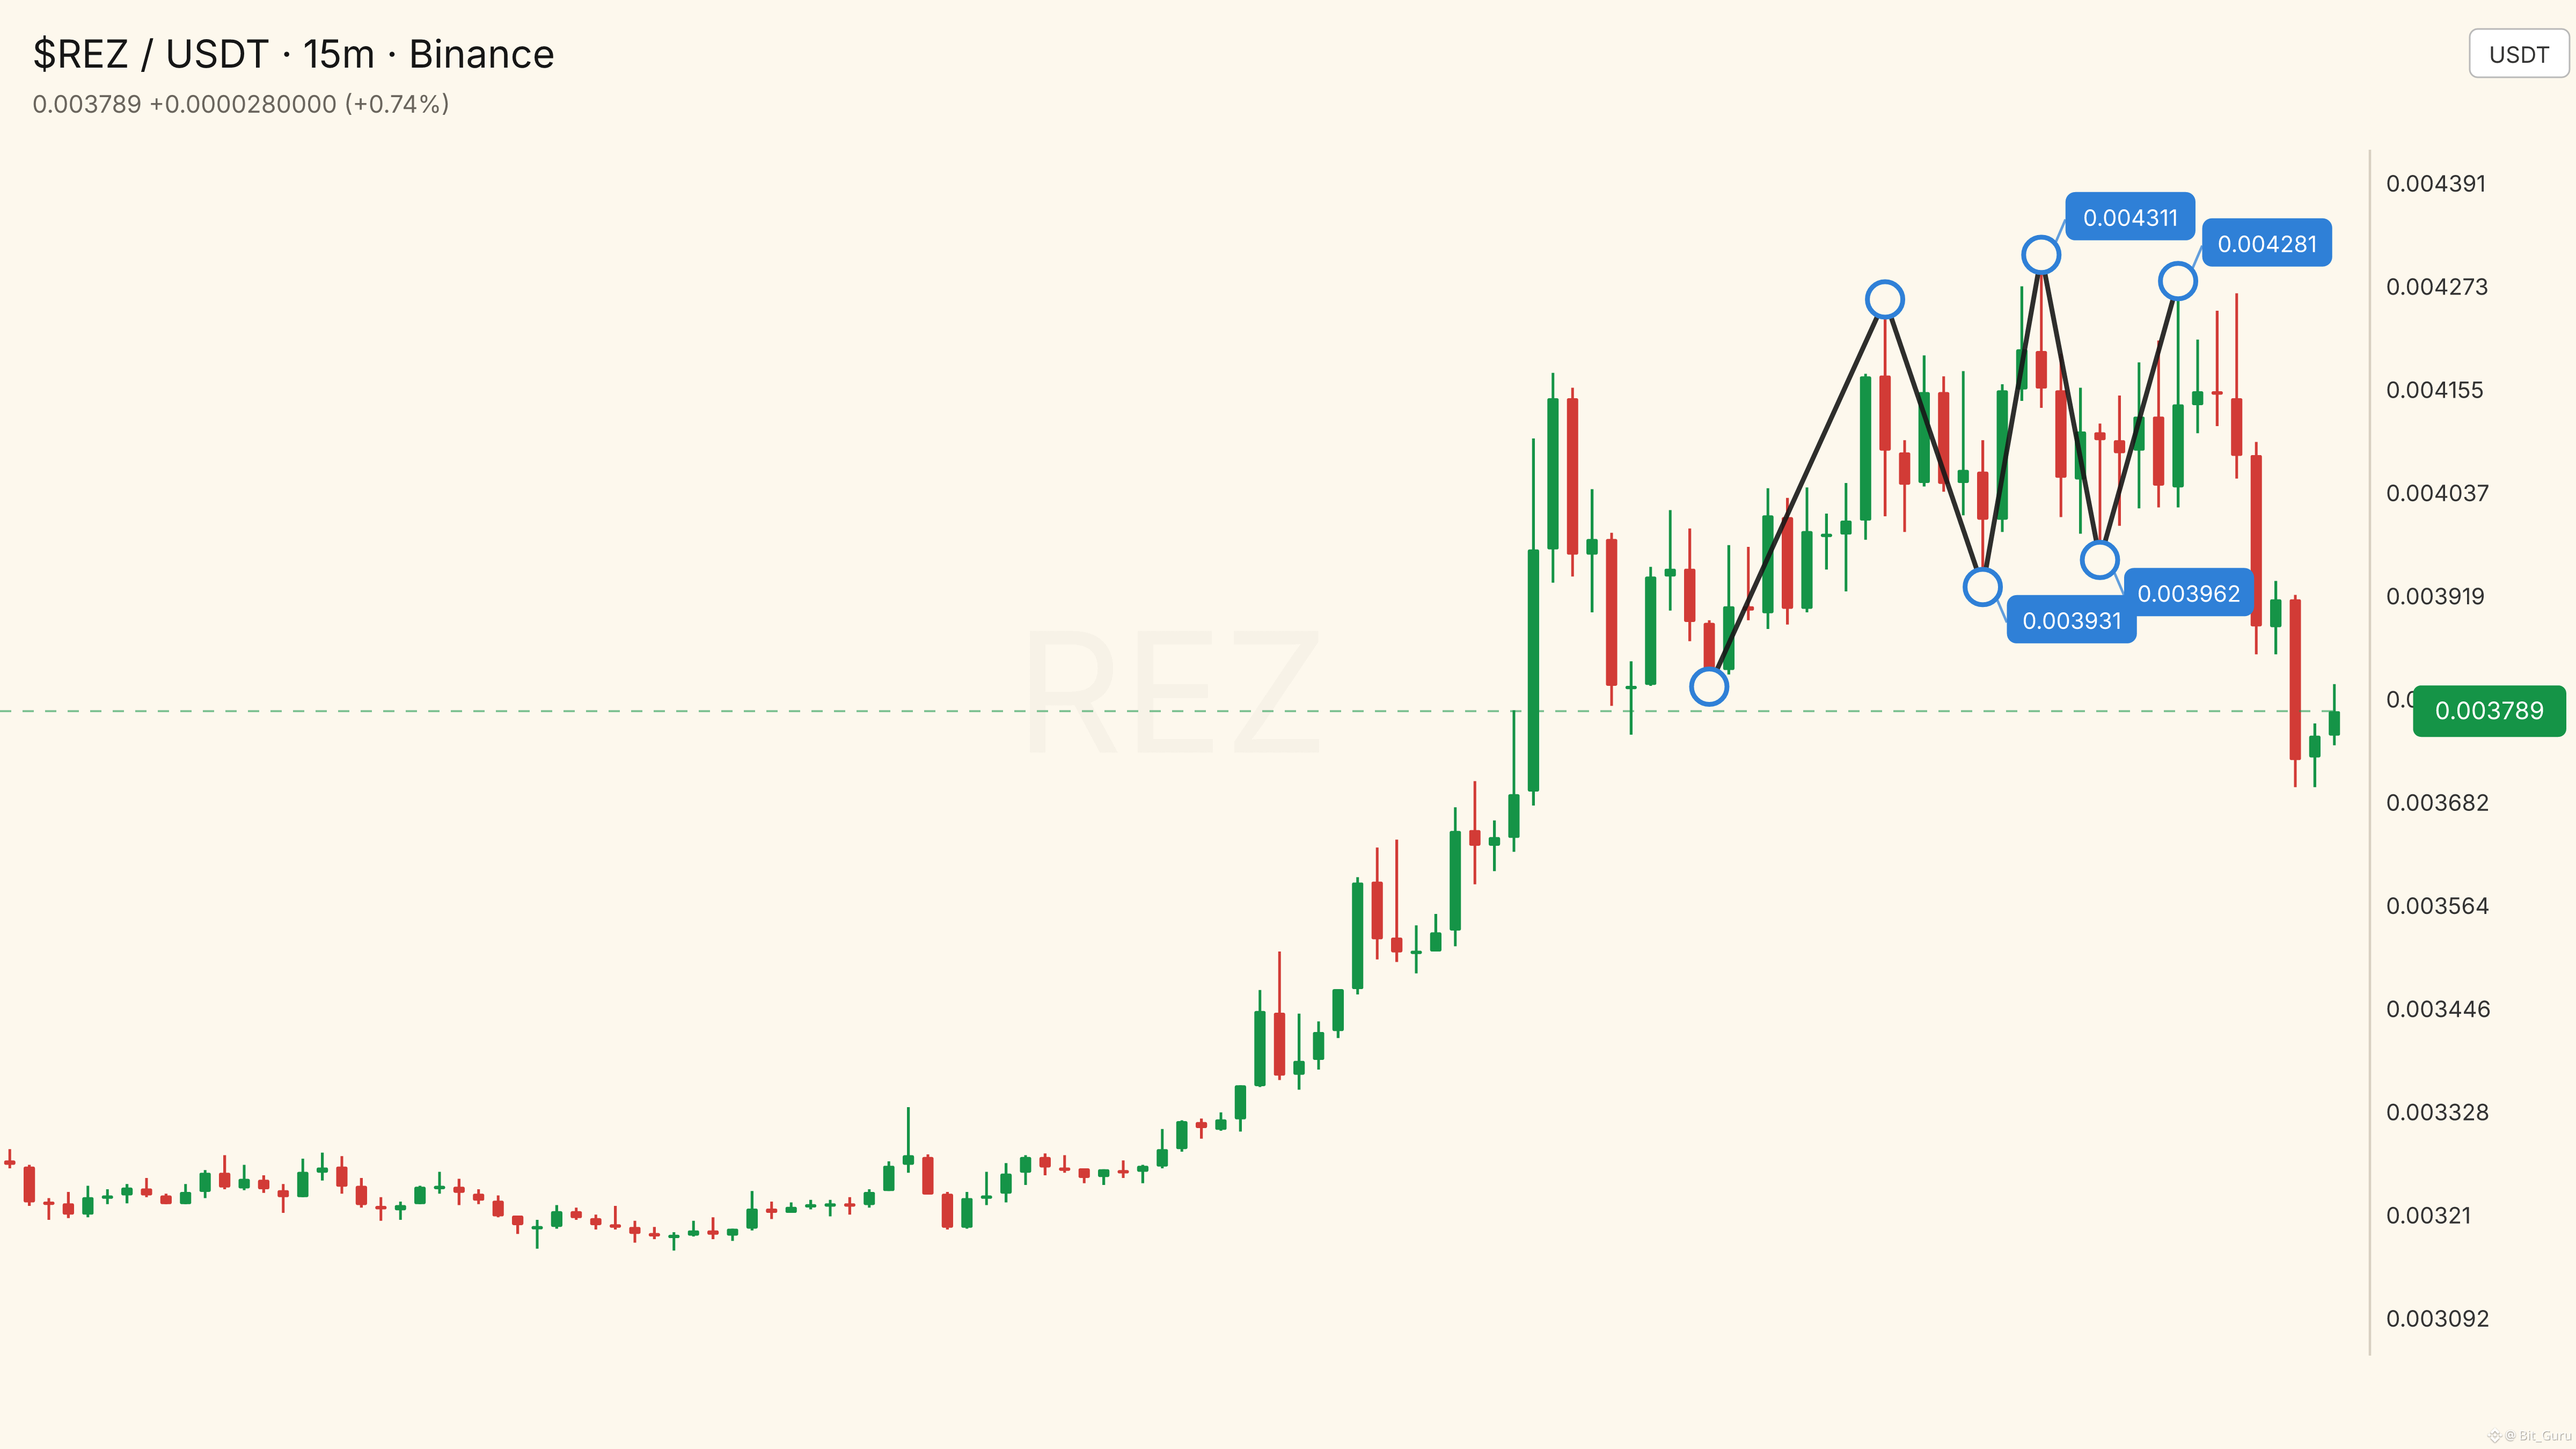
My community, look at $REZ … ✅ DOWN!
Entry: 0.00376688 - 0.00377065
SL: 0.00378632
TP1: 0.00372904 | TP2: 0.00371012 | TP3: 0.00369121
My community, look at $REZ … ✅ DOWN!
Entry: 0.00376688 - 0.00377065
SL: 0.00378632
TP1: 0.00372904 | TP2: 0.00371012 | TP3: 0.00369121
Entry: 0.00376688 - 0.00377065
SL: 0.00378632
TP1: 0.00372904 | TP2: 0.00371012 | TP3: 0.00369121
488
·
--
See translation
VELVETUSDT: Bearish Structure Meets a Key Support Zone𝗧𝗵𝗲 𝘀𝗰𝗮𝗻𝗻𝗲𝗿 𝗵𝗮𝘀 𝗽𝘂𝘁 𝗩𝗲𝗹𝘃𝗲𝘁 𝘂𝗻𝗱𝗲𝗿 𝘁𝗵𝗲 𝗺𝗶𝗰𝗿𝗼𝘀𝗰𝗼𝗽𝗲
VELVETUSDT has been selected from a sharp-loss group rather than a quiet, orderly trend. The supplied scanner marks the pair as a short-direction setup, gives it a confidence score of 100, and ranks it seventh in the TOP_LOSER category. That makes the pair notable for a specific reason: downside pressure is strong, but price is sitting close to a short-term support area where selling could either continue or temporarily lose control.
The scanner recorded a price of 0.0554 USDT. Its reference support was 0.0553, resistance was 0.0557, and its suggested entry range was 0.0554277 to 0.0554831. The scanner placed its invalidation level at 0.0558671 and identified downside reference points at 0.0546408, 0.0542474, and 0.0538540. Its calculated risk-reward figure was 2.0491.
Those figures describe a model output at one point in time. They do not establish what the next candle must do. The more useful question is whether the broader market structure supports the bearish reading and whether price can hold or break the nearby levels.
𝗪𝗵𝗮𝘁 𝗩𝗲𝗹𝘃𝗲𝘁 𝗖𝗮𝗽𝗶𝘁𝗮𝗹 𝗶𝘀 𝗯𝘂𝗶𝗹𝗱𝗶𝗻𝗴
The supplied project description identifies Velvet Capital as a social trading terminal for non-custodial crypto trading. Its stated scope includes spot trading, perpetual futures, and yield strategies across Robinhood Chain, Solana, Base, BNB Chain, Ethereum, Hyperliquid, Ink, Monad, Sonic, and other networks.
Velvet’s stated approach is to bring several functions into one interface. These include trading execution, wallet tracking, smart-money-flow observation, token research, and onchain analysis. Trades are described as routing through aggregated decentralised-exchange liquidity, with support for advanced order types such as limit orders and take-profit or stop-loss instructions. The project also describes MEV protection and execution from users’ own wallets.
The platform’s social layer includes a wallet tracker intended for following notable traders. Its project description also references an artificial-intelligence trading agent for token research and onchain analysis. That gives Velvet a broader identity than a basic swap interface: it is positioned as a combination of execution, discovery, and wallet-monitoring tools.
The research does not provide user counts, fee revenue, verified transaction totals, retention figures, or independent performance data for the trading agent. Product breadth is therefore documented, but adoption and commercial performance remain unquantified.
𝗧𝗼𝗸𝗲𝗻 𝗰𝗼𝗻𝘁𝗲𝘅𝘁 𝗮𝗻𝗱 𝘂𝗻𝗰𝗲𝗿𝘁𝗮𝗶𝗻𝘁𝗶𝗲𝘀
The research identifies the project as Velvet Capital and the token as VELVET. It does not verify a founding date, named founders, headquarters, fundraising history, or a detailed launch timeline. Those details should not be inferred from the available data.
The token is categorised across artificial intelligence, decentralised finance, AI applications, DeFAI, BNB Chain, Base, and a Binance Wallet IDO-related category. It is also listed in the YZi Labs, previously Binance Labs, portfolio category. However, the supplied research does not explain the exact nature, size, or date of any investment or relationship.
The precise utility schedule for VELVET is not fully documented either. The research does not verify a complete list of token-holder rights, governance powers, fee discounts, staking mechanics, buyback rules, or revenue-sharing terms. VELVET is clearly associated with the Velvet ecosystem, but the available material does not establish how platform activity translates into economic value for token holders.
The project’s multi-chain positioning is also presented at a high level. Velvet says it supports several networks and routes trades through aggregated DEX liquidity, but the research does not establish how deeply each chain is integrated or how much activity each contributes. That leaves a gap between the breadth of the product description and the measurable evidence of usage.
𝗦𝘂𝗽𝗽𝗹𝘆 𝗮𝗻𝗱 𝘃𝗮𝗹𝘂𝗮𝘁𝗶𝗼𝗻 𝗽𝗿𝗲𝘀𝘀𝘂𝗿𝗲
The tokenomics data lists a maximum and total supply of 1 billion VELVET. Circulating supply was approximately 463.82 million tokens, equal to about 46.38% of the maximum supply. More than half of the stated maximum supply was therefore outside circulation at the time of the snapshot.
The research does not provide a dated unlock calendar, allocation breakdown, vesting schedule, treasury policy, or details on when the remaining tokens may enter the market. That makes future dilution an unresolved issue rather than a precisely timed event.
The supplied CoinGecko snapshot placed VELVET at approximately 0.054386 USDT, with a market capitalisation of about 25.21 million US dollars. Its market-cap rank was 741. Fully diluted valuation was approximately 54.35 million US dollars. The FDV was therefore roughly 2.16 times the reported market capitalisation, while the market-cap-to-FDV ratio was 0.46.
That gap does not automatically determine the token’s direction. It does show that future supply entering circulation could become a source of selling pressure if demand and platform usage do not grow at a comparable pace.
Reported total value locked was approximately 641,723 US dollars. The market-cap-to-TVL ratio was 39.36, and the FDV-to-TVL ratio was 84.87. These figures need context because Velvet is described as a trading terminal rather than solely a lending or liquidity protocol, so TVL may not capture every form of platform activity. Even so, the reported token valuation is substantially larger than the locked-value base.
The research does not include Velvet-specific revenue, protocol fees, active users, or trading volume generated through the terminal. Valuation cannot therefore be assessed through verified cash-flow or usage multiples.
VELVET’s recorded all-time high was 2.08 US dollars on June 29, 2026. The supplied current price was approximately 97.39% below that level. Its reported all-time low was 0.04131603 US dollars on July 10, 2025, placing the token about 31.63% above that low. The long-term record shows a severe decline from the peak while retaining a meaningful distance from the historical floor.
𝗧𝗵𝗲 𝗺𝗮𝗿𝗸𝗲𝘁 𝘀𝘁𝗿𝘂𝗰𝘁𝘂𝗿𝗲 𝗿𝗲𝗺𝗮𝗶𝗻𝘀 𝘄𝗲𝗮𝗸
VELVET’s reported performance is negative across nearly every supplied timeframe. The token was down 9.97% over 24 hours, 38.40% over seven days, 46.61% over 14 days, and 92.18% over 30 days. It was also down 90.82% over 60 days, 41.03% over 200 days, and 67.52% over one year. The one-hour reading showed another decline of 1.86%.
The reported 24-hour range was 0.054291 to 0.061354 USDT, leaving the latest price near the bottom of that range. Binance ticker data showed an open price of 0.0604, a high of 0.0633, a low of 0.0542, and a last price of 0.0547. Quote volume was approximately 7.41 million USDT, with 128.70 million VELVET traded.
A separate market snapshot reported total volume of about 3.40 million US dollars. Because the supplied feeds use different measurements and windows, their volume figures are not identical. The cautious conclusion is that turnover was significant relative to the token’s approximately 25 million dollar market capitalisation, but the exact comparison depends on the data source.
The hourly candles show lower highs after price reached 0.0633. Price then moved through the 0.0600, 0.0580, and 0.0560 areas before testing 0.0542. A rebound from the 0.0543 region reached toward 0.0564, but the recovery did not create a durable higher high.
The four-hour data shows the same broad pressure, with price moving from a high near 0.0633 toward a low around 0.0542. Overall, the chart resembles a selloff interrupted by relief rallies rather than a confirmed base.
Open interest was reported at 84,432,770 VELVET. The research does not include funding rates, liquidation data, or historical open-interest changes. It is therefore not possible to determine whether the decline was driven mainly by new short positions, long liquidation, spot selling, or a combination of factors.
𝗪𝗵𝗲𝗿𝗲 𝘁𝗵𝗲 𝘀𝗰𝗮𝗻𝗻𝗲𝗿 𝘀𝗲𝘁𝘂𝗽 𝗰𝗮𝗻 𝗵𝗼𝗹𝗱 𝗼𝗿 𝗳𝗮𝗶𝗹
The scanner’s bearish case is consistent with the token’s broader performance. Its TOP_LOSER classification matches the sharp decline shown in the scanner feed and the larger losses visible across the weekly and monthly data. The scanner recorded a negative 15-minute move of 1.0714% and a volume ratio of 1.1222, indicating activity slightly above its comparison baseline. That is evidence of active trading, but not an extreme volume surge.
The proposed short setup sits above the 0.0553 support reference and below 0.0557 resistance. This is a narrow decision zone. If price remains below resistance and moves through nearby support, the scanner’s reference levels at 0.0546408, 0.0542474, and 0.0538540 become the areas to monitor. The 0.0558671 invalidation level is also important for the specific setup: a move above that area would weaken the immediate bearish structure.
Several factors could undermine the setup. Price has already suffered an extreme decline over longer periods, and sharp relief rallies can occur during such moves. The 0.0542 to 0.0543 region has recently attracted buying activity, so repeated defence of that area could send price back toward 0.0557 or higher. Smaller tokens can also move quickly through technical levels when liquidity is limited or fragmented, increasing the risk of false breaks and slippage.
The scanner’s confidence score reflects its model output at the recorded time. It does not remove the possibility of a reversal, a failed breakdown, or a rapid move through the reference levels.
𝗕𝗶𝘁𝗰𝗼𝗶𝗻’𝘀 𝘀𝘁𝗮𝗯𝗶𝗹𝗶𝘁𝘆 𝗱𝗼𝗲𝘀 𝗻𝗼𝘁 𝗿𝗲𝘀𝗰𝘂𝗲 𝗩𝗘𝗟𝗩𝗘𝗧
Bitcoin was comparatively stable in the supplied market snapshot. BTC was priced near 77,287.80 USDT, up 0.038% over the reported period, with a range of 77,025.10 to 77,477.40. Its quote volume was approximately 3.02 billion USDT.
That contrast matters. VELVET’s decline was not mirrored by a major Bitcoin selloff in the same data window. When BTC is nearly flat while a smaller token falls sharply, token-specific liquidity, positioning, supply, or confidence may be contributing to the weakness.
A stable Bitcoin market is not automatically supportive for every altcoin, however. If BTC leaves its range sharply, smaller tokens could become more volatile. The supplied research does not include total crypto-market capitalisation, Bitcoin dominance, Ethereum performance, or a broader altcoin index, so the wider market picture remains incomplete.
𝗟𝗲𝘃𝗲𝗹𝘀 𝗮𝗻𝗱 𝗳𝗮𝗰𝘁𝗼𝗿𝘀 𝘁𝗼 𝗺𝗼𝗻𝗶𝘁𝗼𝗿
The first technical checkpoint is 0.0553, the scanner’s support reference. The recent 0.0542 to 0.0543 low area is the next important zone. A sustained move below it would show that buyers have not established a reliable floor. The scanner’s three downside references are 0.0546408, 0.0542474, and 0.0538540, with the final level below the recent market low.
On the recovery side, 0.0557 is immediate resistance. The 0.0558 to 0.0564 area appeared repeatedly in recent hourly and four-hour candles, while 0.0558671 is the scanner’s specific invalidation area. A move above that level would weaken the short-term bearish pattern, although it would not by itself confirm a full trend reversal.
A larger recovery would need to address the 0.0575 to 0.0586 region, followed by the recent high near 0.0633. Beyond price, useful observations include volume behaviour at support, changes in open interest, funding rates, liquidations, supply disclosures, and evidence of actual Velvet platform usage.
The research feed contains no recent verified news items for Velvet. It provides no confirmed announcement covering a partnership, exchange listing, product release, token unlock, governance vote, funding event, security incident, or new chain integration. That absence means no catalyst was supplied or verified in this dataset; it does not prove that no external development exists.
𝗕𝗮𝗹𝗮𝗻𝗰𝗲𝗱 𝗰𝗼𝗻𝗰𝗹𝘂𝘀𝗶𝗼𝗻
Velvet presents a coherent product idea: combine non-custodial trading, cross-chain execution, wallet tracking, smart-money discovery, and AI-assisted research. The available research confirms the stated product scope, but it does not provide enough usage, revenue, fee, user, or performance data to measure adoption.
The token chart is currently communicating stress rather than steady strength. VELVET has suffered severe losses across the supplied timeframes, remains far below its recorded all-time high, and trades in a market with a substantial gap between circulating market capitalisation and fully diluted valuation. That gap leaves future dilution as an unresolved consideration.
The scanner’s bearish setup is supported by lower highs, heavy recent losses, and active trading near support. It is also vulnerable to a relief move because price is close to a recent low and the 0.0542 to 0.0543 area has attracted buyers. The key short-term question is how price resolves the 0.0553 to 0.0557 zone and whether volume and derivatives data confirm that move.
A break beneath nearby lows would keep the continuation structure in focus. A move above 0.0558671 would weaken the immediate bearish thesis. The broader assessment still depends on unanswered questions around token unlocks, platform usage, token utility, and whether Velvet’s product activity can support a token that has experienced such an extreme repricing.
VELVETUSDT: Bearish Structure Meets a Key Support Zone
𝗧𝗵𝗲 𝘀𝗰𝗮𝗻𝗻𝗲𝗿 𝗵𝗮𝘀 𝗽𝘂𝘁 𝗩𝗲𝗹𝘃𝗲𝘁 𝘂𝗻𝗱𝗲𝗿 𝘁𝗵𝗲 𝗺𝗶𝗰𝗿𝗼𝘀𝗰𝗼𝗽𝗲
VELVETUSDT has been selected from a sharp-loss group rather than a quiet, orderly trend. The supplied scanner marks the pair as a short-direction setup, gives it a confidence score of 100, and ranks it seventh in the TOP_LOSER category. That makes the pair notable for a specific reason: downside pressure is strong, but price is sitting close to a short-term support area where selling could either continue or temporarily lose control.
The scanner recorded a price of 0.0554 USDT. Its reference support was 0.0553, resistance was 0.0557, and its suggested entry range was 0.0554277 to 0.0554831. The scanner placed its invalidation level at 0.0558671 and identified downside reference points at 0.0546408, 0.0542474, and 0.0538540. Its calculated risk-reward figure was 2.0491.
Those figures describe a model output at one point in time. They do not establish what the next candle must do. The more useful question is whether the broader market structure supports the bearish reading and whether price can hold or break the nearby levels.
𝗪𝗵𝗮𝘁 𝗩𝗲𝗹𝘃𝗲𝘁 𝗖𝗮𝗽𝗶𝘁𝗮𝗹 𝗶𝘀 𝗯𝘂𝗶𝗹𝗱𝗶𝗻𝗴
The supplied project description identifies Velvet Capital as a social trading terminal for non-custodial crypto trading. Its stated scope includes spot trading, perpetual futures, and yield strategies across Robinhood Chain, Solana, Base, BNB Chain, Ethereum, Hyperliquid, Ink, Monad, Sonic, and other networks.
Velvet’s stated approach is to bring several functions into one interface. These include trading execution, wallet tracking, smart-money-flow observation, token research, and onchain analysis. Trades are described as routing through aggregated decentralised-exchange liquidity, with support for advanced order types such as limit orders and take-profit or stop-loss instructions. The project also describes MEV protection and execution from users’ own wallets.
The platform’s social layer includes a wallet tracker intended for following notable traders. Its project description also references an artificial-intelligence trading agent for token research and onchain analysis. That gives Velvet a broader identity than a basic swap interface: it is positioned as a combination of execution, discovery, and wallet-monitoring tools.
The research does not provide user counts, fee revenue, verified transaction totals, retention figures, or independent performance data for the trading agent. Product breadth is therefore documented, but adoption and commercial performance remain unquantified.
𝗧𝗼𝗸𝗲𝗻 𝗰𝗼𝗻𝘁𝗲𝘅𝘁 𝗮𝗻𝗱 𝘂𝗻𝗰𝗲𝗿𝘁𝗮𝗶𝗻𝘁𝗶𝗲𝘀
The research identifies the project as Velvet Capital and the token as VELVET. It does not verify a founding date, named founders, headquarters, fundraising history, or a detailed launch timeline. Those details should not be inferred from the available data.
The token is categorised across artificial intelligence, decentralised finance, AI applications, DeFAI, BNB Chain, Base, and a Binance Wallet IDO-related category. It is also listed in the YZi Labs, previously Binance Labs, portfolio category. However, the supplied research does not explain the exact nature, size, or date of any investment or relationship.
The precise utility schedule for VELVET is not fully documented either. The research does not verify a complete list of token-holder rights, governance powers, fee discounts, staking mechanics, buyback rules, or revenue-sharing terms. VELVET is clearly associated with the Velvet ecosystem, but the available material does not establish how platform activity translates into economic value for token holders.
The project’s multi-chain positioning is also presented at a high level. Velvet says it supports several networks and routes trades through aggregated DEX liquidity, but the research does not establish how deeply each chain is integrated or how much activity each contributes. That leaves a gap between the breadth of the product description and the measurable evidence of usage.
𝗦𝘂𝗽𝗽𝗹𝘆 𝗮𝗻𝗱 𝘃𝗮𝗹𝘂𝗮𝘁𝗶𝗼𝗻 𝗽𝗿𝗲𝘀𝘀𝘂𝗿𝗲
The tokenomics data lists a maximum and total supply of 1 billion VELVET. Circulating supply was approximately 463.82 million tokens, equal to about 46.38% of the maximum supply. More than half of the stated maximum supply was therefore outside circulation at the time of the snapshot.
The research does not provide a dated unlock calendar, allocation breakdown, vesting schedule, treasury policy, or details on when the remaining tokens may enter the market. That makes future dilution an unresolved issue rather than a precisely timed event.
The supplied CoinGecko snapshot placed VELVET at approximately 0.054386 USDT, with a market capitalisation of about 25.21 million US dollars. Its market-cap rank was 741. Fully diluted valuation was approximately 54.35 million US dollars. The FDV was therefore roughly 2.16 times the reported market capitalisation, while the market-cap-to-FDV ratio was 0.46.
That gap does not automatically determine the token’s direction. It does show that future supply entering circulation could become a source of selling pressure if demand and platform usage do not grow at a comparable pace.
Reported total value locked was approximately 641,723 US dollars. The market-cap-to-TVL ratio was 39.36, and the FDV-to-TVL ratio was 84.87. These figures need context because Velvet is described as a trading terminal rather than solely a lending or liquidity protocol, so TVL may not capture every form of platform activity. Even so, the reported token valuation is substantially larger than the locked-value base.
The research does not include Velvet-specific revenue, protocol fees, active users, or trading volume generated through the terminal. Valuation cannot therefore be assessed through verified cash-flow or usage multiples.
VELVET’s recorded all-time high was 2.08 US dollars on June 29, 2026. The supplied current price was approximately 97.39% below that level. Its reported all-time low was 0.04131603 US dollars on July 10, 2025, placing the token about 31.63% above that low. The long-term record shows a severe decline from the peak while retaining a meaningful distance from the historical floor.
𝗧𝗵𝗲 𝗺𝗮𝗿𝗸𝗲𝘁 𝘀𝘁𝗿𝘂𝗰𝘁𝘂𝗿𝗲 𝗿𝗲𝗺𝗮𝗶𝗻𝘀 𝘄𝗲𝗮𝗸
VELVET’s reported performance is negative across nearly every supplied timeframe. The token was down 9.97% over 24 hours, 38.40% over seven days, 46.61% over 14 days, and 92.18% over 30 days. It was also down 90.82% over 60 days, 41.03% over 200 days, and 67.52% over one year. The one-hour reading showed another decline of 1.86%.
The reported 24-hour range was 0.054291 to 0.061354 USDT, leaving the latest price near the bottom of that range. Binance ticker data showed an open price of 0.0604, a high of 0.0633, a low of 0.0542, and a last price of 0.0547. Quote volume was approximately 7.41 million USDT, with 128.70 million VELVET traded.
A separate market snapshot reported total volume of about 3.40 million US dollars. Because the supplied feeds use different measurements and windows, their volume figures are not identical. The cautious conclusion is that turnover was significant relative to the token’s approximately 25 million dollar market capitalisation, but the exact comparison depends on the data source.
The hourly candles show lower highs after price reached 0.0633. Price then moved through the 0.0600, 0.0580, and 0.0560 areas before testing 0.0542. A rebound from the 0.0543 region reached toward 0.0564, but the recovery did not create a durable higher high.
The four-hour data shows the same broad pressure, with price moving from a high near 0.0633 toward a low around 0.0542. Overall, the chart resembles a selloff interrupted by relief rallies rather than a confirmed base.
Open interest was reported at 84,432,770 VELVET. The research does not include funding rates, liquidation data, or historical open-interest changes. It is therefore not possible to determine whether the decline was driven mainly by new short positions, long liquidation, spot selling, or a combination of factors.
𝗪𝗵𝗲𝗿𝗲 𝘁𝗵𝗲 𝘀𝗰𝗮𝗻𝗻𝗲𝗿 𝘀𝗲𝘁𝘂𝗽 𝗰𝗮𝗻 𝗵𝗼𝗹𝗱 𝗼𝗿 𝗳𝗮𝗶𝗹
The scanner’s bearish case is consistent with the token’s broader performance. Its TOP_LOSER classification matches the sharp decline shown in the scanner feed and the larger losses visible across the weekly and monthly data. The scanner recorded a negative 15-minute move of 1.0714% and a volume ratio of 1.1222, indicating activity slightly above its comparison baseline. That is evidence of active trading, but not an extreme volume surge.
The proposed short setup sits above the 0.0553 support reference and below 0.0557 resistance. This is a narrow decision zone. If price remains below resistance and moves through nearby support, the scanner’s reference levels at 0.0546408, 0.0542474, and 0.0538540 become the areas to monitor. The 0.0558671 invalidation level is also important for the specific setup: a move above that area would weaken the immediate bearish structure.
Several factors could undermine the setup. Price has already suffered an extreme decline over longer periods, and sharp relief rallies can occur during such moves. The 0.0542 to 0.0543 region has recently attracted buying activity, so repeated defence of that area could send price back toward 0.0557 or higher. Smaller tokens can also move quickly through technical levels when liquidity is limited or fragmented, increasing the risk of false breaks and slippage.
The scanner’s confidence score reflects its model output at the recorded time. It does not remove the possibility of a reversal, a failed breakdown, or a rapid move through the reference levels.
𝗕𝗶𝘁𝗰𝗼𝗶𝗻’𝘀 𝘀𝘁𝗮𝗯𝗶𝗹𝗶𝘁𝘆 𝗱𝗼𝗲𝘀 𝗻𝗼𝘁 𝗿𝗲𝘀𝗰𝘂𝗲 𝗩𝗘𝗟𝗩𝗘𝗧
Bitcoin was comparatively stable in the supplied market snapshot. BTC was priced near 77,287.80 USDT, up 0.038% over the reported period, with a range of 77,025.10 to 77,477.40. Its quote volume was approximately 3.02 billion USDT.
That contrast matters. VELVET’s decline was not mirrored by a major Bitcoin selloff in the same data window. When BTC is nearly flat while a smaller token falls sharply, token-specific liquidity, positioning, supply, or confidence may be contributing to the weakness.
A stable Bitcoin market is not automatically supportive for every altcoin, however. If BTC leaves its range sharply, smaller tokens could become more volatile. The supplied research does not include total crypto-market capitalisation, Bitcoin dominance, Ethereum performance, or a broader altcoin index, so the wider market picture remains incomplete.
𝗟𝗲𝘃𝗲𝗹𝘀 𝗮𝗻𝗱 𝗳𝗮𝗰𝘁𝗼𝗿𝘀 𝘁𝗼 𝗺𝗼𝗻𝗶𝘁𝗼𝗿
The first technical checkpoint is 0.0553, the scanner’s support reference. The recent 0.0542 to 0.0543 low area is the next important zone. A sustained move below it would show that buyers have not established a reliable floor. The scanner’s three downside references are 0.0546408, 0.0542474, and 0.0538540, with the final level below the recent market low.
On the recovery side, 0.0557 is immediate resistance. The 0.0558 to 0.0564 area appeared repeatedly in recent hourly and four-hour candles, while 0.0558671 is the scanner’s specific invalidation area. A move above that level would weaken the short-term bearish pattern, although it would not by itself confirm a full trend reversal.
A larger recovery would need to address the 0.0575 to 0.0586 region, followed by the recent high near 0.0633. Beyond price, useful observations include volume behaviour at support, changes in open interest, funding rates, liquidations, supply disclosures, and evidence of actual Velvet platform usage.
The research feed contains no recent verified news items for Velvet. It provides no confirmed announcement covering a partnership, exchange listing, product release, token unlock, governance vote, funding event, security incident, or new chain integration. That absence means no catalyst was supplied or verified in this dataset; it does not prove that no external development exists.
𝗕𝗮𝗹𝗮𝗻𝗰𝗲𝗱 𝗰𝗼𝗻𝗰𝗹𝘂𝘀𝗶𝗼𝗻
Velvet presents a coherent product idea: combine non-custodial trading, cross-chain execution, wallet tracking, smart-money discovery, and AI-assisted research. The available research confirms the stated product scope, but it does not provide enough usage, revenue, fee, user, or performance data to measure adoption.
The token chart is currently communicating stress rather than steady strength. VELVET has suffered severe losses across the supplied timeframes, remains far below its recorded all-time high, and trades in a market with a substantial gap between circulating market capitalisation and fully diluted valuation. That gap leaves future dilution as an unresolved consideration.
The scanner’s bearish setup is supported by lower highs, heavy recent losses, and active trading near support. It is also vulnerable to a relief move because price is close to a recent low and the 0.0542 to 0.0543 area has attracted buyers. The key short-term question is how price resolves the 0.0553 to 0.0557 zone and whether volume and derivatives data confirm that move.
A break beneath nearby lows would keep the continuation structure in focus. A move above 0.0558671 would weaken the immediate bearish thesis. The broader assessment still depends on unanswered questions around token unlocks, platform usage, token utility, and whether Velvet’s product activity can support a token that has experienced such an extreme repricing.
VELVETUSDT has been selected from a sharp-loss group rather than a quiet, orderly trend. The supplied scanner marks the pair as a short-direction setup, gives it a confidence score of 100, and ranks it seventh in the TOP_LOSER category. That makes the pair notable for a specific reason: downside pressure is strong, but price is sitting close to a short-term support area where selling could either continue or temporarily lose control.
The scanner recorded a price of 0.0554 USDT. Its reference support was 0.0553, resistance was 0.0557, and its suggested entry range was 0.0554277 to 0.0554831. The scanner placed its invalidation level at 0.0558671 and identified downside reference points at 0.0546408, 0.0542474, and 0.0538540. Its calculated risk-reward figure was 2.0491.
Those figures describe a model output at one point in time. They do not establish what the next candle must do. The more useful question is whether the broader market structure supports the bearish reading and whether price can hold or break the nearby levels.
𝗪𝗵𝗮𝘁 𝗩𝗲𝗹𝘃𝗲𝘁 𝗖𝗮𝗽𝗶𝘁𝗮𝗹 𝗶𝘀 𝗯𝘂𝗶𝗹𝗱𝗶𝗻𝗴
The supplied project description identifies Velvet Capital as a social trading terminal for non-custodial crypto trading. Its stated scope includes spot trading, perpetual futures, and yield strategies across Robinhood Chain, Solana, Base, BNB Chain, Ethereum, Hyperliquid, Ink, Monad, Sonic, and other networks.
Velvet’s stated approach is to bring several functions into one interface. These include trading execution, wallet tracking, smart-money-flow observation, token research, and onchain analysis. Trades are described as routing through aggregated decentralised-exchange liquidity, with support for advanced order types such as limit orders and take-profit or stop-loss instructions. The project also describes MEV protection and execution from users’ own wallets.
The platform’s social layer includes a wallet tracker intended for following notable traders. Its project description also references an artificial-intelligence trading agent for token research and onchain analysis. That gives Velvet a broader identity than a basic swap interface: it is positioned as a combination of execution, discovery, and wallet-monitoring tools.
The research does not provide user counts, fee revenue, verified transaction totals, retention figures, or independent performance data for the trading agent. Product breadth is therefore documented, but adoption and commercial performance remain unquantified.
𝗧𝗼𝗸𝗲𝗻 𝗰𝗼𝗻𝘁𝗲𝘅𝘁 𝗮𝗻𝗱 𝘂𝗻𝗰𝗲𝗿𝘁𝗮𝗶𝗻𝘁𝗶𝗲𝘀
The research identifies the project as Velvet Capital and the token as VELVET. It does not verify a founding date, named founders, headquarters, fundraising history, or a detailed launch timeline. Those details should not be inferred from the available data.
The token is categorised across artificial intelligence, decentralised finance, AI applications, DeFAI, BNB Chain, Base, and a Binance Wallet IDO-related category. It is also listed in the YZi Labs, previously Binance Labs, portfolio category. However, the supplied research does not explain the exact nature, size, or date of any investment or relationship.
The precise utility schedule for VELVET is not fully documented either. The research does not verify a complete list of token-holder rights, governance powers, fee discounts, staking mechanics, buyback rules, or revenue-sharing terms. VELVET is clearly associated with the Velvet ecosystem, but the available material does not establish how platform activity translates into economic value for token holders.
The project’s multi-chain positioning is also presented at a high level. Velvet says it supports several networks and routes trades through aggregated DEX liquidity, but the research does not establish how deeply each chain is integrated or how much activity each contributes. That leaves a gap between the breadth of the product description and the measurable evidence of usage.
𝗦𝘂𝗽𝗽𝗹𝘆 𝗮𝗻𝗱 𝘃𝗮𝗹𝘂𝗮𝘁𝗶𝗼𝗻 𝗽𝗿𝗲𝘀𝘀𝘂𝗿𝗲
The tokenomics data lists a maximum and total supply of 1 billion VELVET. Circulating supply was approximately 463.82 million tokens, equal to about 46.38% of the maximum supply. More than half of the stated maximum supply was therefore outside circulation at the time of the snapshot.
The research does not provide a dated unlock calendar, allocation breakdown, vesting schedule, treasury policy, or details on when the remaining tokens may enter the market. That makes future dilution an unresolved issue rather than a precisely timed event.
The supplied CoinGecko snapshot placed VELVET at approximately 0.054386 USDT, with a market capitalisation of about 25.21 million US dollars. Its market-cap rank was 741. Fully diluted valuation was approximately 54.35 million US dollars. The FDV was therefore roughly 2.16 times the reported market capitalisation, while the market-cap-to-FDV ratio was 0.46.
That gap does not automatically determine the token’s direction. It does show that future supply entering circulation could become a source of selling pressure if demand and platform usage do not grow at a comparable pace.
Reported total value locked was approximately 641,723 US dollars. The market-cap-to-TVL ratio was 39.36, and the FDV-to-TVL ratio was 84.87. These figures need context because Velvet is described as a trading terminal rather than solely a lending or liquidity protocol, so TVL may not capture every form of platform activity. Even so, the reported token valuation is substantially larger than the locked-value base.
The research does not include Velvet-specific revenue, protocol fees, active users, or trading volume generated through the terminal. Valuation cannot therefore be assessed through verified cash-flow or usage multiples.
VELVET’s recorded all-time high was 2.08 US dollars on June 29, 2026. The supplied current price was approximately 97.39% below that level. Its reported all-time low was 0.04131603 US dollars on July 10, 2025, placing the token about 31.63% above that low. The long-term record shows a severe decline from the peak while retaining a meaningful distance from the historical floor.
𝗧𝗵𝗲 𝗺𝗮𝗿𝗸𝗲𝘁 𝘀𝘁𝗿𝘂𝗰𝘁𝘂𝗿𝗲 𝗿𝗲𝗺𝗮𝗶𝗻𝘀 𝘄𝗲𝗮𝗸
VELVET’s reported performance is negative across nearly every supplied timeframe. The token was down 9.97% over 24 hours, 38.40% over seven days, 46.61% over 14 days, and 92.18% over 30 days. It was also down 90.82% over 60 days, 41.03% over 200 days, and 67.52% over one year. The one-hour reading showed another decline of 1.86%.
The reported 24-hour range was 0.054291 to 0.061354 USDT, leaving the latest price near the bottom of that range. Binance ticker data showed an open price of 0.0604, a high of 0.0633, a low of 0.0542, and a last price of 0.0547. Quote volume was approximately 7.41 million USDT, with 128.70 million VELVET traded.
A separate market snapshot reported total volume of about 3.40 million US dollars. Because the supplied feeds use different measurements and windows, their volume figures are not identical. The cautious conclusion is that turnover was significant relative to the token’s approximately 25 million dollar market capitalisation, but the exact comparison depends on the data source.
The hourly candles show lower highs after price reached 0.0633. Price then moved through the 0.0600, 0.0580, and 0.0560 areas before testing 0.0542. A rebound from the 0.0543 region reached toward 0.0564, but the recovery did not create a durable higher high.
The four-hour data shows the same broad pressure, with price moving from a high near 0.0633 toward a low around 0.0542. Overall, the chart resembles a selloff interrupted by relief rallies rather than a confirmed base.
Open interest was reported at 84,432,770 VELVET. The research does not include funding rates, liquidation data, or historical open-interest changes. It is therefore not possible to determine whether the decline was driven mainly by new short positions, long liquidation, spot selling, or a combination of factors.
𝗪𝗵𝗲𝗿𝗲 𝘁𝗵𝗲 𝘀𝗰𝗮𝗻𝗻𝗲𝗿 𝘀𝗲𝘁𝘂𝗽 𝗰𝗮𝗻 𝗵𝗼𝗹𝗱 𝗼𝗿 𝗳𝗮𝗶𝗹
The scanner’s bearish case is consistent with the token’s broader performance. Its TOP_LOSER classification matches the sharp decline shown in the scanner feed and the larger losses visible across the weekly and monthly data. The scanner recorded a negative 15-minute move of 1.0714% and a volume ratio of 1.1222, indicating activity slightly above its comparison baseline. That is evidence of active trading, but not an extreme volume surge.
The proposed short setup sits above the 0.0553 support reference and below 0.0557 resistance. This is a narrow decision zone. If price remains below resistance and moves through nearby support, the scanner’s reference levels at 0.0546408, 0.0542474, and 0.0538540 become the areas to monitor. The 0.0558671 invalidation level is also important for the specific setup: a move above that area would weaken the immediate bearish structure.
Several factors could undermine the setup. Price has already suffered an extreme decline over longer periods, and sharp relief rallies can occur during such moves. The 0.0542 to 0.0543 region has recently attracted buying activity, so repeated defence of that area could send price back toward 0.0557 or higher. Smaller tokens can also move quickly through technical levels when liquidity is limited or fragmented, increasing the risk of false breaks and slippage.
The scanner’s confidence score reflects its model output at the recorded time. It does not remove the possibility of a reversal, a failed breakdown, or a rapid move through the reference levels.
𝗕𝗶𝘁𝗰𝗼𝗶𝗻’𝘀 𝘀𝘁𝗮𝗯𝗶𝗹𝗶𝘁𝘆 𝗱𝗼𝗲𝘀 𝗻𝗼𝘁 𝗿𝗲𝘀𝗰𝘂𝗲 𝗩𝗘𝗟𝗩𝗘𝗧
Bitcoin was comparatively stable in the supplied market snapshot. BTC was priced near 77,287.80 USDT, up 0.038% over the reported period, with a range of 77,025.10 to 77,477.40. Its quote volume was approximately 3.02 billion USDT.
That contrast matters. VELVET’s decline was not mirrored by a major Bitcoin selloff in the same data window. When BTC is nearly flat while a smaller token falls sharply, token-specific liquidity, positioning, supply, or confidence may be contributing to the weakness.
A stable Bitcoin market is not automatically supportive for every altcoin, however. If BTC leaves its range sharply, smaller tokens could become more volatile. The supplied research does not include total crypto-market capitalisation, Bitcoin dominance, Ethereum performance, or a broader altcoin index, so the wider market picture remains incomplete.
𝗟𝗲𝘃𝗲𝗹𝘀 𝗮𝗻𝗱 𝗳𝗮𝗰𝘁𝗼𝗿𝘀 𝘁𝗼 𝗺𝗼𝗻𝗶𝘁𝗼𝗿
The first technical checkpoint is 0.0553, the scanner’s support reference. The recent 0.0542 to 0.0543 low area is the next important zone. A sustained move below it would show that buyers have not established a reliable floor. The scanner’s three downside references are 0.0546408, 0.0542474, and 0.0538540, with the final level below the recent market low.
On the recovery side, 0.0557 is immediate resistance. The 0.0558 to 0.0564 area appeared repeatedly in recent hourly and four-hour candles, while 0.0558671 is the scanner’s specific invalidation area. A move above that level would weaken the short-term bearish pattern, although it would not by itself confirm a full trend reversal.
A larger recovery would need to address the 0.0575 to 0.0586 region, followed by the recent high near 0.0633. Beyond price, useful observations include volume behaviour at support, changes in open interest, funding rates, liquidations, supply disclosures, and evidence of actual Velvet platform usage.
The research feed contains no recent verified news items for Velvet. It provides no confirmed announcement covering a partnership, exchange listing, product release, token unlock, governance vote, funding event, security incident, or new chain integration. That absence means no catalyst was supplied or verified in this dataset; it does not prove that no external development exists.
𝗕𝗮𝗹𝗮𝗻𝗰𝗲𝗱 𝗰𝗼𝗻𝗰𝗹𝘂𝘀𝗶𝗼𝗻
Velvet presents a coherent product idea: combine non-custodial trading, cross-chain execution, wallet tracking, smart-money discovery, and AI-assisted research. The available research confirms the stated product scope, but it does not provide enough usage, revenue, fee, user, or performance data to measure adoption.
The token chart is currently communicating stress rather than steady strength. VELVET has suffered severe losses across the supplied timeframes, remains far below its recorded all-time high, and trades in a market with a substantial gap between circulating market capitalisation and fully diluted valuation. That gap leaves future dilution as an unresolved consideration.
The scanner’s bearish setup is supported by lower highs, heavy recent losses, and active trading near support. It is also vulnerable to a relief move because price is close to a recent low and the 0.0542 to 0.0543 area has attracted buyers. The key short-term question is how price resolves the 0.0553 to 0.0557 zone and whether volume and derivatives data confirm that move.
A break beneath nearby lows would keep the continuation structure in focus. A move above 0.0558671 would weaken the immediate bearish thesis. The broader assessment still depends on unanswered questions around token unlocks, platform usage, token utility, and whether Velvet’s product activity can support a token that has experienced such an extreme repricing.
362
·
--
See translation
Don’t miss $BULLA … ‼️ UP move!
Entry: 0.084435 - 0.08452
SL: 0.083886
TP1: 0.085737 | TP2: 0.086346 | TP3: 0.086955
Don’t miss $BULLA … ‼️ UP move!
Entry: 0.084435 - 0.08452
SL: 0.083886
TP1: 0.085737 | TP2: 0.086346 | TP3: 0.086955
Entry: 0.084435 - 0.08452
SL: 0.083886
TP1: 0.085737 | TP2: 0.086346 | TP3: 0.086955
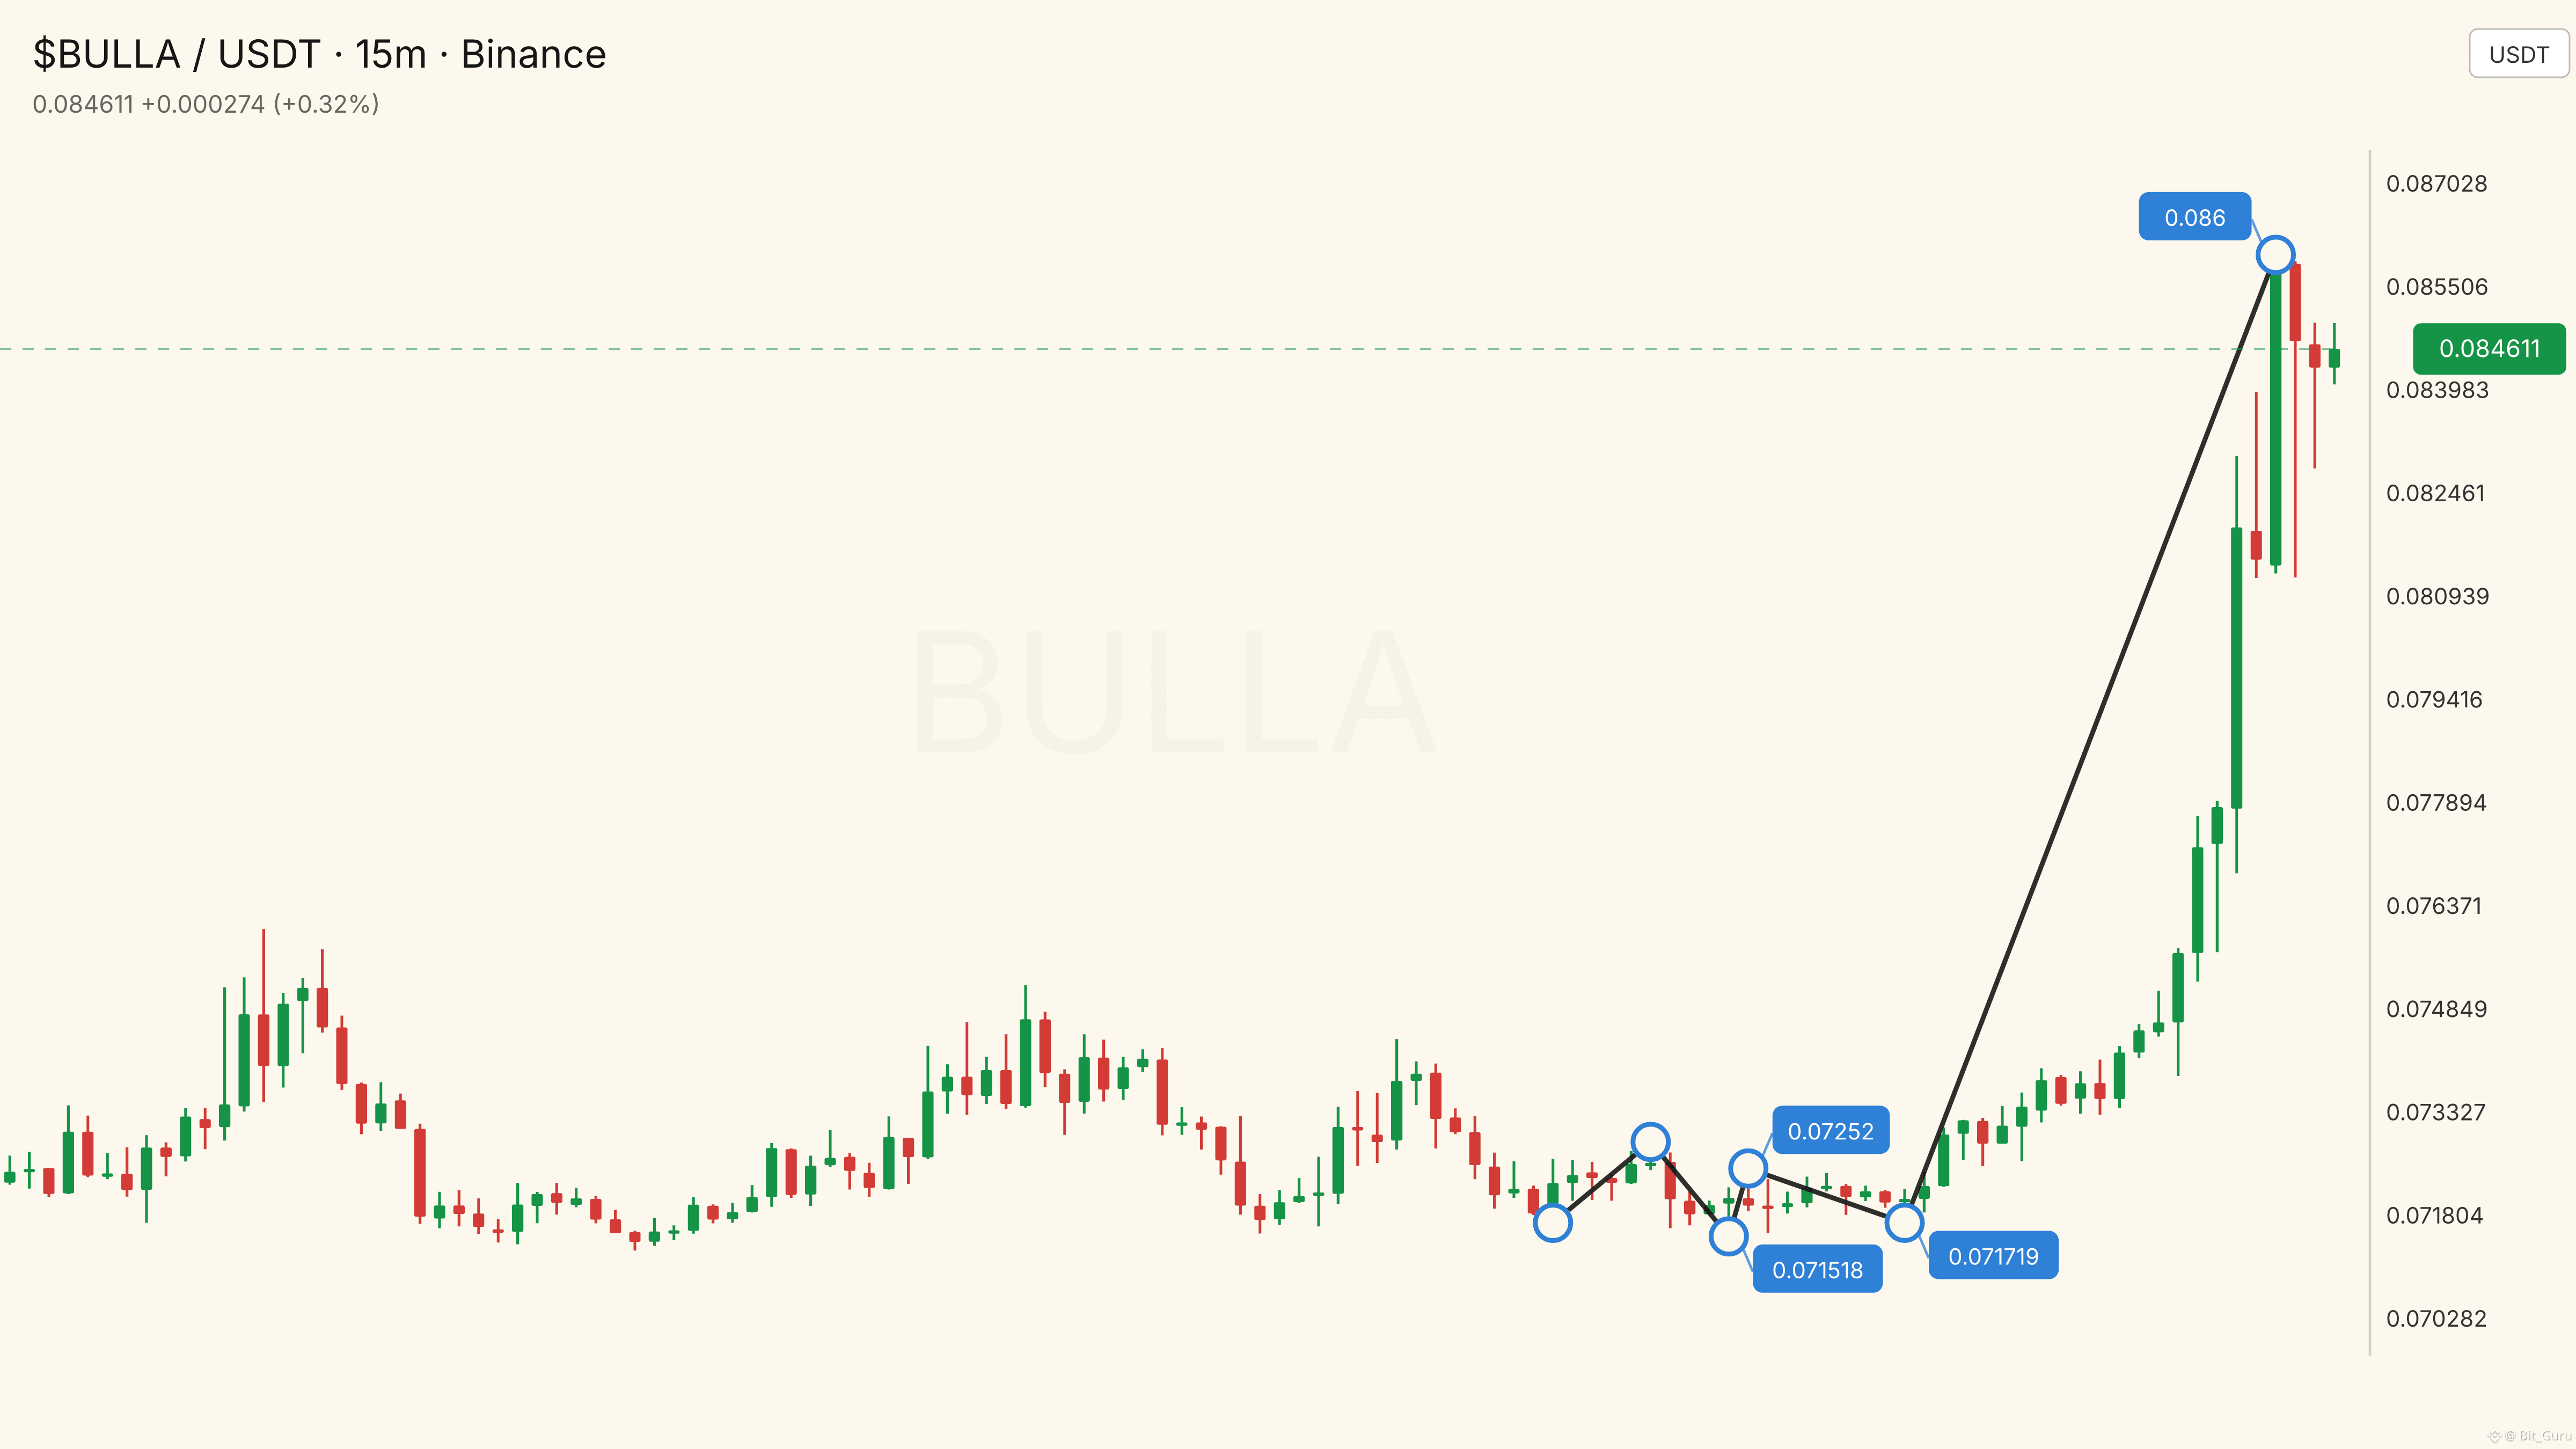
606
·
--
See translation
$AKE is in focus… ✅🚨 UP!
Entry: 0.016168 - 0.016184
SL: 0.016082
TP1: 0.016383 | TP2: 0.016482 | TP3: 0.016581
$AKE is in focus… ✅🚨 UP!
Entry: 0.016168 - 0.016184
SL: 0.016082
TP1: 0.016383 | TP2: 0.016482 | TP3: 0.016581
Entry: 0.016168 - 0.016184
SL: 0.016082
TP1: 0.016383 | TP2: 0.016482 | TP3: 0.016581
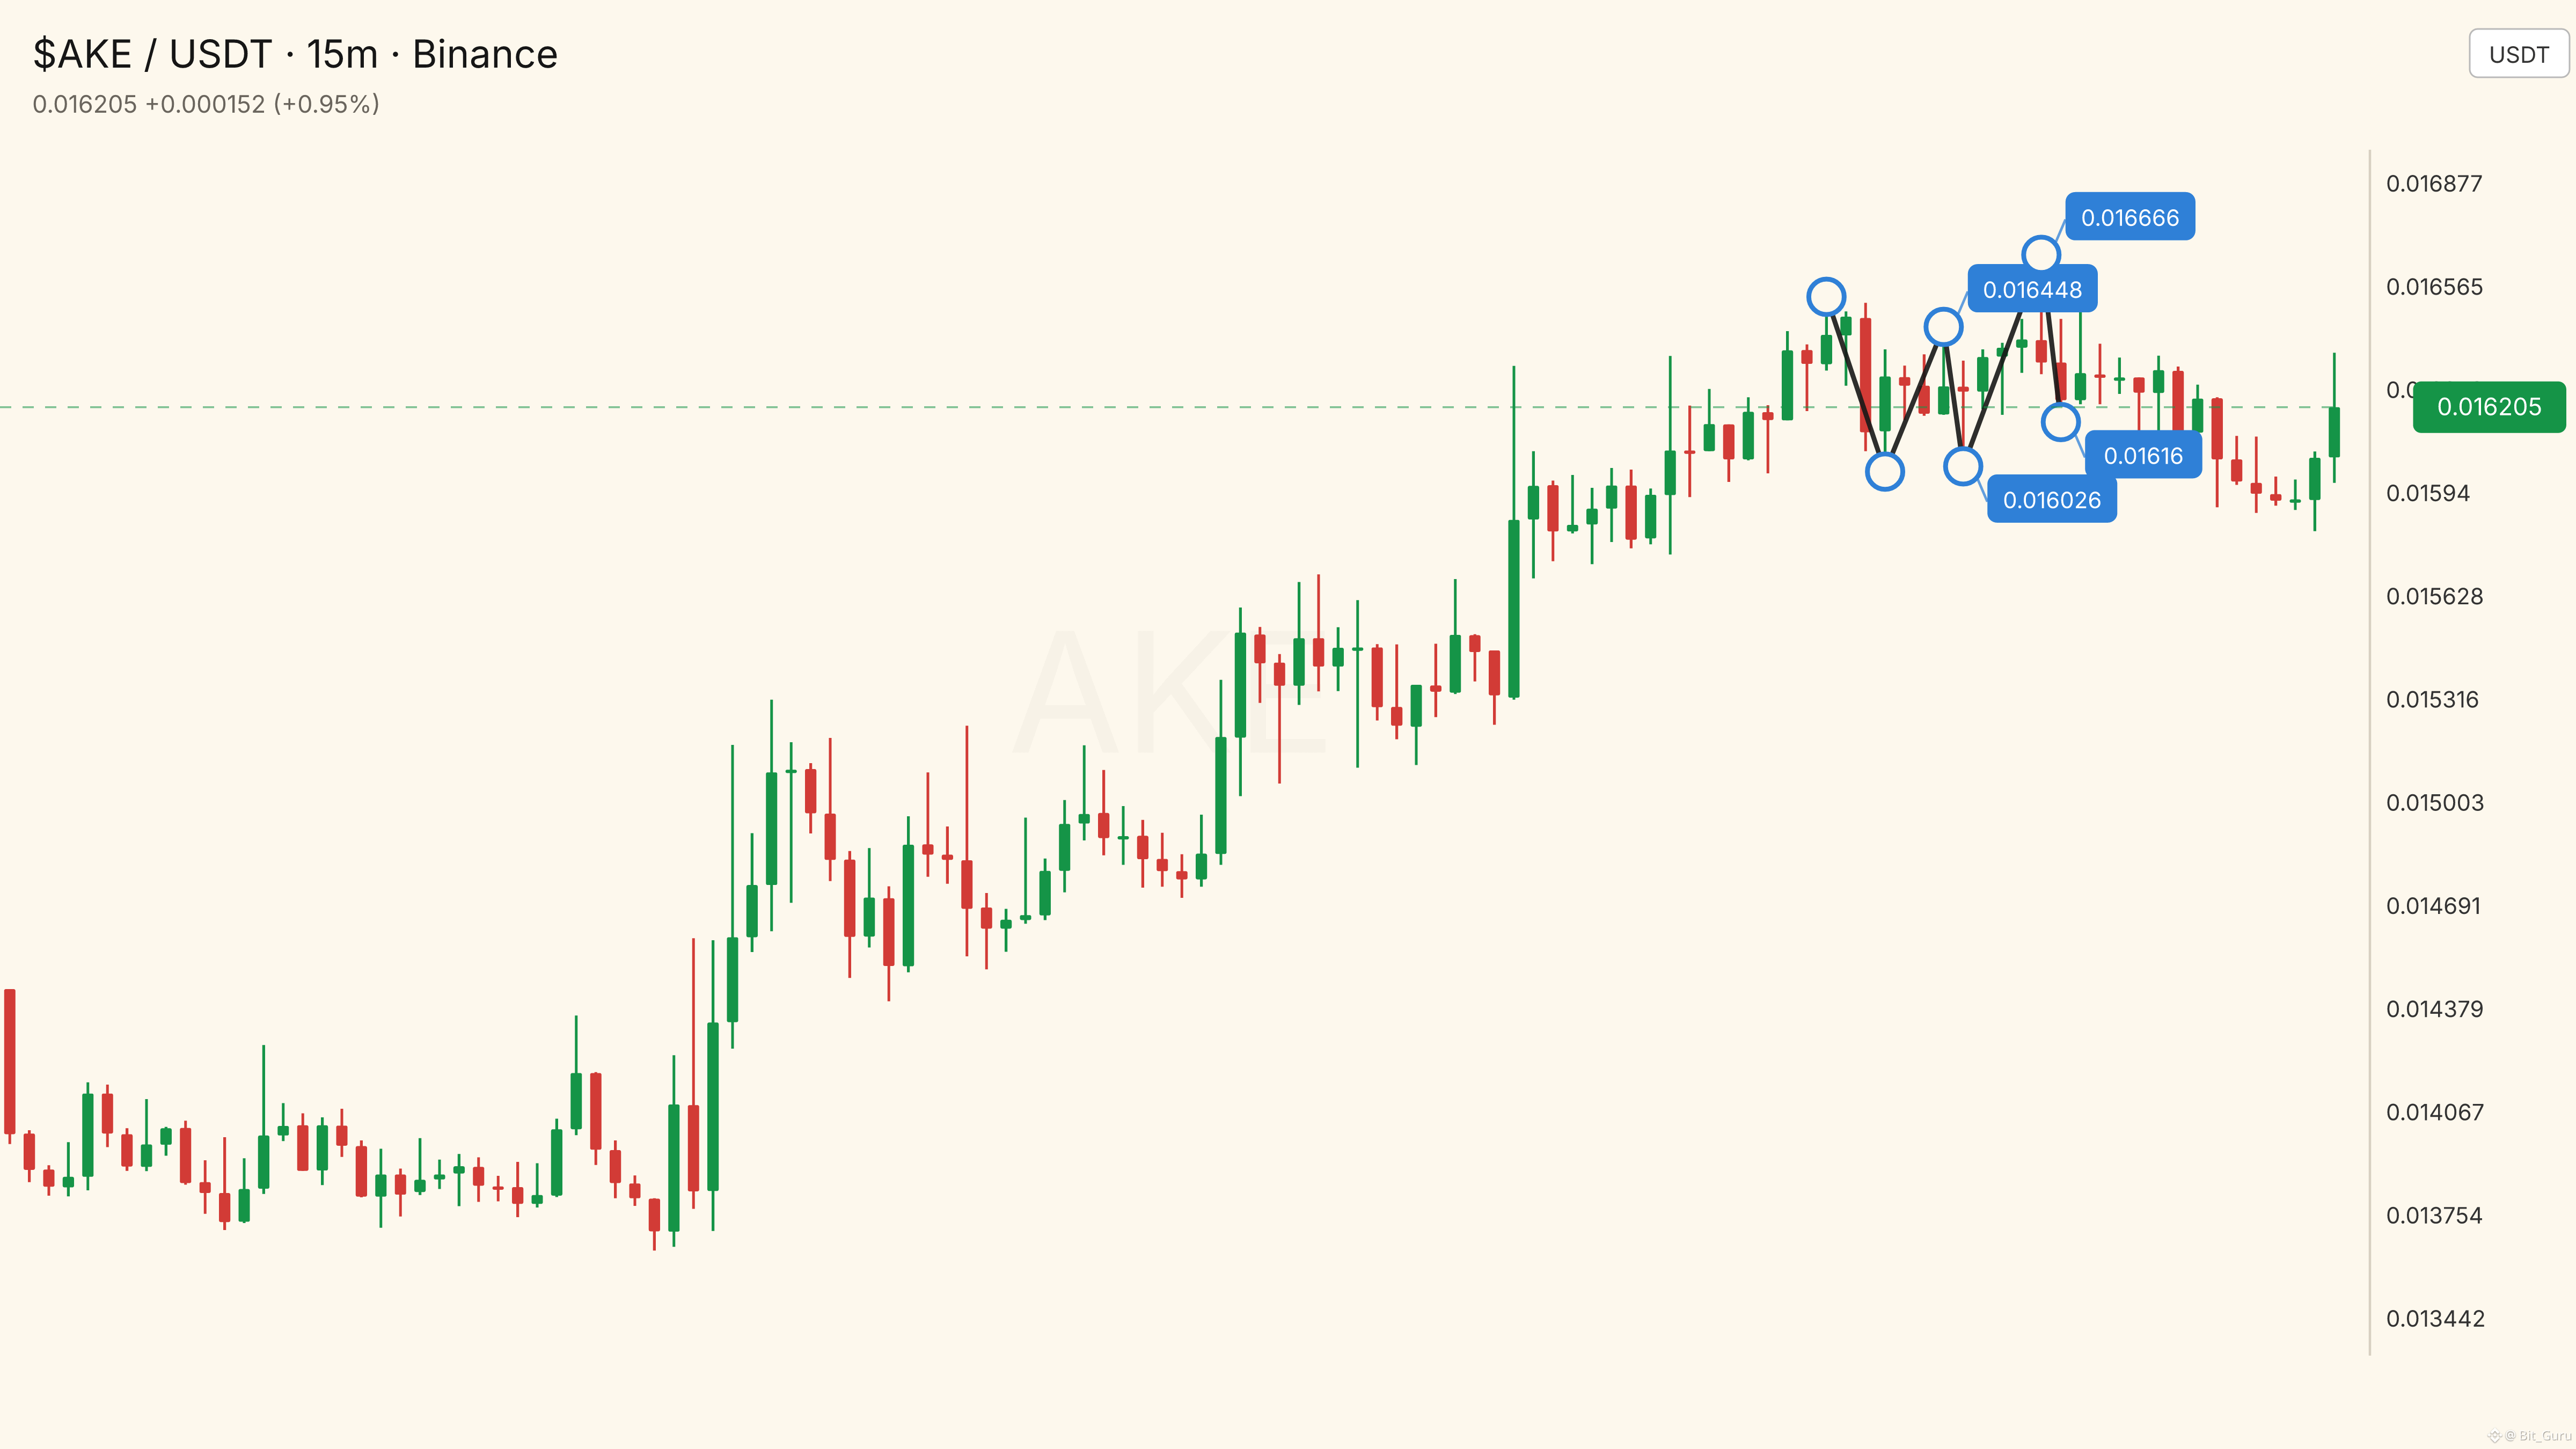
643
·
--
See translation
$UAI caught my eye… 👀🔥 DOWN!
Entry: 0.5968 - 0.59739
SL: 0.6014
TP1: 0.58821 | TP2: 0.58391 | TP3: 0.57962
$UAI caught my eye… 👀🔥 DOWN!
Entry: 0.5968 - 0.59739
SL: 0.6014
TP1: 0.58821 | TP2: 0.58391 | TP3: 0.57962
Entry: 0.5968 - 0.59739
SL: 0.6014
TP1: 0.58821 | TP2: 0.58391 | TP3: 0.57962
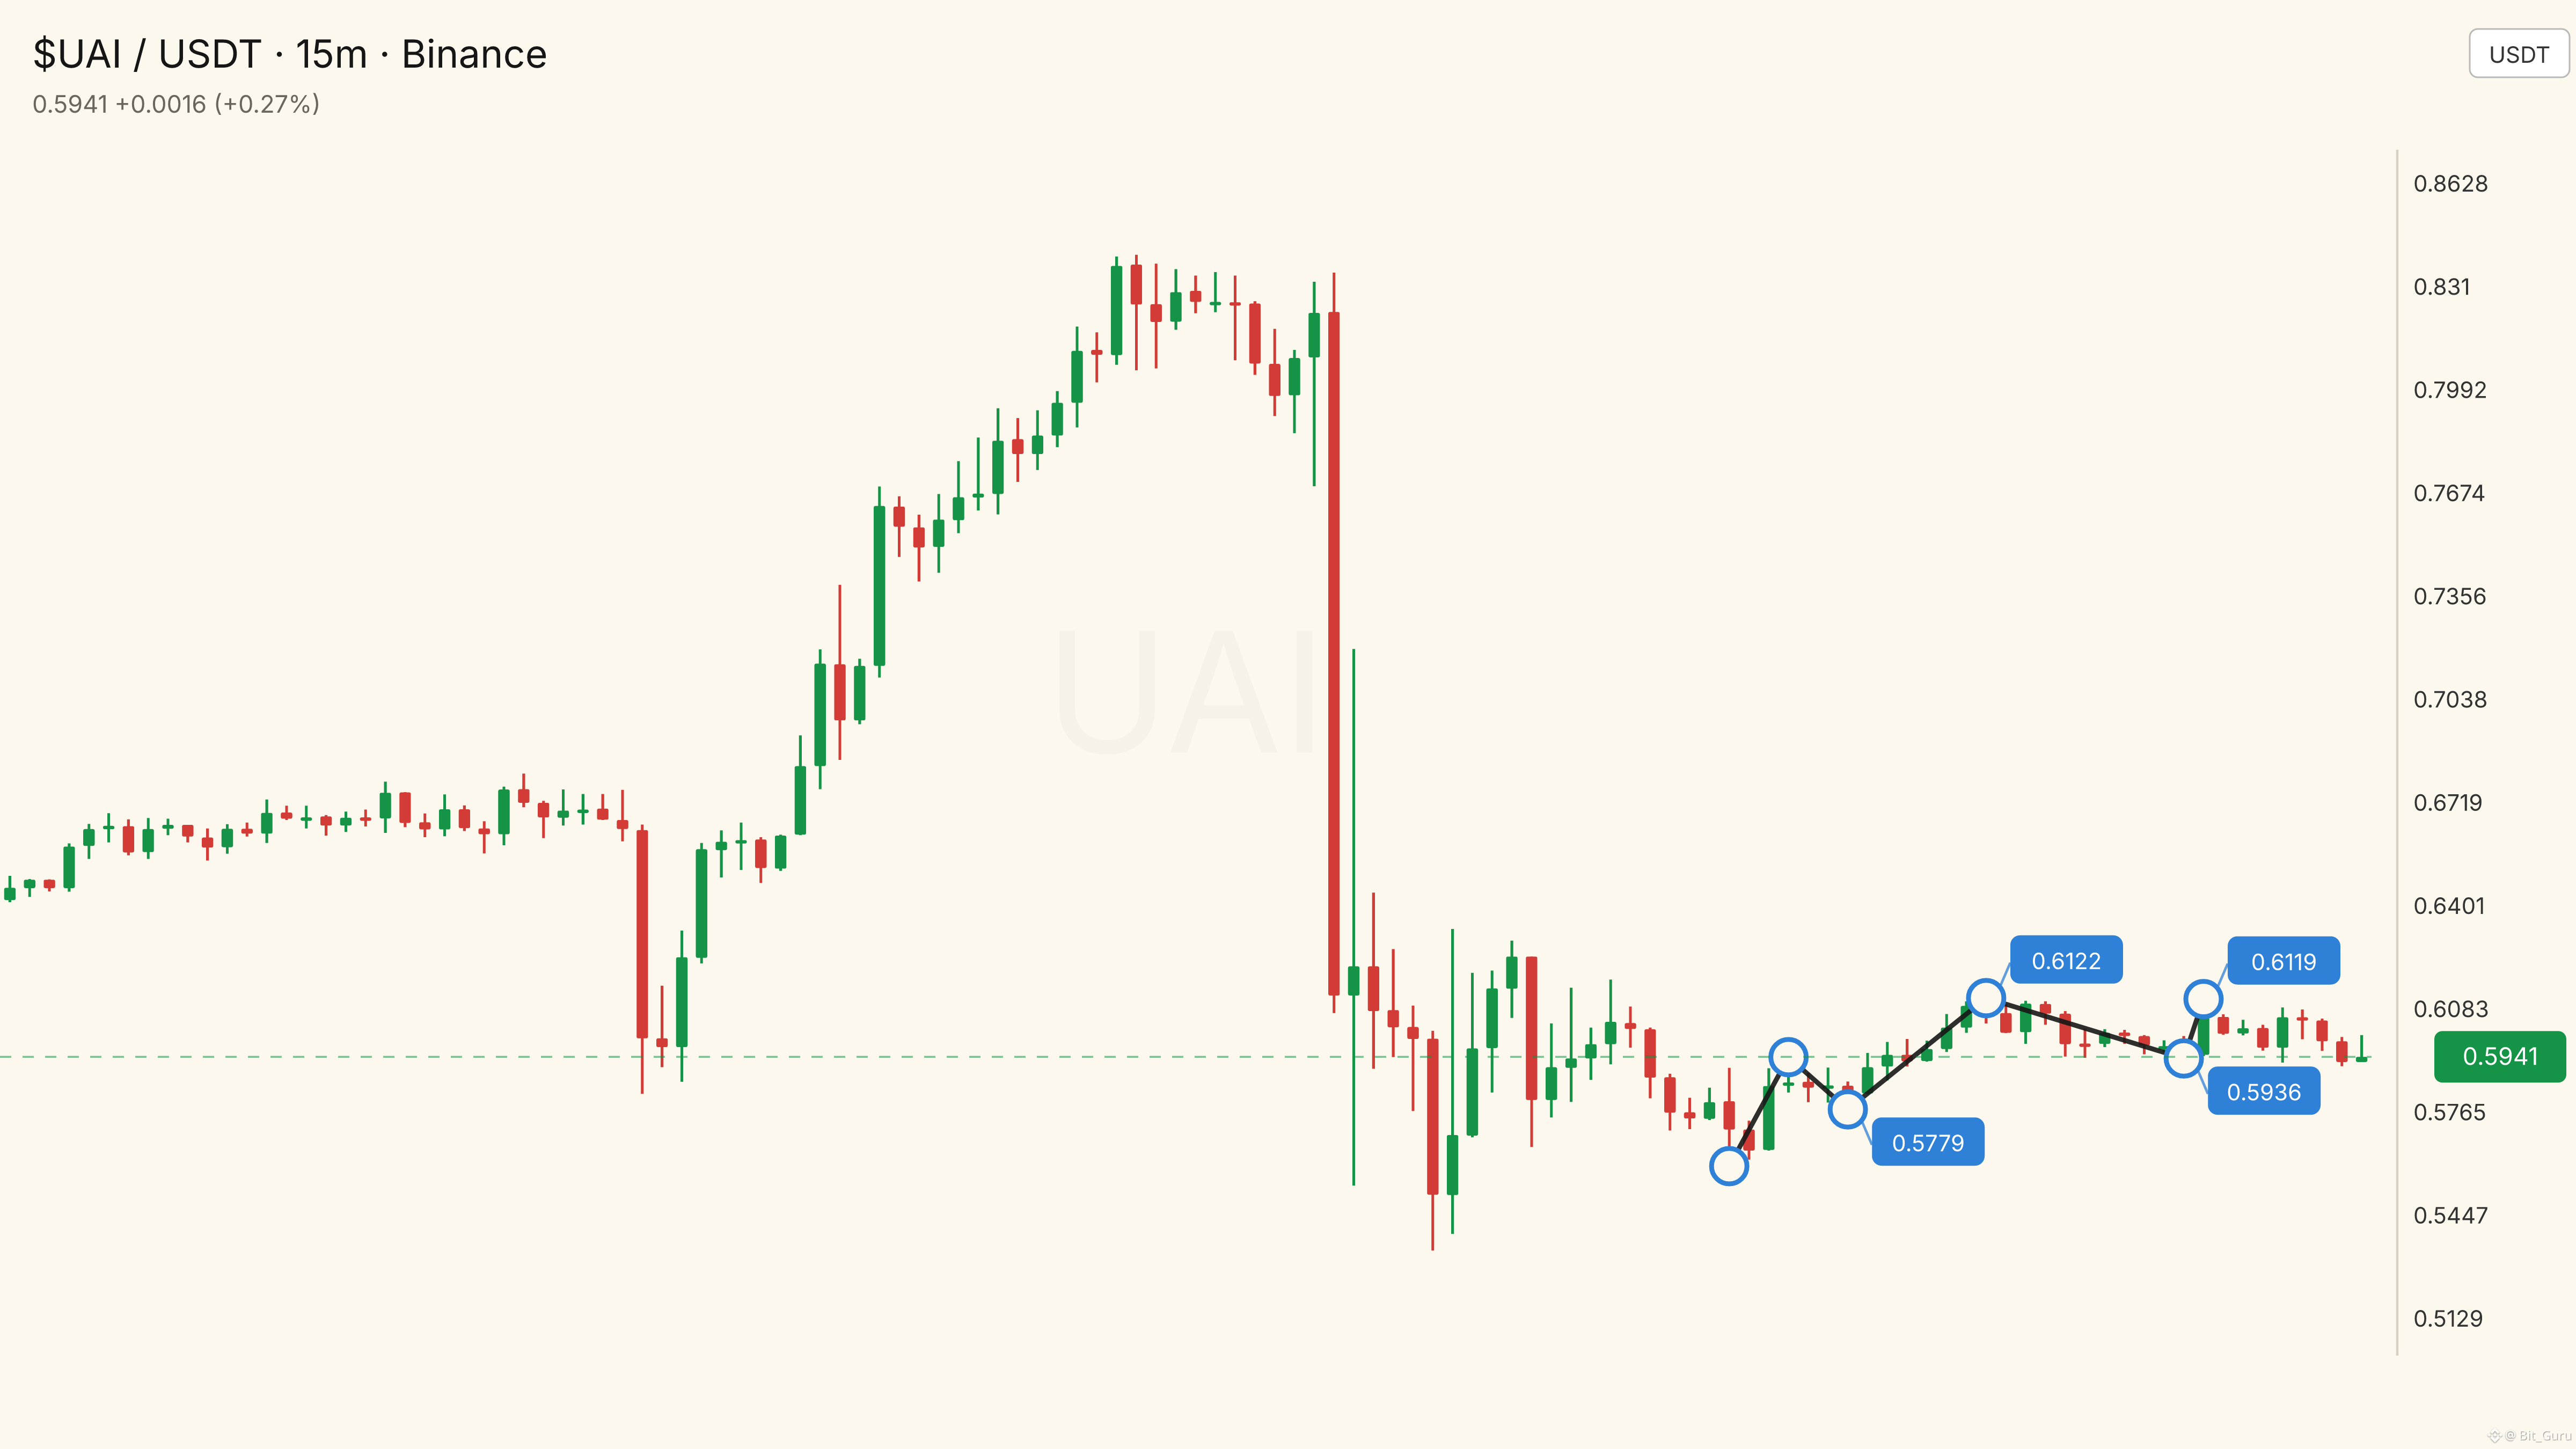
484
·
--
See translation
Guys, watch $PLUME closely… 🔥 DOWN!
Entry: 0.013167 - 0.01318
SL: 0.013256
TP1: 0.012993 | TP2: 0.012906 | TP3: 0.012819
Guys, watch $PLUME closely… 🔥 DOWN!
Entry: 0.013167 - 0.01318
SL: 0.013256
TP1: 0.012993 | TP2: 0.012906 | TP3: 0.012819
Entry: 0.013167 - 0.01318
SL: 0.013256
TP1: 0.012993 | TP2: 0.012906 | TP3: 0.012819
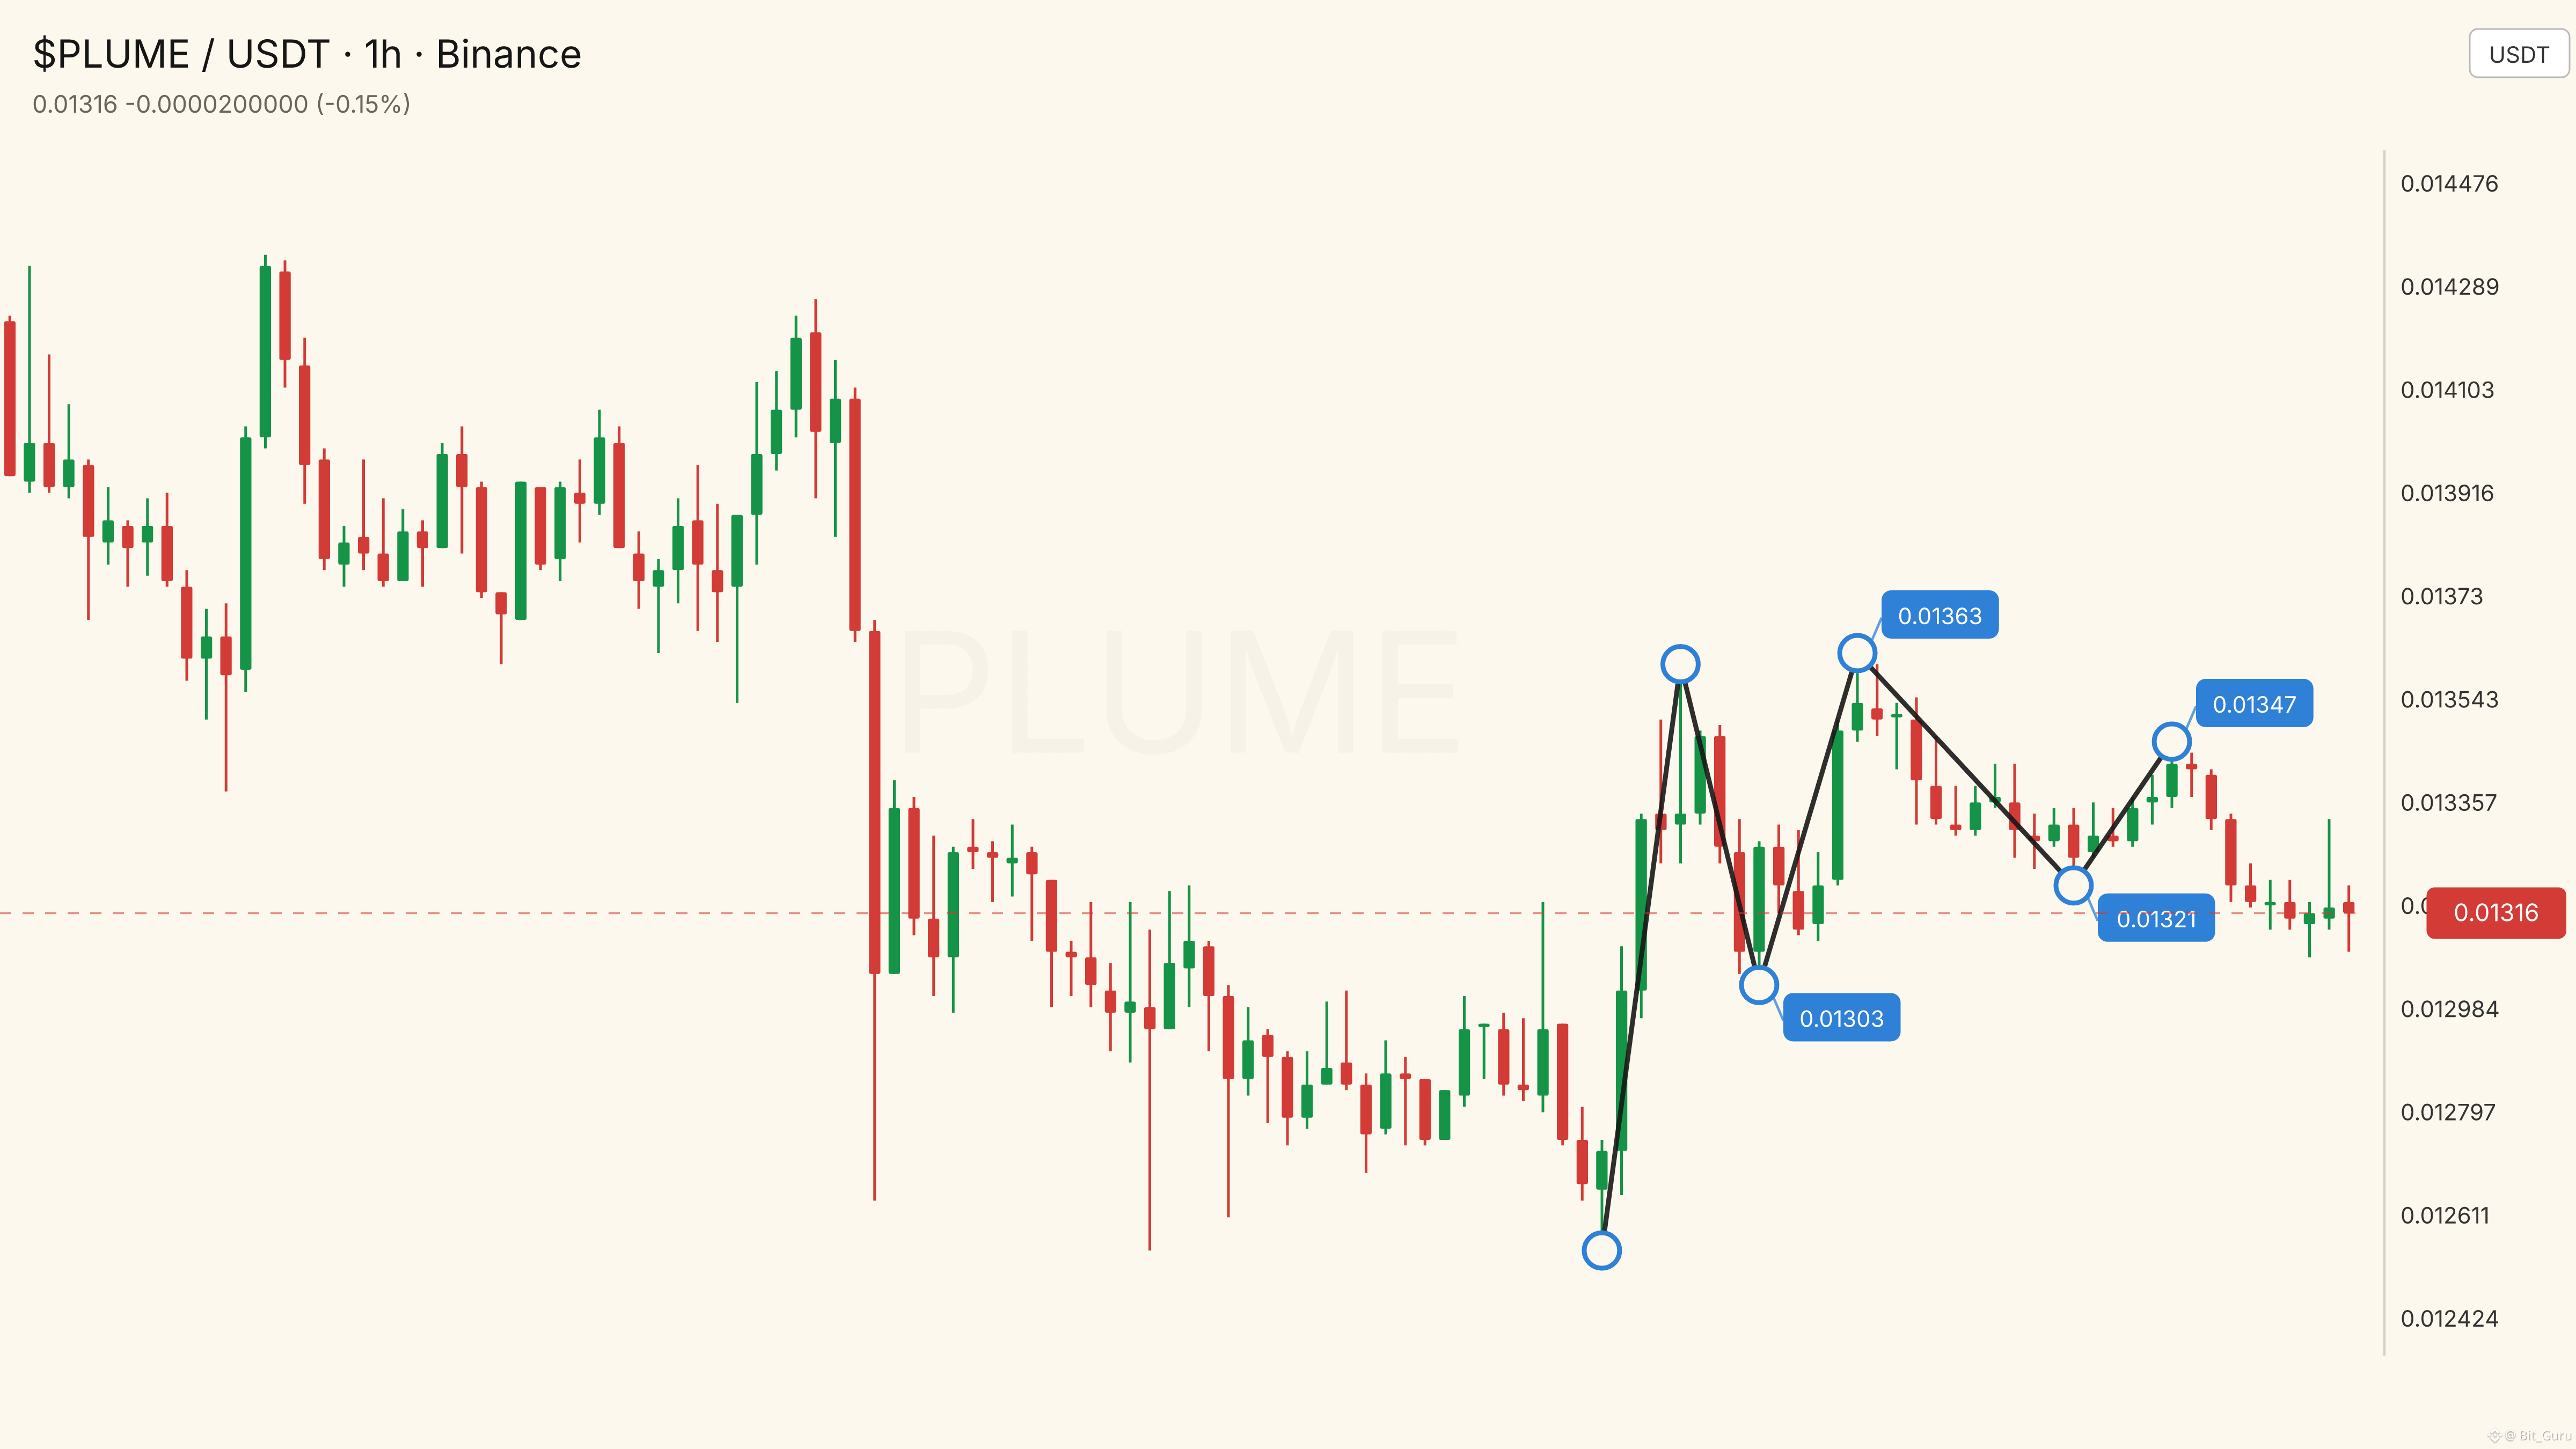
382
·
--
See translation
$LAB caught my eye… 👀🔥 DOWN!
Entry: 0.067814 - 0.067882
SL: 0.068391
TP1: 0.066838 | TP2: 0.06635 | TP3: 0.065862
$LAB caught my eye… 👀🔥 DOWN!
Entry: 0.067814 - 0.067882
SL: 0.068391
TP1: 0.066838 | TP2: 0.06635 | TP3: 0.065862
Entry: 0.067814 - 0.067882
SL: 0.068391
TP1: 0.066838 | TP2: 0.06635 | TP3: 0.065862
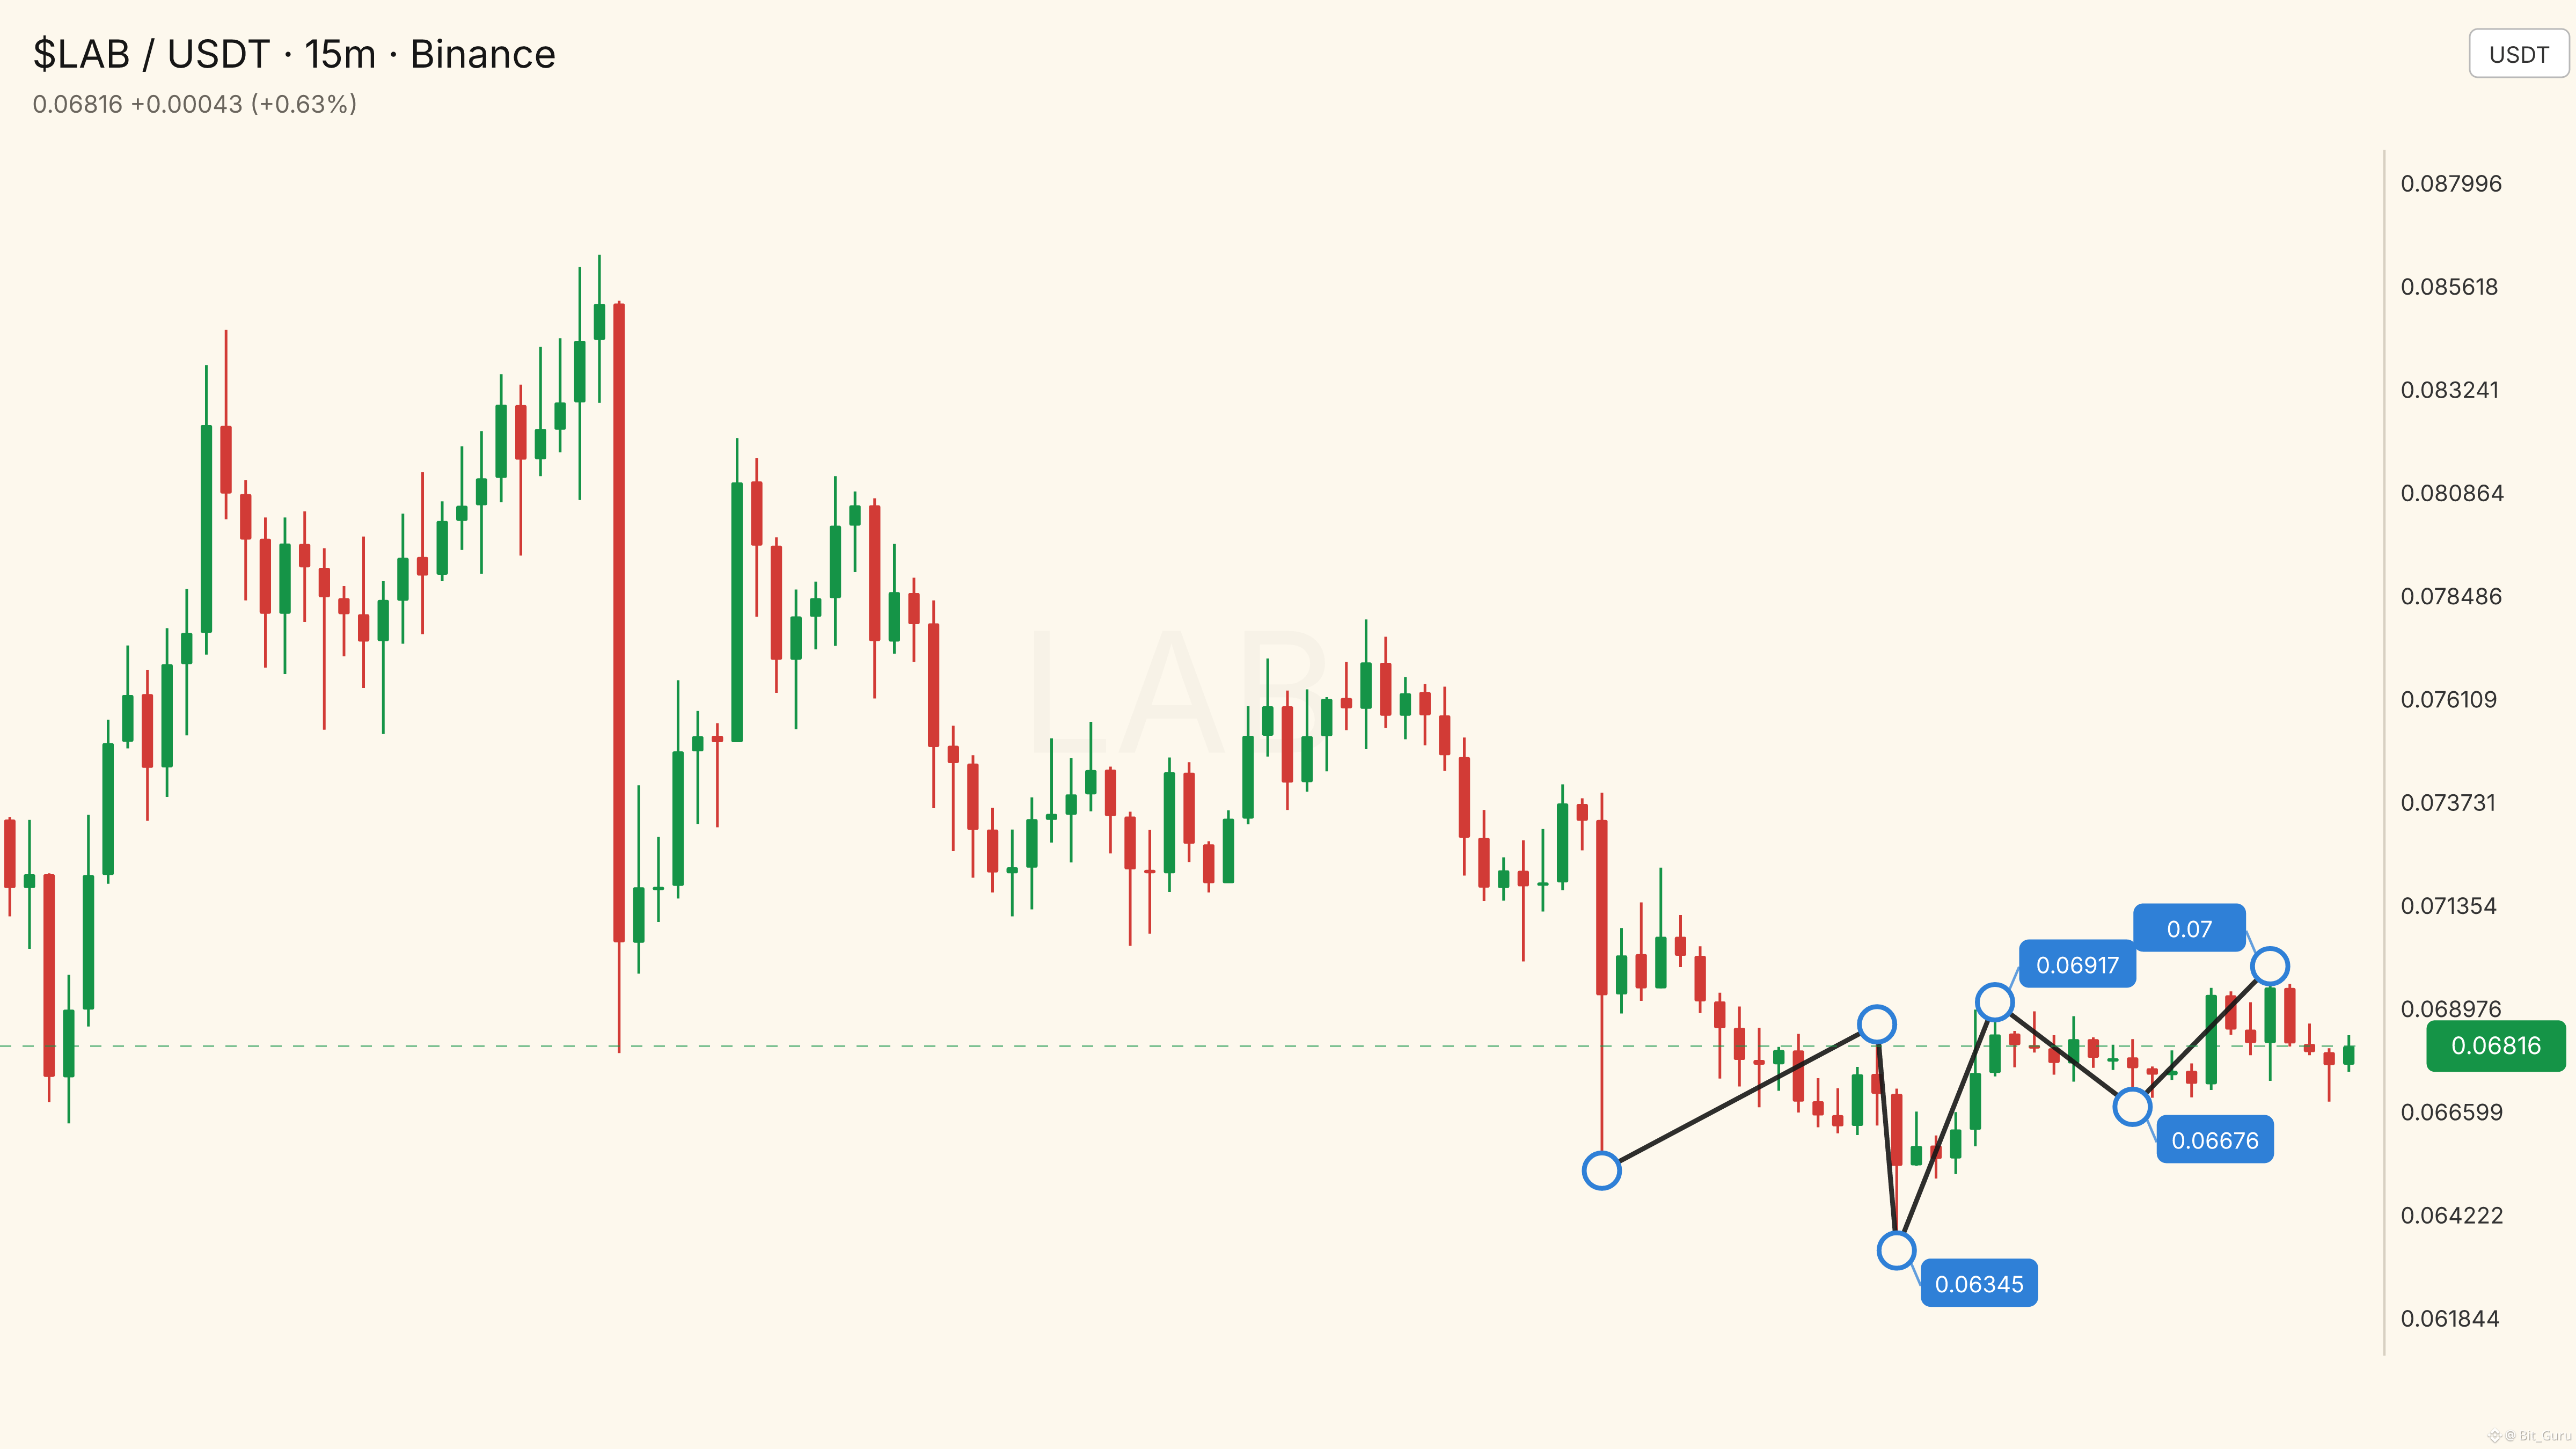
1
476
·
--
I’m here—USDT: Weakening signals for the short-term after a strong surgeA BSC token with an over-the-top name and even more over-the-top price action
𝗖𝗼𝗶𝗻 𝗦𝘁𝗼𝗿𝘆: Why it was added to the watchlist
I’m here—USDT has just entered Bit Guru’s hourly Coin Story watchlist. Not because it has a complete project whitepaper, and not because research confirms some major partnership, but because within a short time it has shown several traits that traders can hardly ignore: price rapidly surged, trading volume clearly expanded, the price increase over the past month is relatively high, yet the latest short-term structure has already started sending pullback signals.
The trading symbol used by the scanner is “I’m here—USDT”, while the project name recorded by CoinGecko is “I’m here—”. The token symbol also displays as “I’m here—”. CoinGecko classifies it as a token related to the BNB Chain ecosystem, Meme, Chinese Meme, and the Four.meme Ecosystem. Research materials also show that this token corresponds to a contract deployed on BSC.
I’m here—USDT: Weakening signals for the short-term after a strong surge
A BSC token with an over-the-top name and even more over-the-top price action
𝗖𝗼𝗶𝗻 𝗦𝘁𝗼𝗿𝘆: Why it was added to the watchlist
I’m here—USDT has just entered Bit Guru’s hourly Coin Story watchlist. Not because it has a complete project whitepaper, and not because research confirms some major partnership, but because within a short time it has shown several traits that traders can hardly ignore: price rapidly surged, trading volume clearly expanded, the price increase over the past month is relatively high, yet the latest short-term structure has already started sending pullback signals.
The trading symbol used by the scanner is “I’m here—USDT”, while the project name recorded by CoinGecko is “I’m here—”. The token symbol also displays as “I’m here—”. CoinGecko classifies it as a token related to the BNB Chain ecosystem, Meme, Chinese Meme, and the Four.meme Ecosystem. Research materials also show that this token corresponds to a contract deployed on BSC.
𝗖𝗼𝗶𝗻 𝗦𝘁𝗼𝗿𝘆: Why it was added to the watchlist
I’m here—USDT has just entered Bit Guru’s hourly Coin Story watchlist. Not because it has a complete project whitepaper, and not because research confirms some major partnership, but because within a short time it has shown several traits that traders can hardly ignore: price rapidly surged, trading volume clearly expanded, the price increase over the past month is relatively high, yet the latest short-term structure has already started sending pullback signals.
The trading symbol used by the scanner is “I’m here—USDT”, while the project name recorded by CoinGecko is “I’m here—”. The token symbol also displays as “I’m here—”. CoinGecko classifies it as a token related to the BNB Chain ecosystem, Meme, Chinese Meme, and the Four.meme Ecosystem. Research materials also show that this token corresponds to a contract deployed on BSC.
442
·
--
See translation
$BTW is in focus… ✅🚨 UP!
Entry: 0.54948 - 0.55003
SL: 0.54591
TP1: 0.55796 | TP2: 0.56192 | TP3: 0.56588
$BTW is in focus… ✅🚨 UP!
Entry: 0.54948 - 0.55003
SL: 0.54591
TP1: 0.55796 | TP2: 0.56192 | TP3: 0.56588
Entry: 0.54948 - 0.55003
SL: 0.54591
TP1: 0.55796 | TP2: 0.56192 | TP3: 0.56588
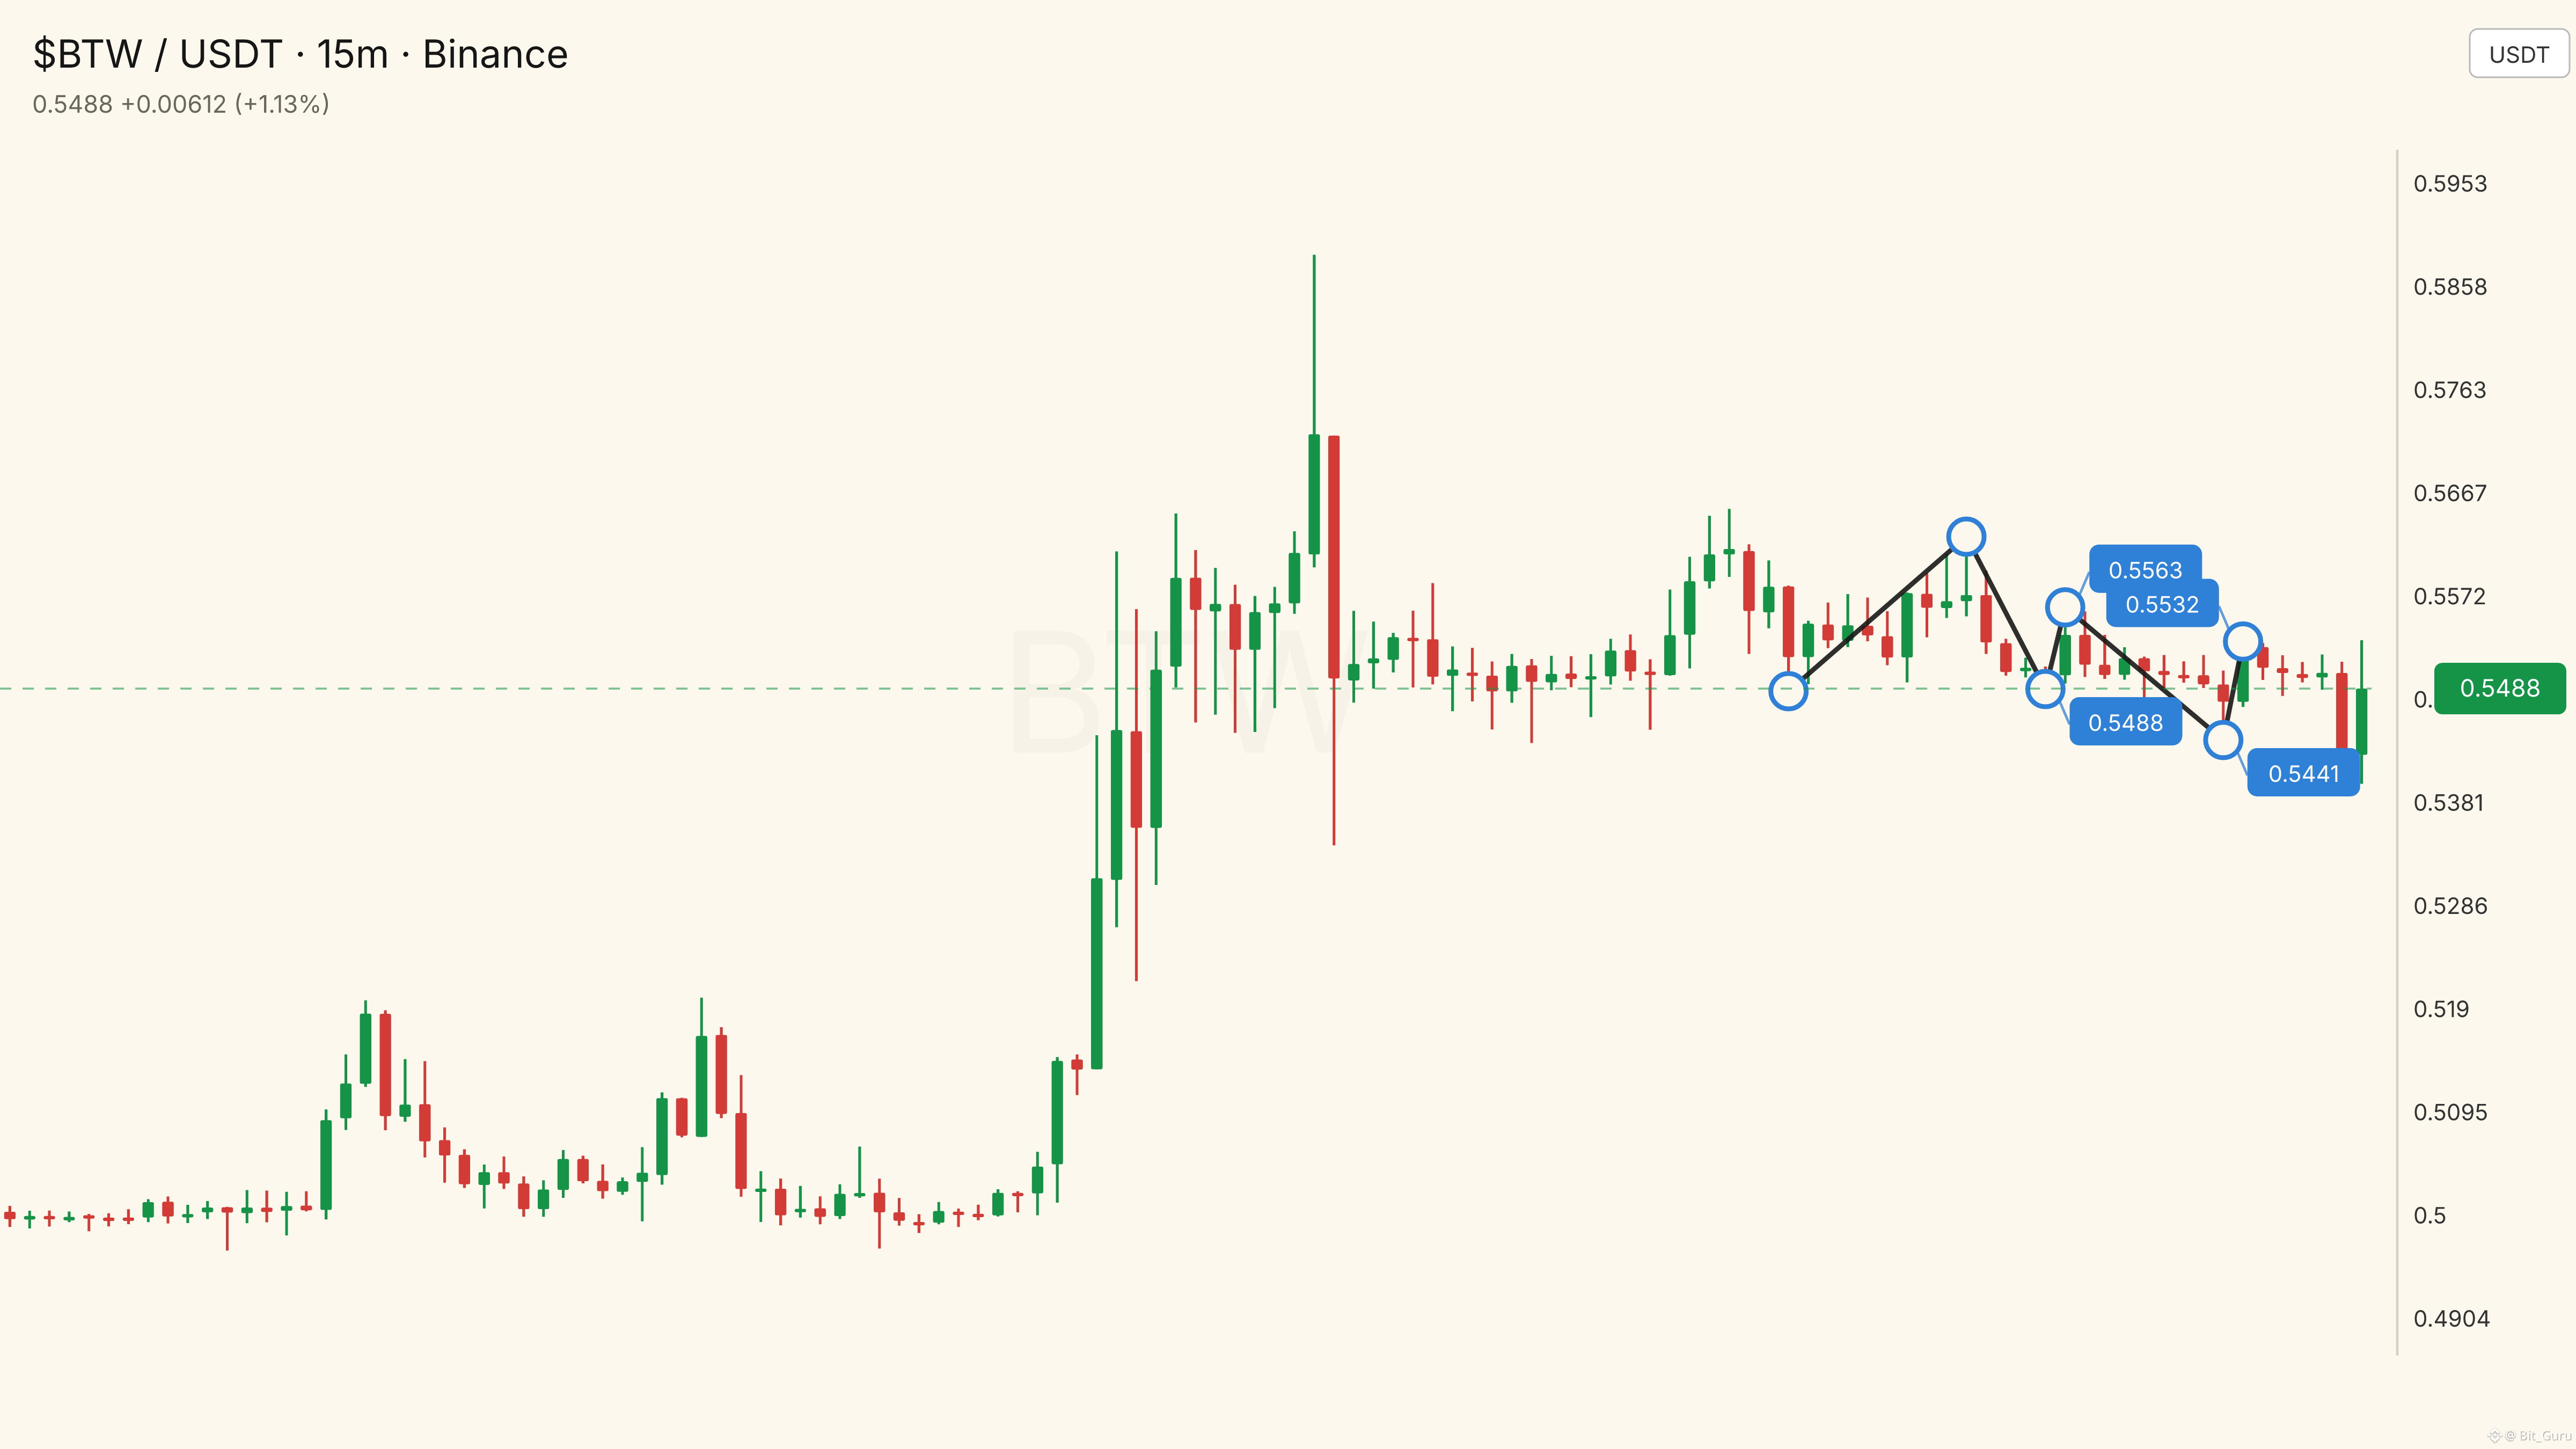
461
·
--
See translation
$APR caught my eye… 👀🔥 DOWN!
Entry: 0.14907 - 0.14922
SL: 0.14985
TP1: 0.14784 | TP2: 0.14722 | TP3: 0.1466
$APR caught my eye… 👀🔥 DOWN!
Entry: 0.14907 - 0.14922
SL: 0.14985
TP1: 0.14784 | TP2: 0.14722 | TP3: 0.1466
Entry: 0.14907 - 0.14922
SL: 0.14985
TP1: 0.14784 | TP2: 0.14722 | TP3: 0.1466
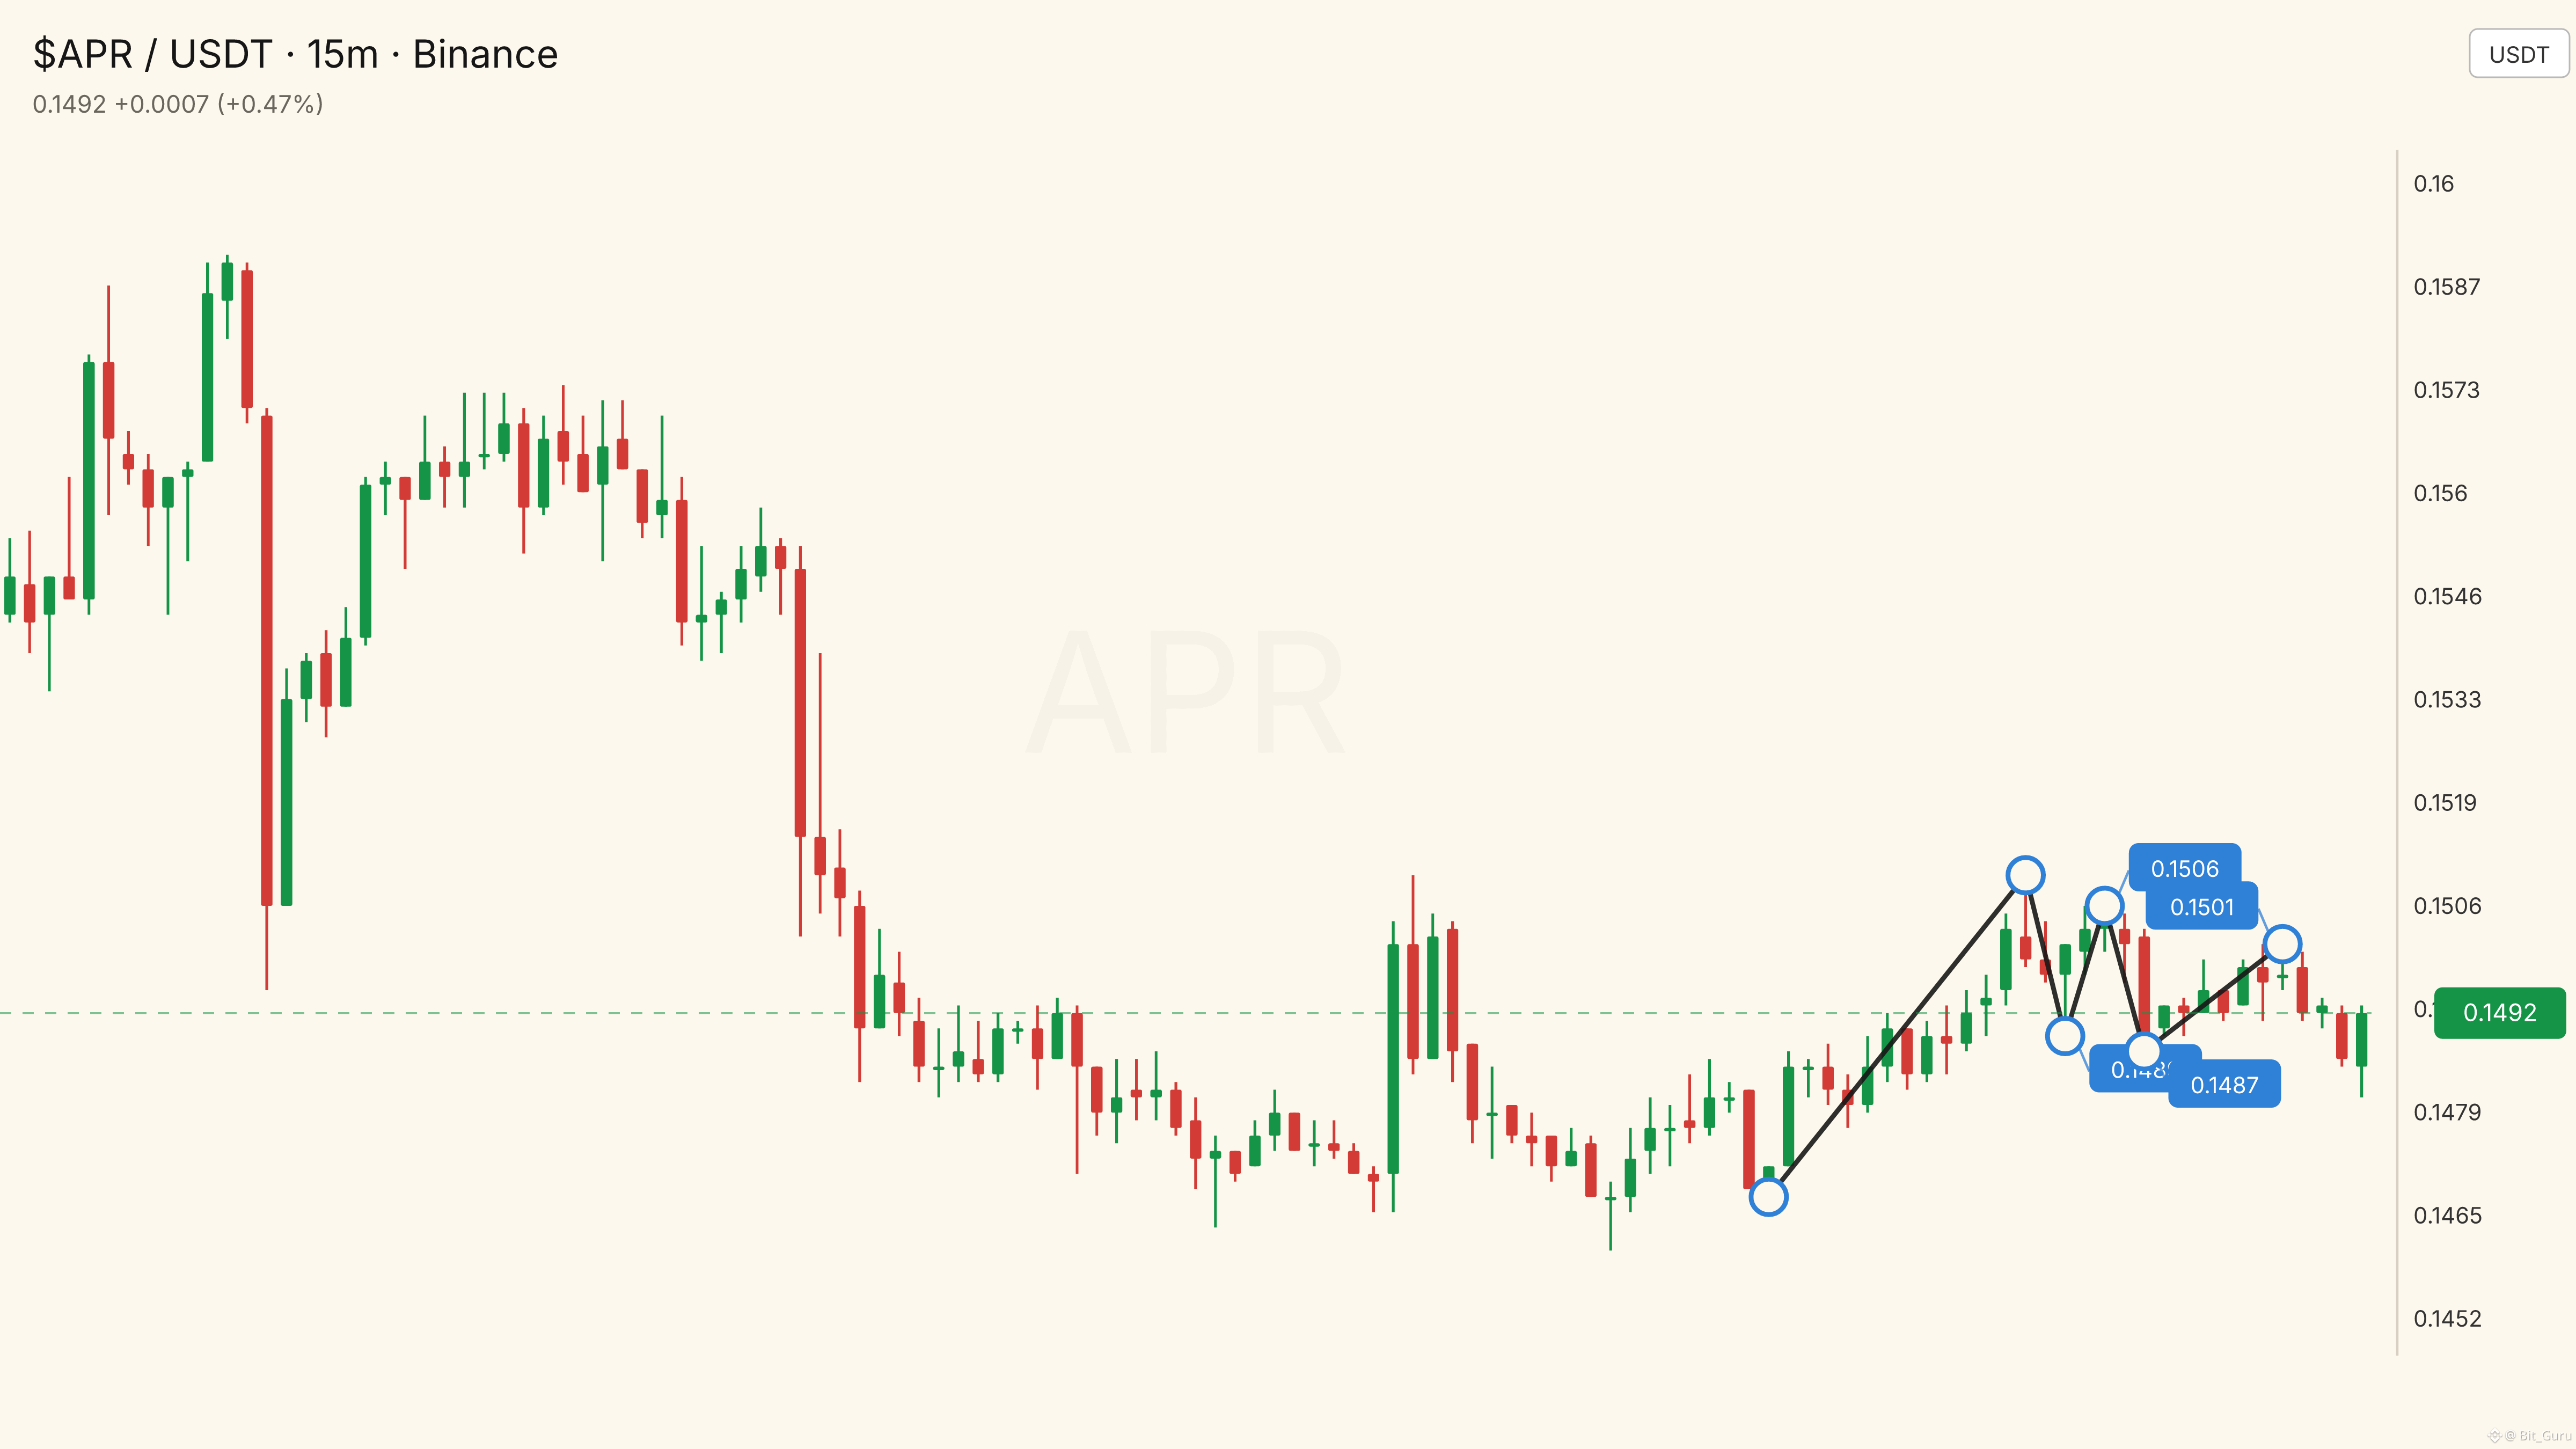
477
Log in to explore more content
Join global crypto users on Binance Square
⚡️ Get latest and useful information about crypto.
💬 Trusted by the world’s largest crypto exchange.
👍 Discover real insights from verified creators.
Email / Phone number
Trending Topics
SECReceivesGrayscaleLitecoinTrustETFFiling
24,879 views
494 Discussing
💎 Institutional Attention Reaches Litecoin
Grayscale’s ETF filing has placed $LTC in a bigger conversation. For spot traders, developments like this are a reminder to study strong assets before making any entry.
#secreceivesgrayscalelitecointrustetffiling
CryptoMahibaloch
·1 Likes
·995 views
ClarityActFacesProceduralVoteSept15
128,441 views
1,484 Discussing
US10YearTreasuryYieldNears5%
43,697 views
760 Discussing