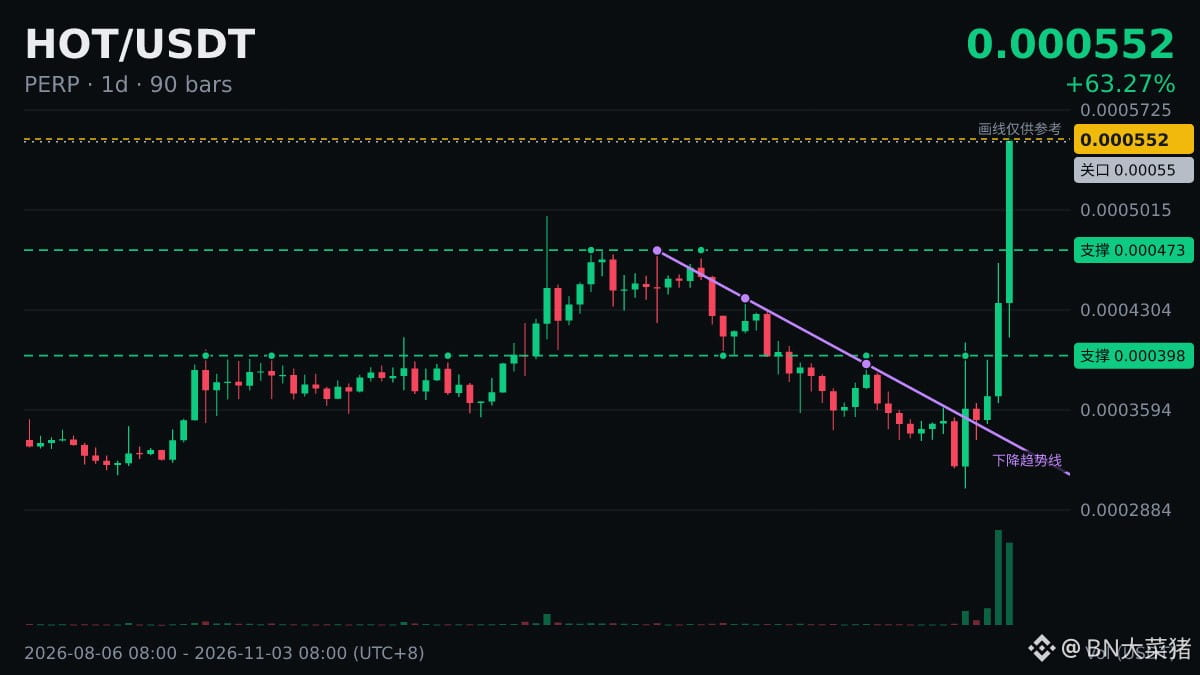
$HOT Daily RSI is 76.6, in overbought territory.
Let’s unpack what this number means.
RSI 50 is often seen as the dividing line between strength and weakness: staying above 50 indicates that upward momentum is dominant, while staying below it suggests the opposite.
RSI is calculated from historical prices, so it reflects price movements that have already happened; it can’t tell you what to do next.
It’s safer to look for confirmation from several indicators rather than relying on just one, but even more signals can’t provide a definite answer.
Let’s unpack what this number means.
RSI 50 is often seen as the dividing line between strength and weakness: staying above 50 indicates that upward momentum is dominant, while staying below it suggests the opposite.
RSI is calculated from historical prices, so it reflects price movements that have already happened; it can’t tell you what to do next.
It’s safer to look for confirmation from several indicators rather than relying on just one, but even more signals can’t provide a definite answer.