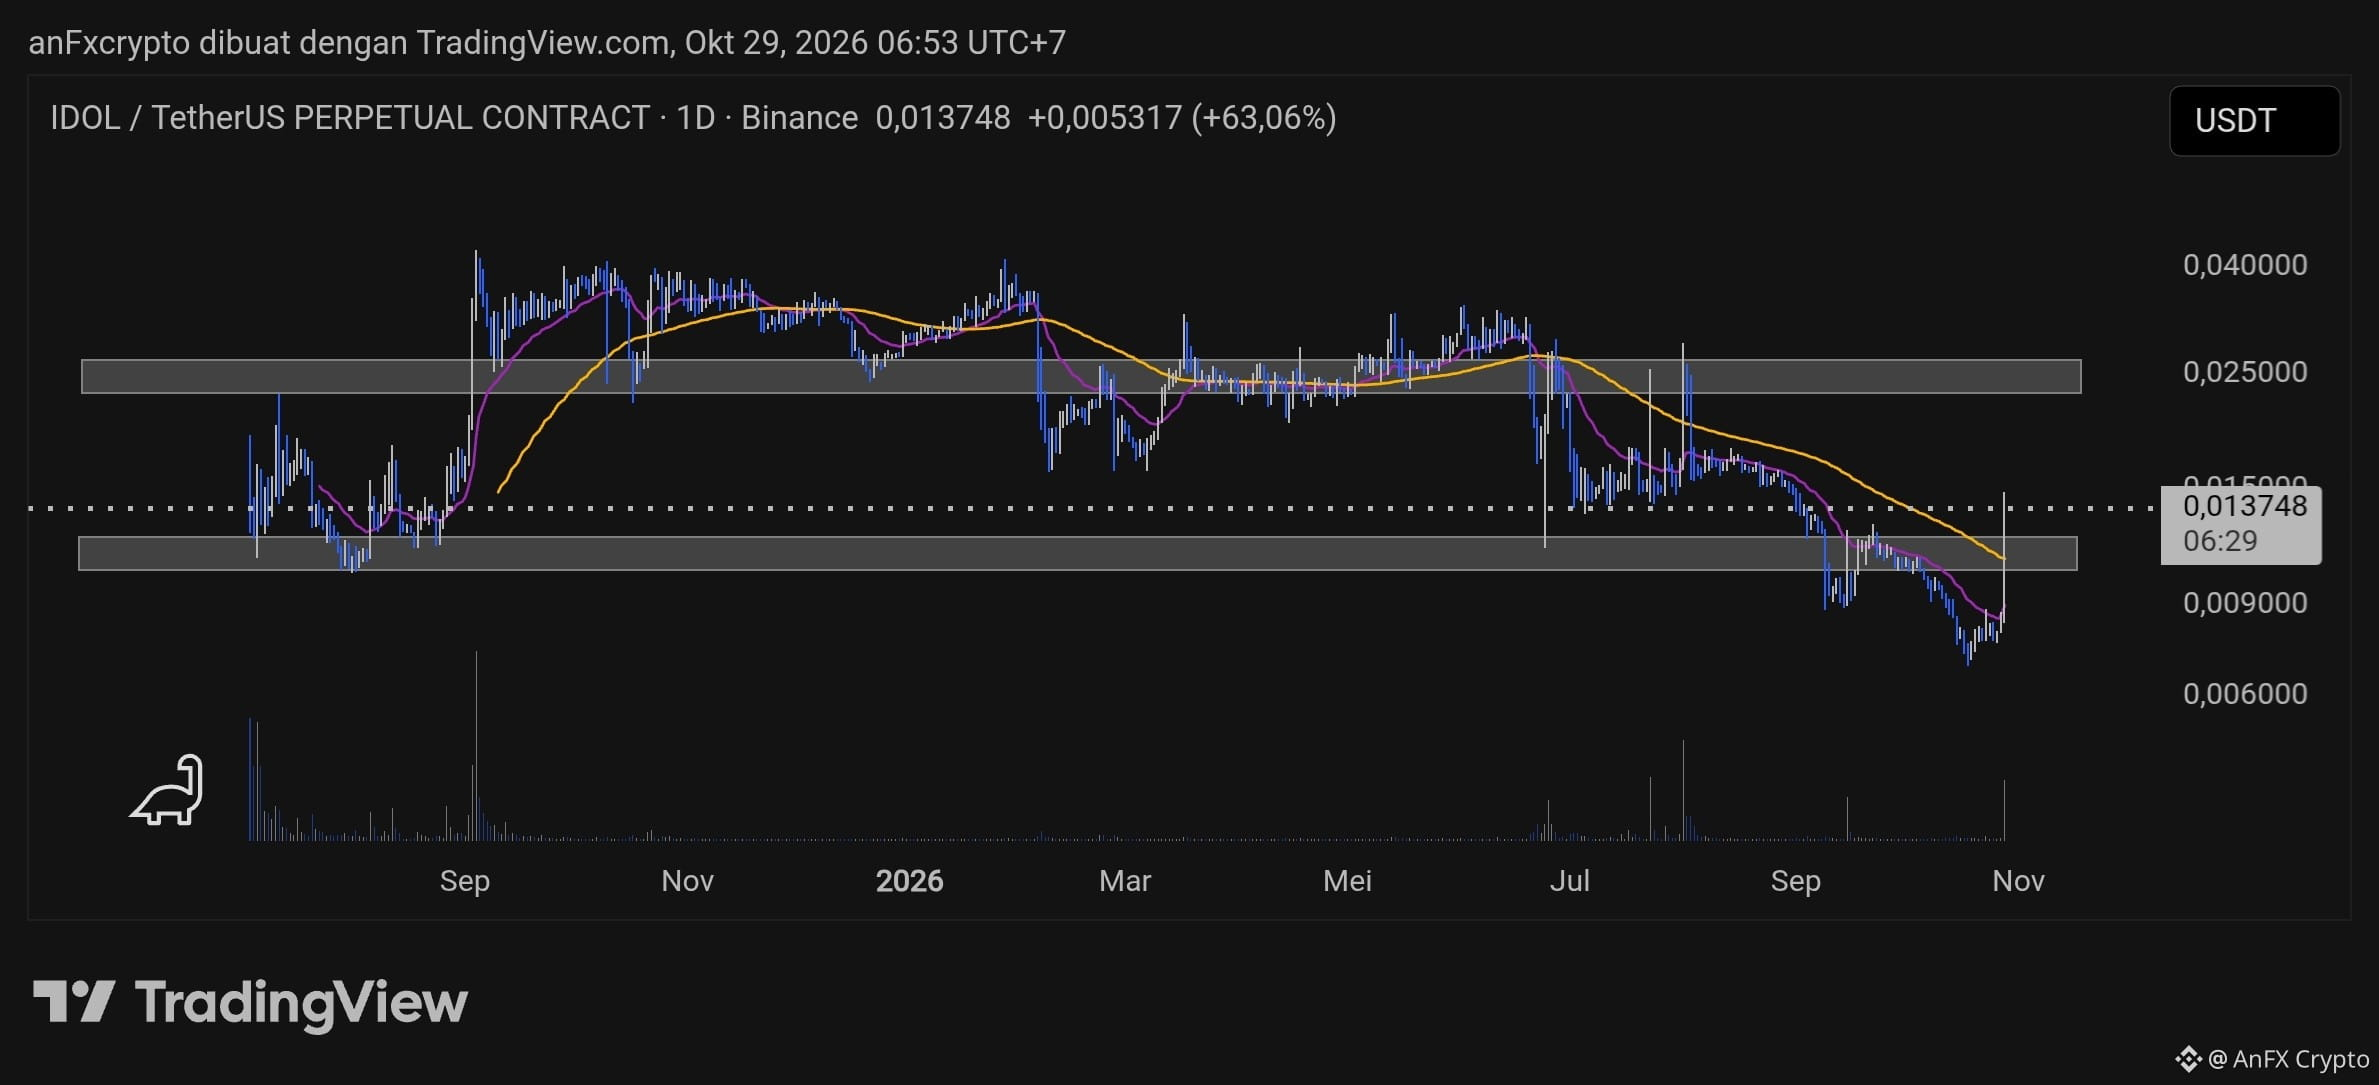
Technical Analysis of $IDOL /USDT (1D Chart - Perpetual Contract):
Market Structure & Trend: The major trend is under strong bearish pressure (downtrend). The price is moving below the Moving Average (MA), indicating consistent seller dominance from the upper resistance area ($0.02500).
Critical Support Zone: The price is currently approaching or testing the historical low / lower support zone around $0.0068–$0.0075. This area is the buyers’ last line of defense.
Volume: Trading volume is relatively thin, with occasional small spikes. This indicates that there has not yet been any major accumulation by smart money, so the risk of false volatility (fakeouts) remains high.
Signals & Trading Plan (High Risk / Counter-Trend Scalp or Wait-and-See):
Given that the major trend is still bearish, the safest approach is to wait and see, or take a short-term speculative position if a rebound is confirmed in the support area.
Long Scenario (Rebound / Support Bounce):
Entry Area (Buy): $0.0070–$0.0075 (if price rejection / bullish rejection at lower support is confirmed).
Take Profit (TP):
TP1: $0.0090
TP2: $0.0115 (near the dynamic MA line)
Stop Loss (SL): Below $0.0065 (if major support breaks).
Short Scenario (Following the Bearish Trend):
Entry Area (Sell): If a weak pullback approaches the MA line or the nearest resistance area at $0.0110–$0.0130.
Take Profit (TP): $0.0075
Stop Loss (SL): Above $0.0145.
Risk Management Note: Since this asset has lower liquidity and the daily trend is currently down, use a small position size and always apply a Stop Loss to avoid liquidation risk.