Two earnings reports on the same night, both with a line item called “crypto revenue.” SoFi reported $162 million and netted just $1.63 million. That doesn’t mean one business is 73 times larger than the other; it means the two companies are recording two different things.
SoFi’s statements list costs separately: $161.6 million in crypto transaction revenue, $160.0 million in crypto transaction costs, and $1.63 million net— a 1.01% net margin.
For every $100 of crypto revenue, just $1.01 is left.
That figure sits in the report like a “toll fee” laid out on the table.
You can’t see that figure for Robinhood. Its crypto revenue was $120 million, down 55% year over year, while costs are folded into a single “brokerage and transaction” line item. That $68 million line item also includes stocks, options, event contracts, and crypto.
So comparing $120 million with $162 million is comparing the companies’ accounting, not their businesses.
What’s really interesting is how the market priced them. SoFi rose 13.42% on Tuesday because total revenue climbed 44% to $1.385 billion, net income rose 73% to $241 million, and the company raised its full-year guidance.
But crypto accounted for just 0.12% of its total revenue on a net basis, and 11.7% on a gross basis.
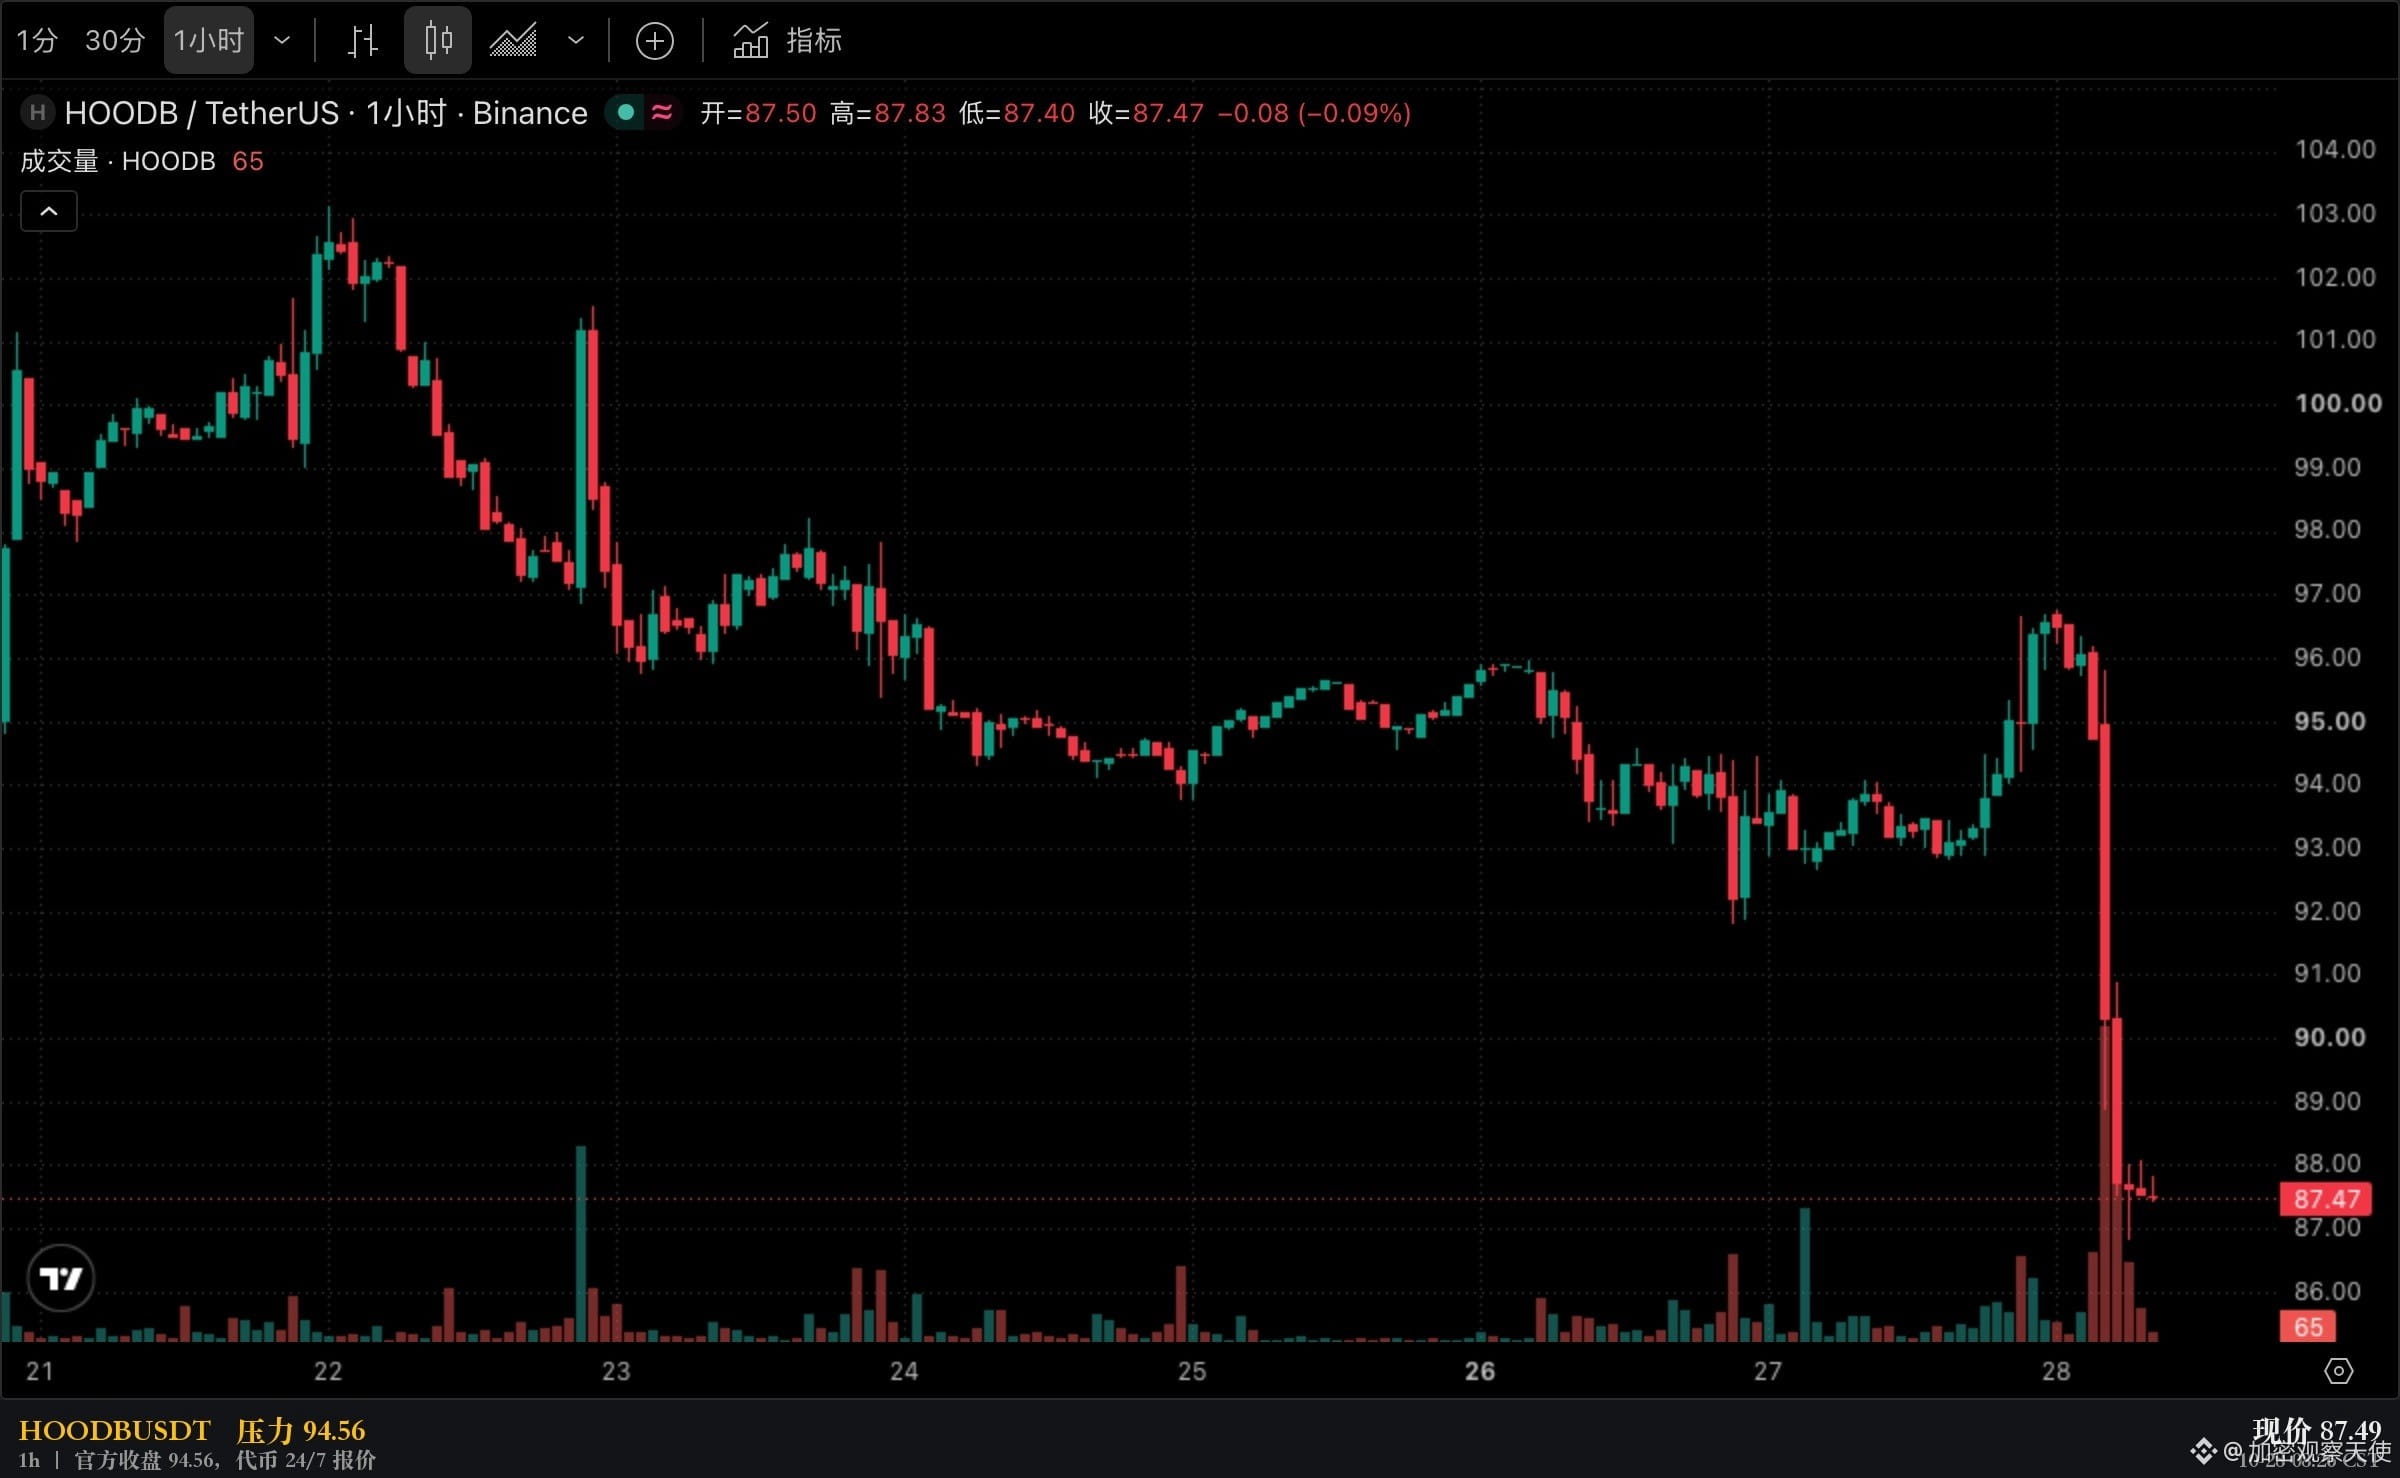
That same night, $HOODB fell from its official close of 94.56 to 87.49. Crypto revenue makes up 8.4% of its total net revenue—71 times SoFi’s share on a net basis. #美股 The less a company looks like a crypto company, the more it rose.
The counterevidence matters. HOODB’s 24-hour trading volume was $1.19 million. That’s a token quote from continuous trading, not an official after-hours price, so the sample for this decline is thin. SoFi’s gains also came mainly from its total revenue guidance, which had nothing to do with crypto.
What I’m unsure about is SoFi’s 1.01%. The cost item isn’t defined in the announcement. It could plausibly be a revenue share paid to partners, or clearing and market-making costs, but there’s no way to verify.
The key is to understand who ultimately bears this cost.
When line items have the same name but use different cost definitions, the multiples you get from comparing them are false. Directly subtracting the two companies’ “same metric” gives you the accounting difference, not the business difference.
Accounting definitions can change; the business doesn’t.
At the time of publication, $HOODB was at 87.58, 7.4% below its official close of 94.56. #财报 All figures use the original reporting basis, with no adjustments.
When you look at “crypto revenue,” is it gross or net?
Data: SoFi 8-K Exhibit 99.1, filed 10-27.
Accession 0001818874-26-000065.
Robinhood 8-K Exhibit 99.1, filed after the market close on 10-27.
Accession 0001783879-26-000164.
Share prices are as of the 10-27 close; HOODB is a Binance snapshot from 10-28 at 10:20 CST.
The above is a compilation of publicly reported financial data and personal analysis, and does not constitute investment advice.