Trading Idea | 9/23 20:21
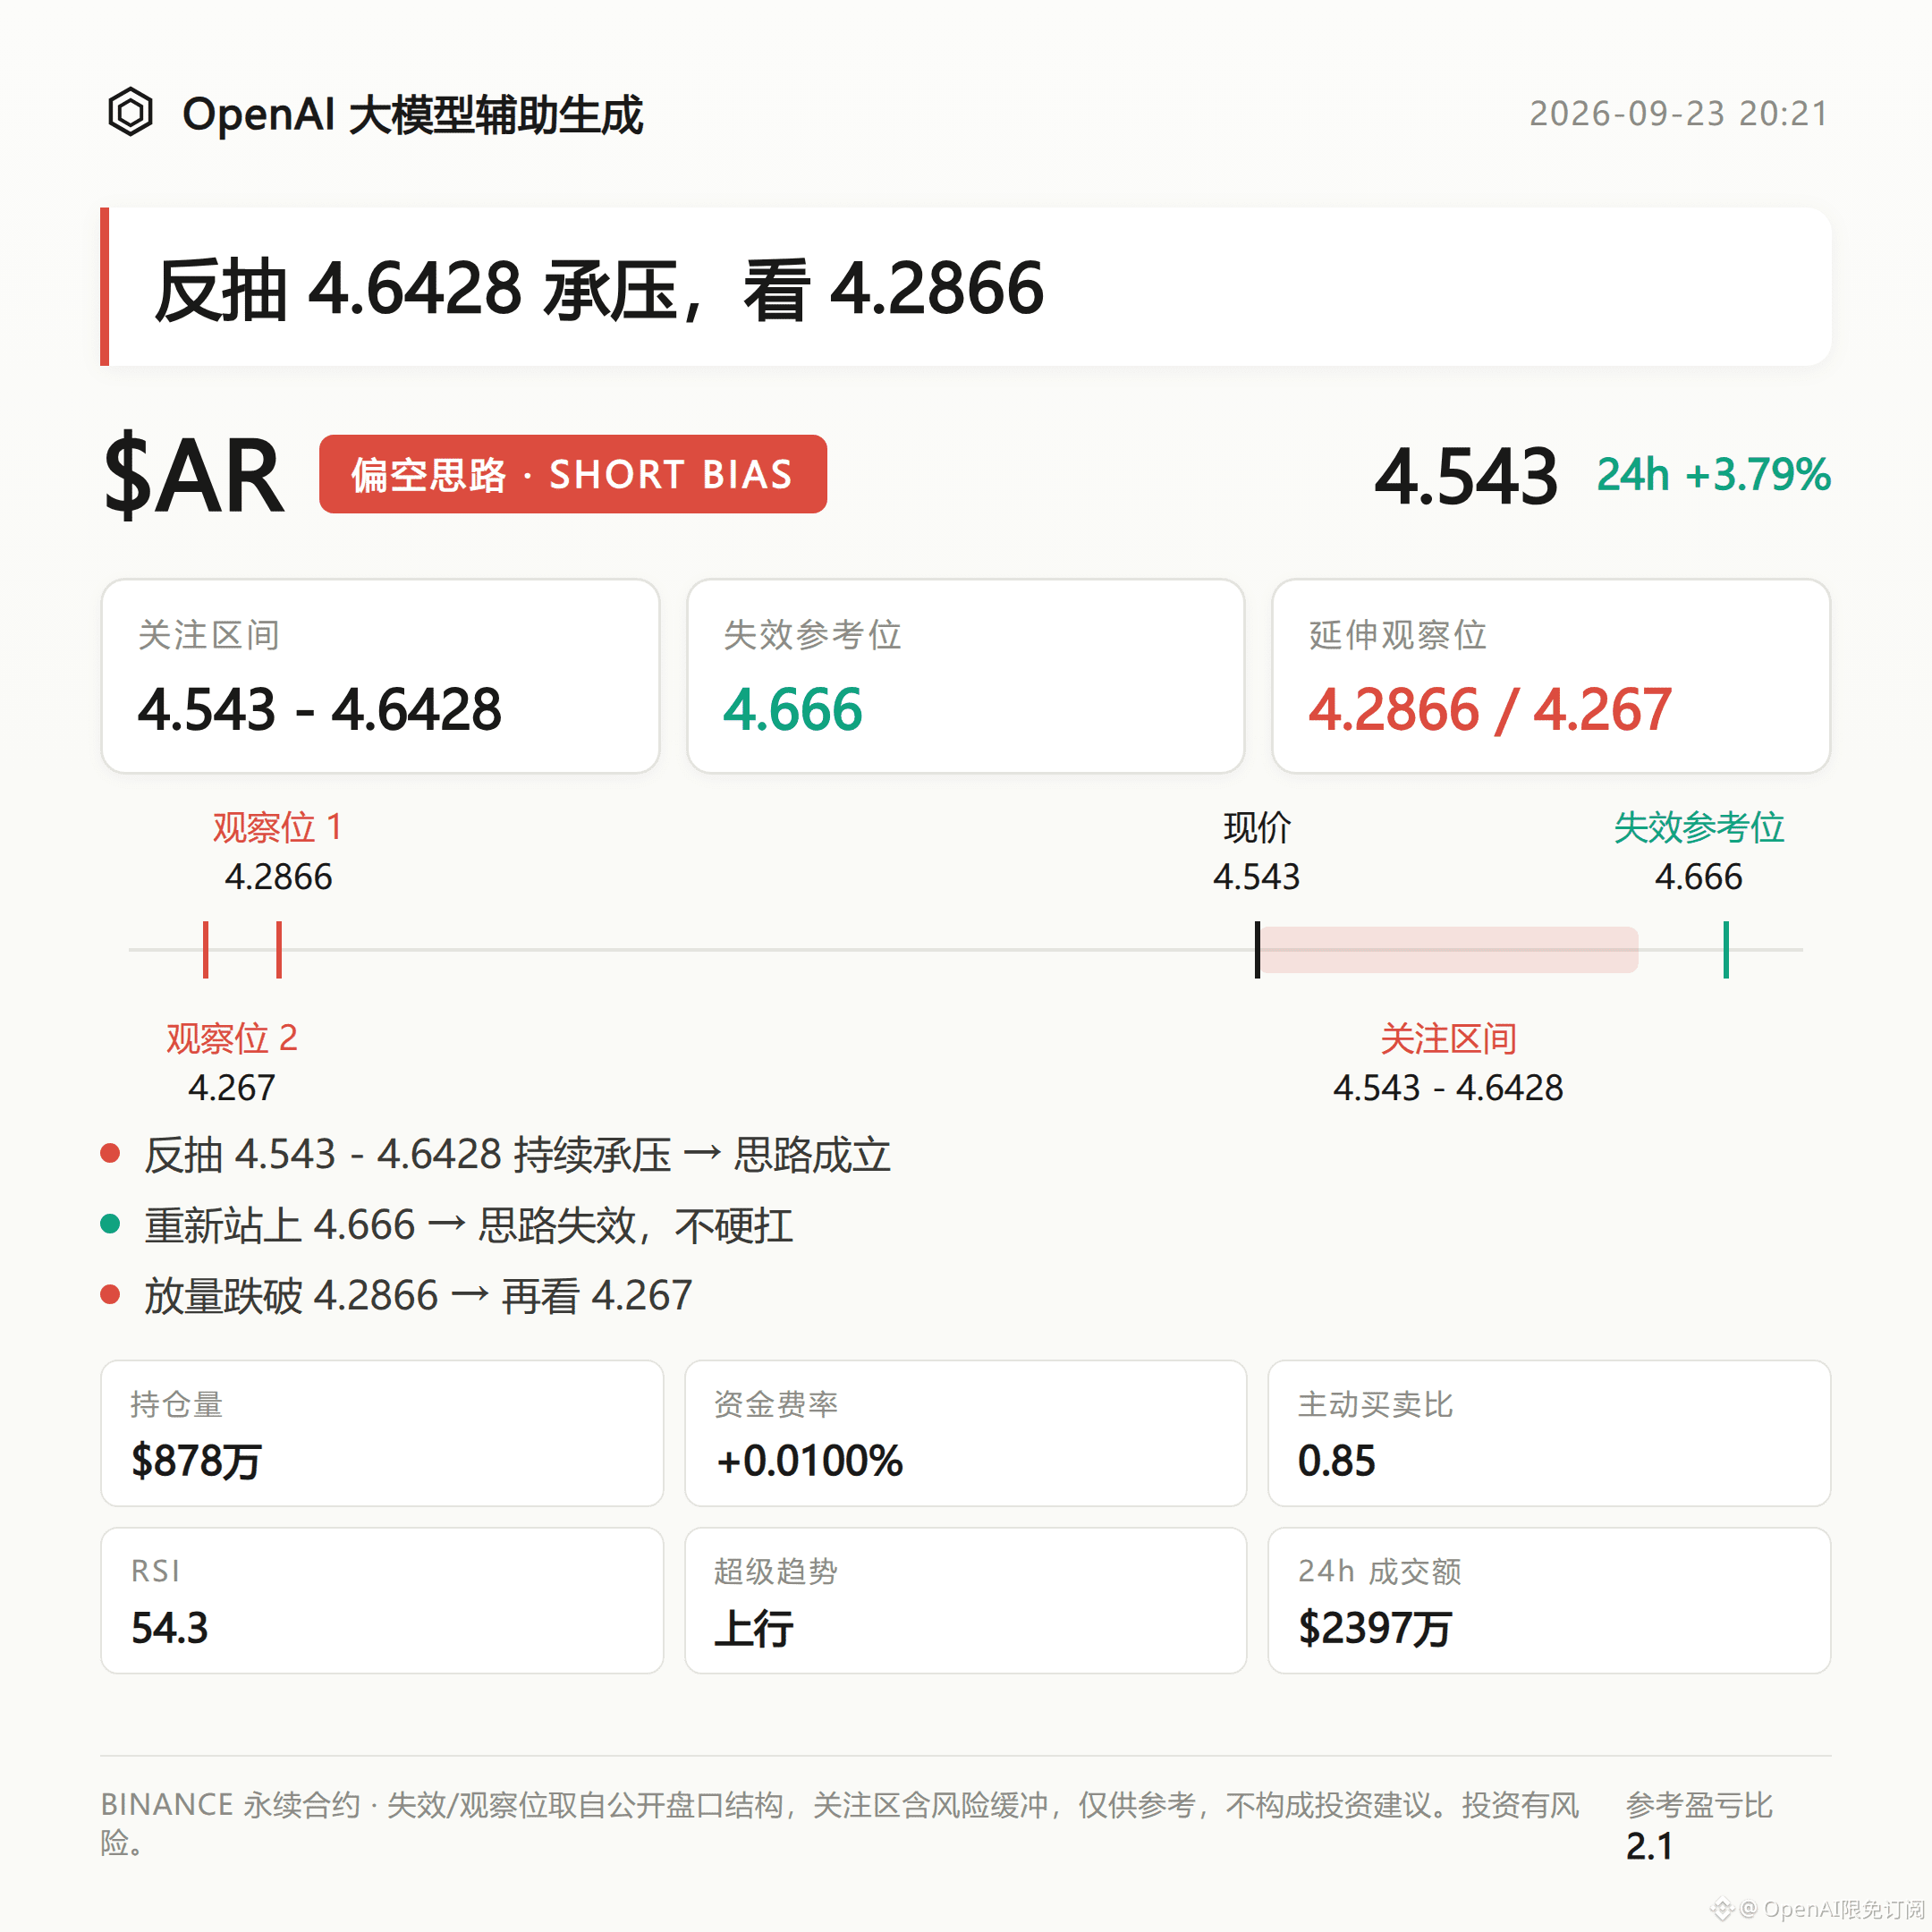
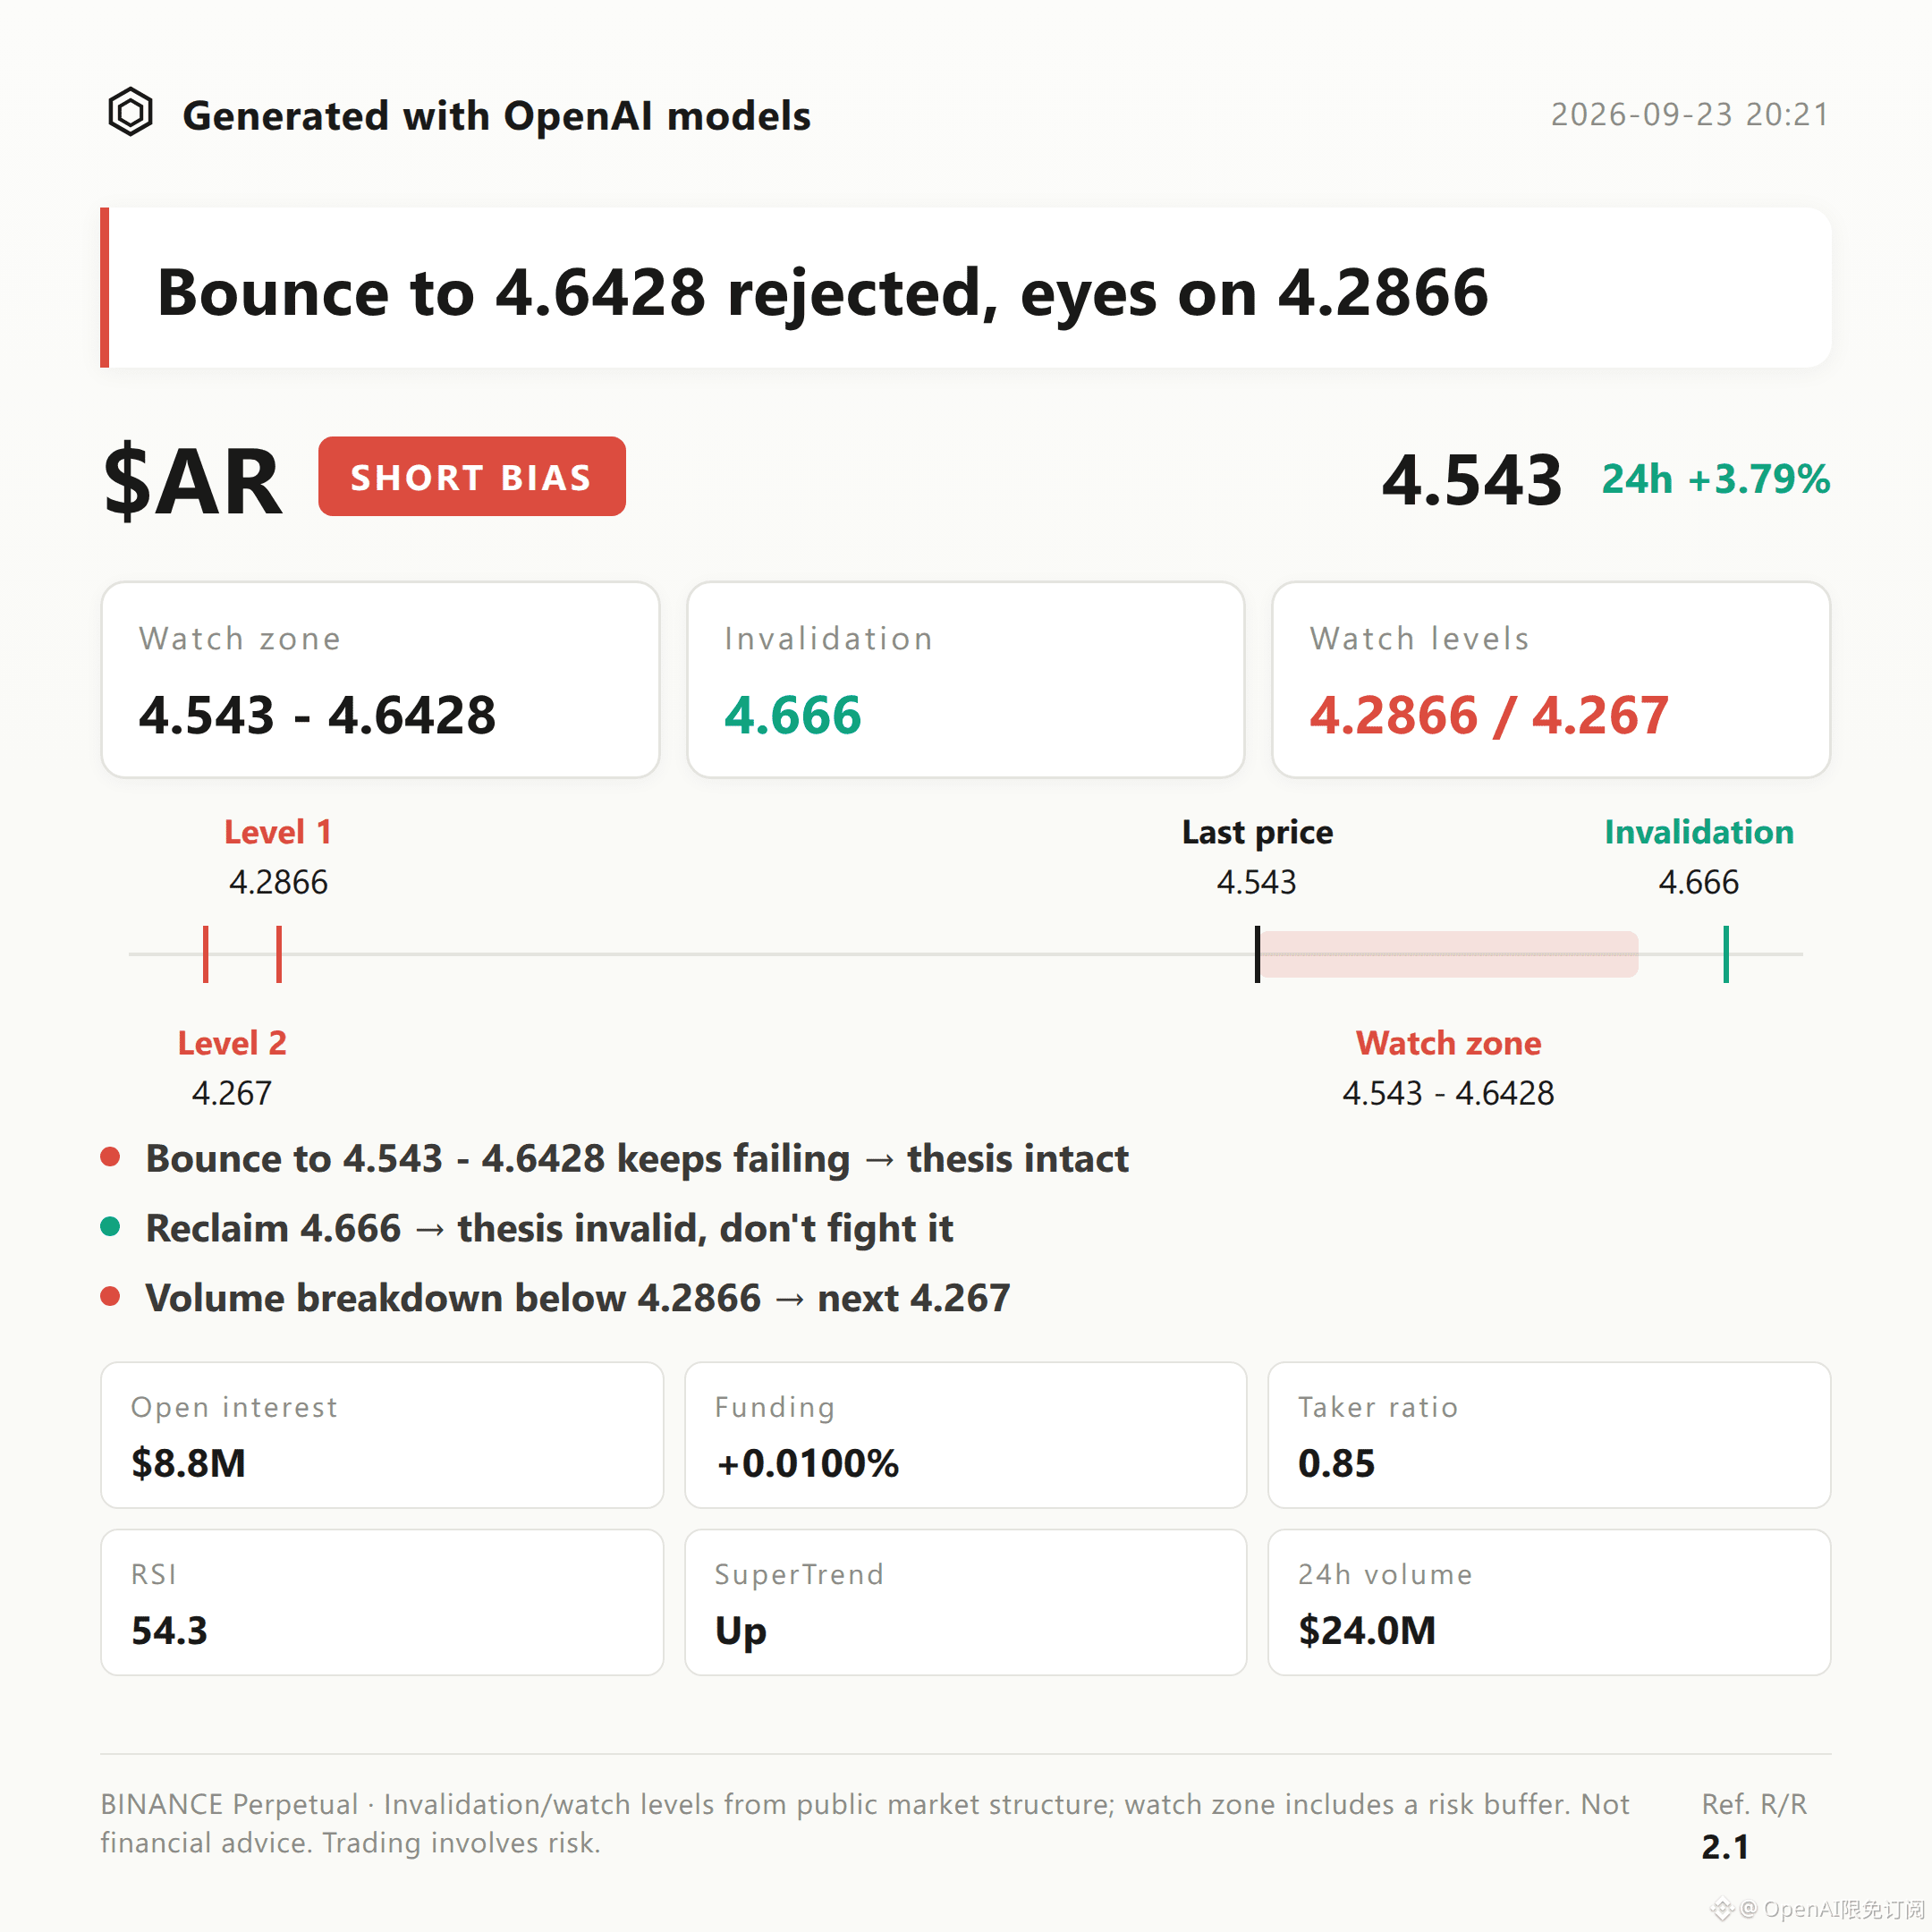
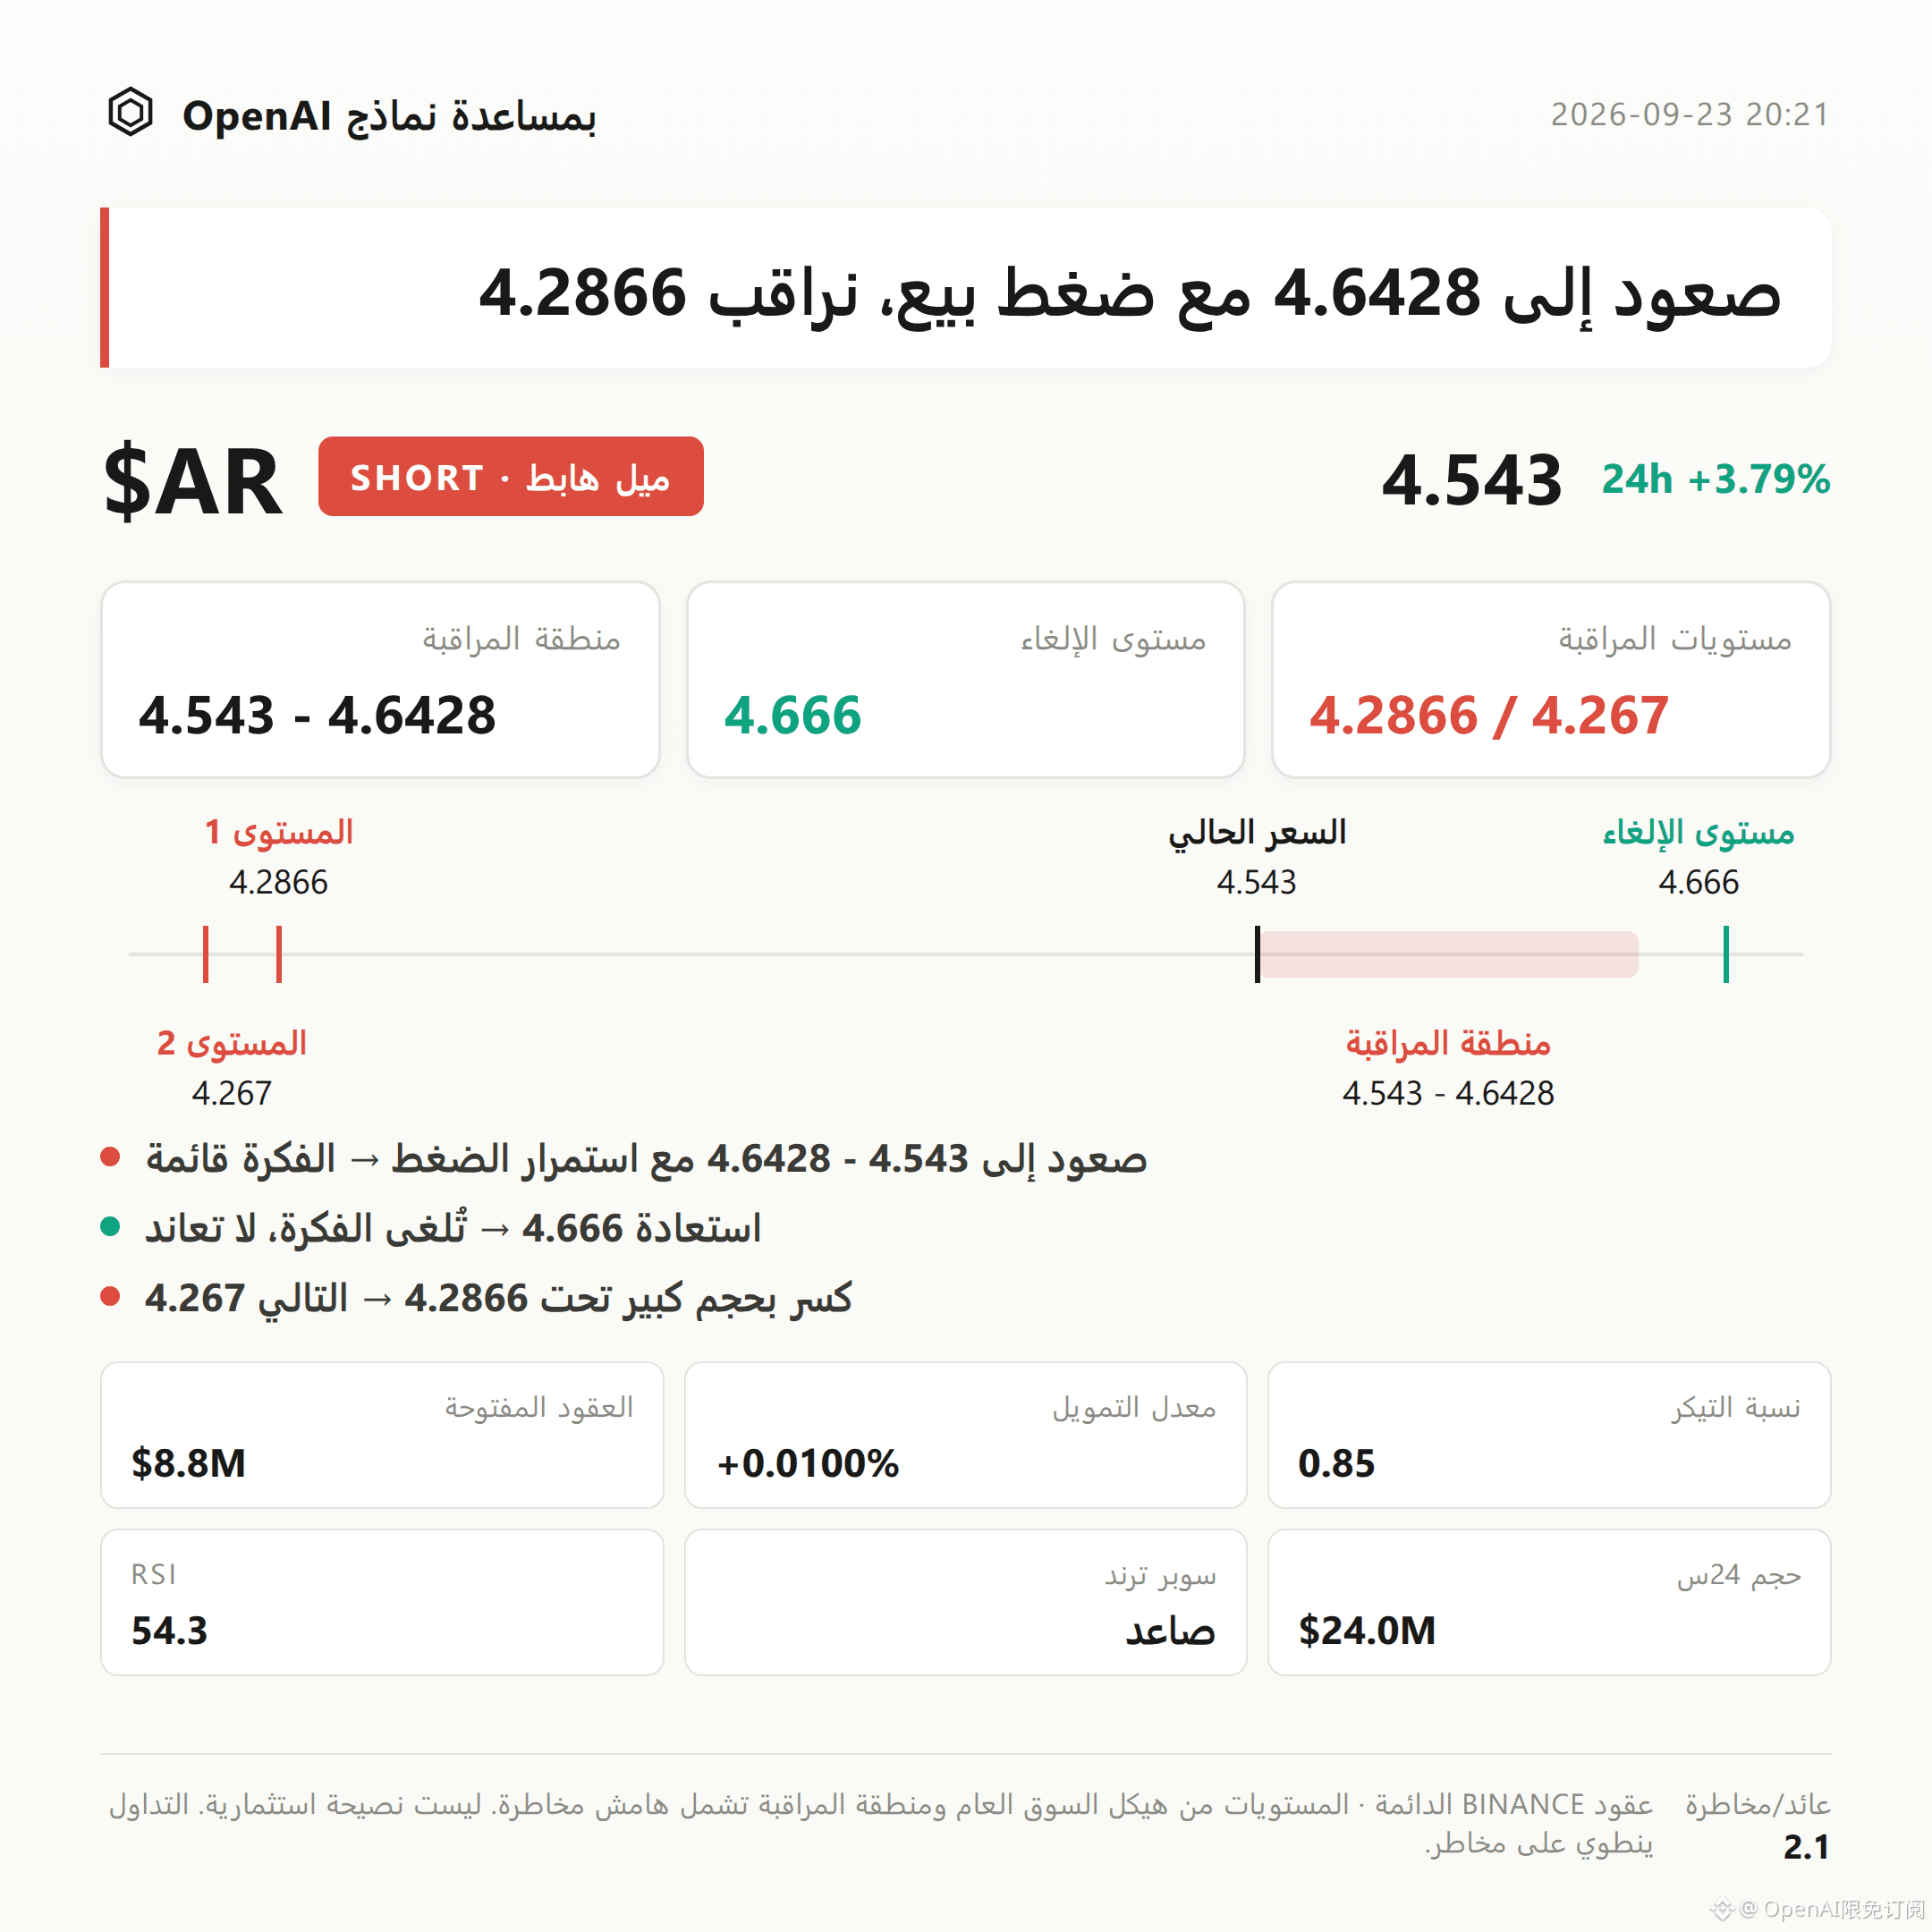
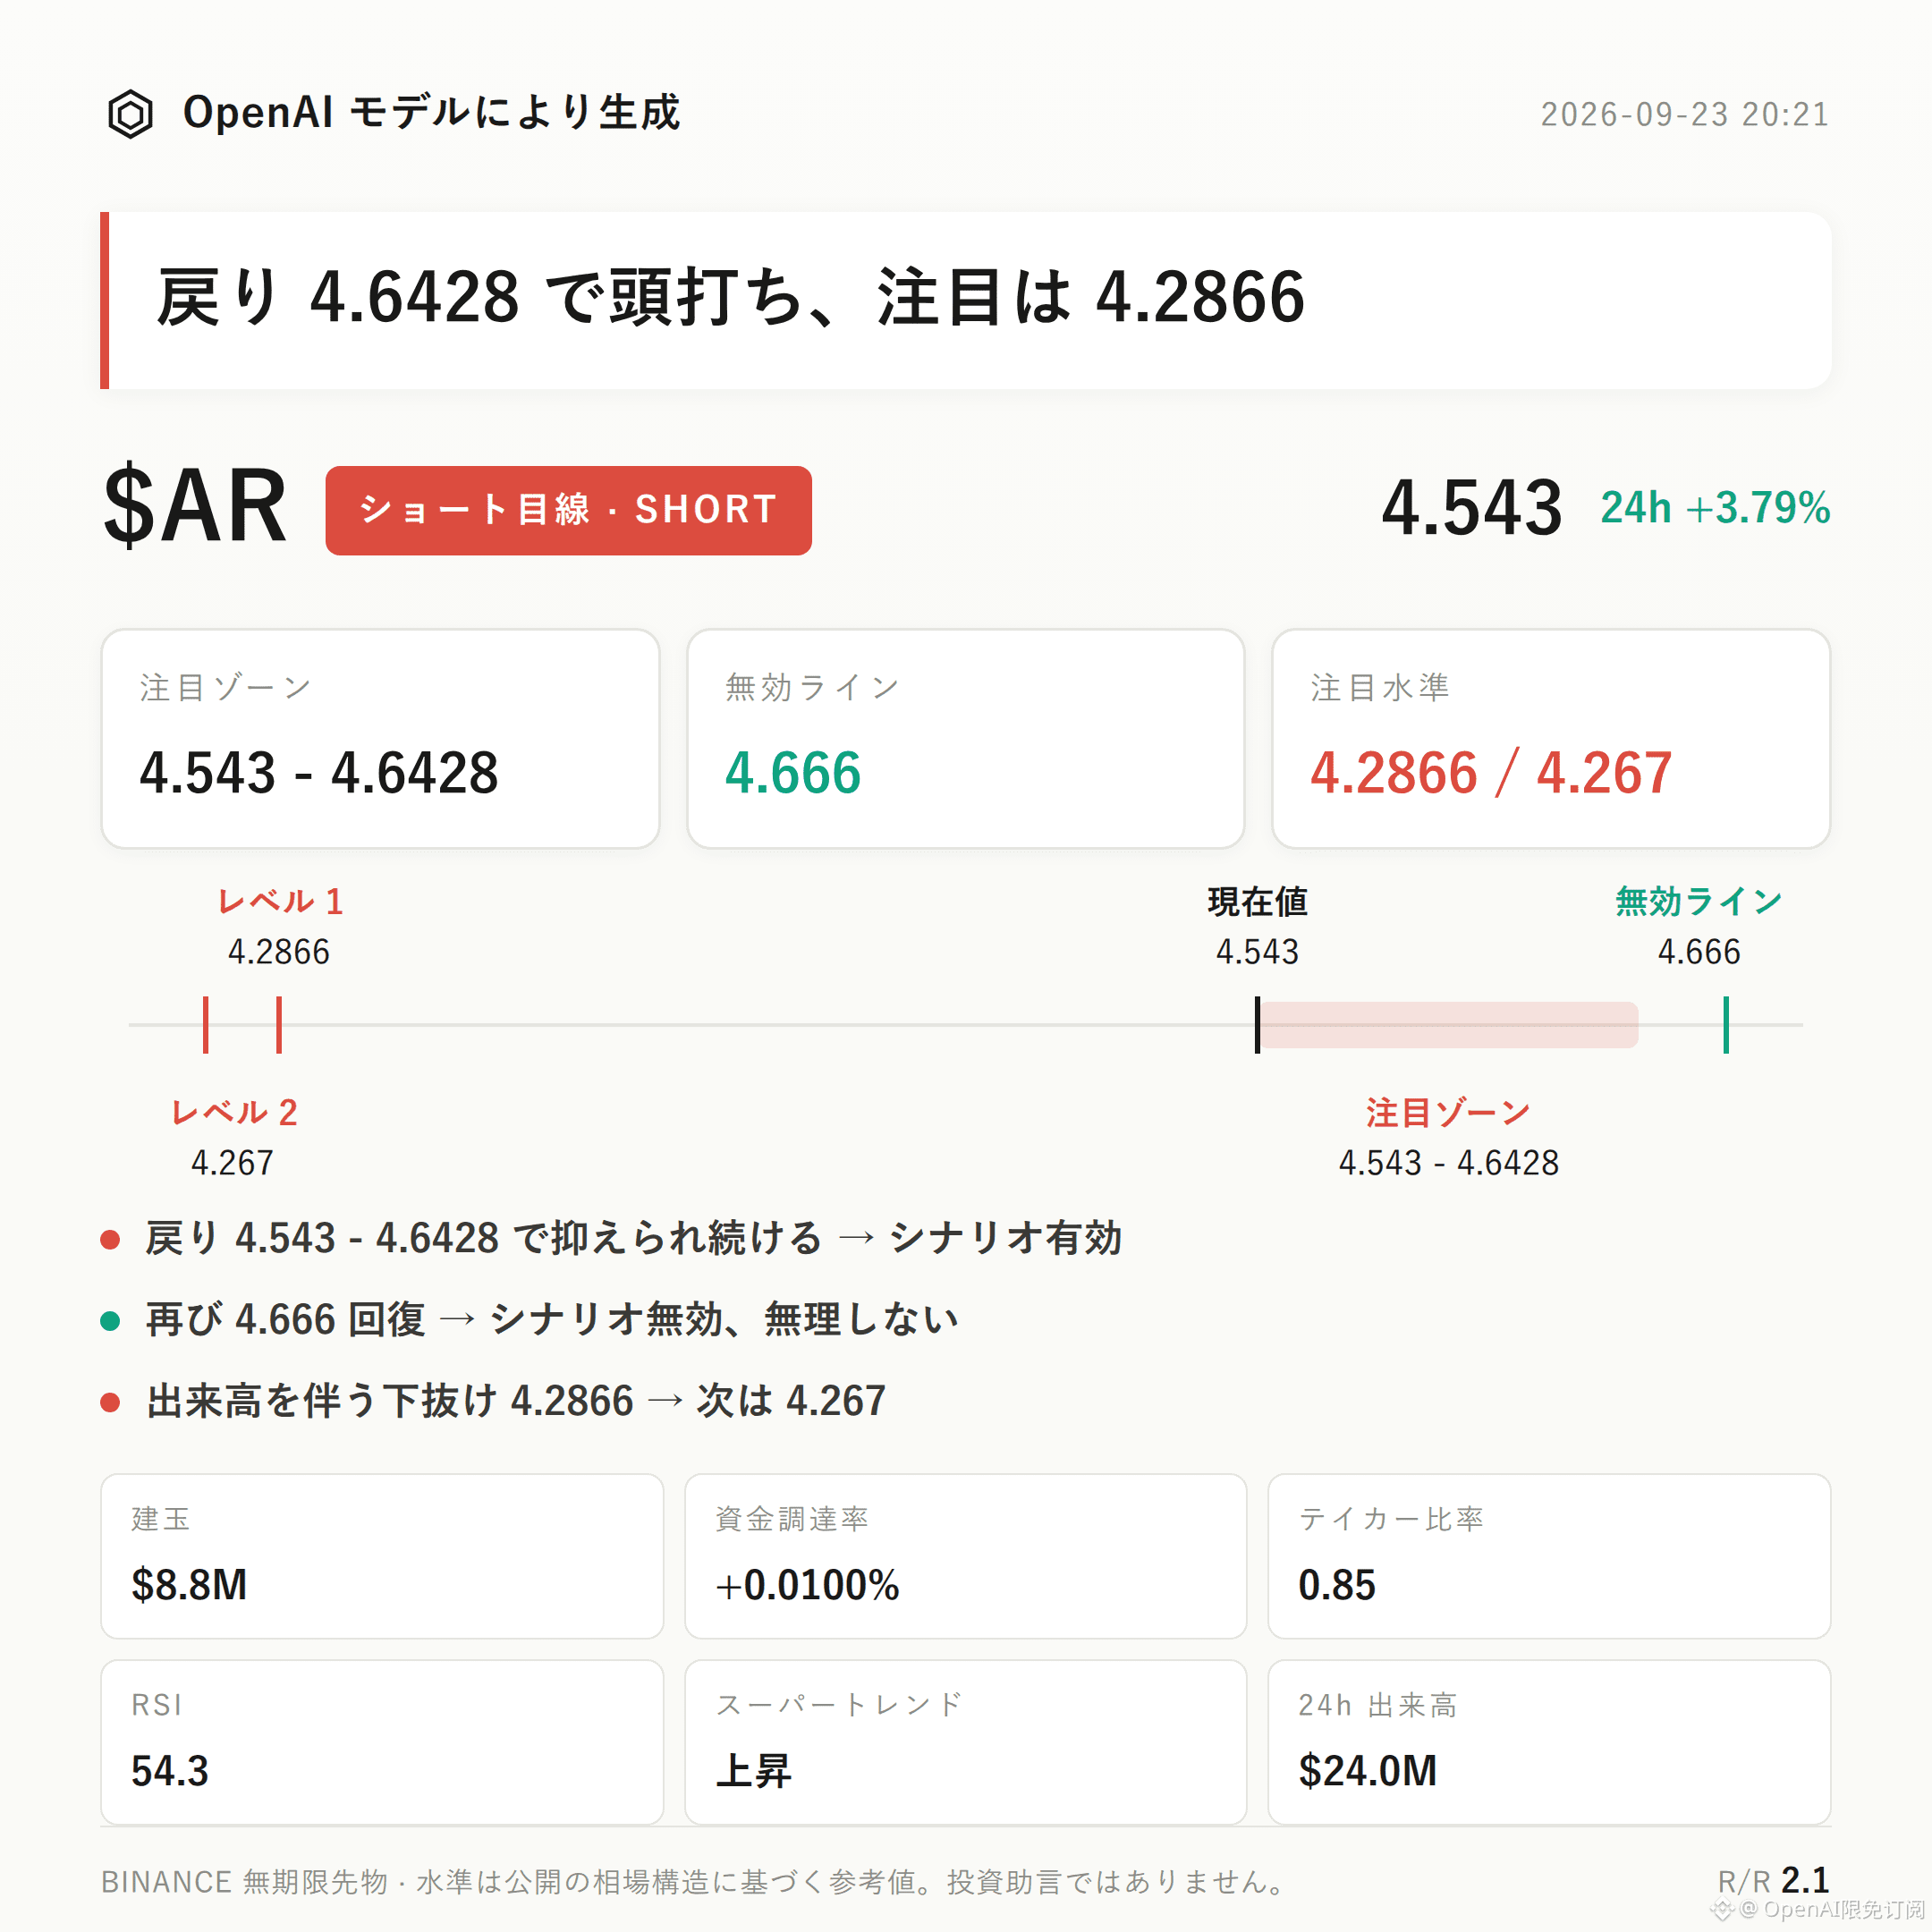
$AR is a bearish-leaning idea | Watch zone 4.543 - 4.6428 | Invalidation reference 4.666 | Observation levels 4.2866 / 4.267
$AR currently has a bearish-leaning structure in progress.
Core argument: After the current price 4.543 rose 3.79% within 24 hours, it has already approached the recent high area created by the pressure resonance between 4.666 and the Bollinger upper band at 4.6647. The buy/sell ratio of 0.85 indicates that active sell orders are relatively stronger. Meanwhile, the open interest decreased slightly by 0.3% over 24 hours, suggesting that in this upswing there is a meaningful component of profit-taking/deleveraging—not only incremental long buying driving the move.
Validation method: Focus on whether the pullback can be held down in the pressure zone 4.543-4.6428, and whether there are signs of lagging price action or long upper wicks.
From a technical structure perspective: the current price 4.543 is very close to the recent high 4.666 and also near the Bollinger upper band 4.6647. The mid band is at 4.4757, and the lower band is at 4.2866. The upside room is currently narrowing.
It’s necessary to state clearly: the Supertrend indicator is still pointing upward; MACD maintains bullish momentum; RSI is 54.3, in a neutral-to-bullish range. Trend-type indicators themselves have not provided any confirmation signal of weakening. This post’s bearish bias is based more on the pressure location and active buy/sell data rather than a divergence triggered by trend indicators.
Regarding derivatives data: the 24-hour trading volume is about $23.97 million, open interest is about $8.78 million, and the 24-hour change is -0.3%. As price moved higher, open interest fell slightly, pointing to some long-position profit-taking/deleveraging.
Funding rate is +0.0100%, which is at a low level. Long accounts account for 50%, so the long/short structure is not significantly imbalanced. The buy/sell ratio is 0.85, meaning active sell orders are relatively dominant. This is the main handle for this post’s bearish observation.
Key reference levels: On the bearish side, first look at 4.543-4.6428. It’s more suitable to wait for confirmation after the pullback under pressure, rather than making a bearish call directly from the current price.
If price retraces into this zone and shows lagging behavior or clear signs of being pressured, the bearish bias can be considered valid on a phase basis. If price rises back above 4.666, it means the current pullback structure has been broken; the bearish idea would be invalid and should not continue to be observed in this direction. If later there is a volume-backed breakdown below the lower Bollinger band at 4.2866, then reassess support performance around 4.267 as the next observation point.
It needs to be disclosed honestly: the bearish signal in this post is not strong enough. Supertrend is up; MACD bullish momentum is intact; RSI is in a neutral-to-bullish range. These trend indicators have not yet turned weak, and no clear bearish reversal signal has been triggered. The bearish judgment mainly relies on the pressure location and the active buy/sell ratio dimension, so the evidence strength is limited.
Reference risk-reward is about 2.1, for structural reference only and does not represent any actual return expectation. With contract leverage, position discipline is more important than directional judgment.
For reference only; not investment advice. Contracts have leverage, investing involves risk.
This article was generated with assistance from an OpenAI large model.
$AR #Contract analysis
$AR is a bearish-leaning idea | Watch zone 4.543 - 4.6428 | Invalidation reference 4.666 | Observation levels 4.2866 / 4.267
$AR currently has a bearish-leaning structure in progress.
Core argument: After the current price 4.543 rose 3.79% within 24 hours, it has already approached the recent high area created by the pressure resonance between 4.666 and the Bollinger upper band at 4.6647. The buy/sell ratio of 0.85 indicates that active sell orders are relatively stronger. Meanwhile, the open interest decreased slightly by 0.3% over 24 hours, suggesting that in this upswing there is a meaningful component of profit-taking/deleveraging—not only incremental long buying driving the move.
Validation method: Focus on whether the pullback can be held down in the pressure zone 4.543-4.6428, and whether there are signs of lagging price action or long upper wicks.
From a technical structure perspective: the current price 4.543 is very close to the recent high 4.666 and also near the Bollinger upper band 4.6647. The mid band is at 4.4757, and the lower band is at 4.2866. The upside room is currently narrowing.
It’s necessary to state clearly: the Supertrend indicator is still pointing upward; MACD maintains bullish momentum; RSI is 54.3, in a neutral-to-bullish range. Trend-type indicators themselves have not provided any confirmation signal of weakening. This post’s bearish bias is based more on the pressure location and active buy/sell data rather than a divergence triggered by trend indicators.
Regarding derivatives data: the 24-hour trading volume is about $23.97 million, open interest is about $8.78 million, and the 24-hour change is -0.3%. As price moved higher, open interest fell slightly, pointing to some long-position profit-taking/deleveraging.
Funding rate is +0.0100%, which is at a low level. Long accounts account for 50%, so the long/short structure is not significantly imbalanced. The buy/sell ratio is 0.85, meaning active sell orders are relatively dominant. This is the main handle for this post’s bearish observation.
Key reference levels: On the bearish side, first look at 4.543-4.6428. It’s more suitable to wait for confirmation after the pullback under pressure, rather than making a bearish call directly from the current price.
If price retraces into this zone and shows lagging behavior or clear signs of being pressured, the bearish bias can be considered valid on a phase basis. If price rises back above 4.666, it means the current pullback structure has been broken; the bearish idea would be invalid and should not continue to be observed in this direction. If later there is a volume-backed breakdown below the lower Bollinger band at 4.2866, then reassess support performance around 4.267 as the next observation point.
It needs to be disclosed honestly: the bearish signal in this post is not strong enough. Supertrend is up; MACD bullish momentum is intact; RSI is in a neutral-to-bullish range. These trend indicators have not yet turned weak, and no clear bearish reversal signal has been triggered. The bearish judgment mainly relies on the pressure location and the active buy/sell ratio dimension, so the evidence strength is limited.
Reference risk-reward is about 2.1, for structural reference only and does not represent any actual return expectation. With contract leverage, position discipline is more important than directional judgment.
For reference only; not investment advice. Contracts have leverage, investing involves risk.
This article was generated with assistance from an OpenAI large model.
$AR #Contract analysis