Multi-timeframe view of $UNI through key indicators
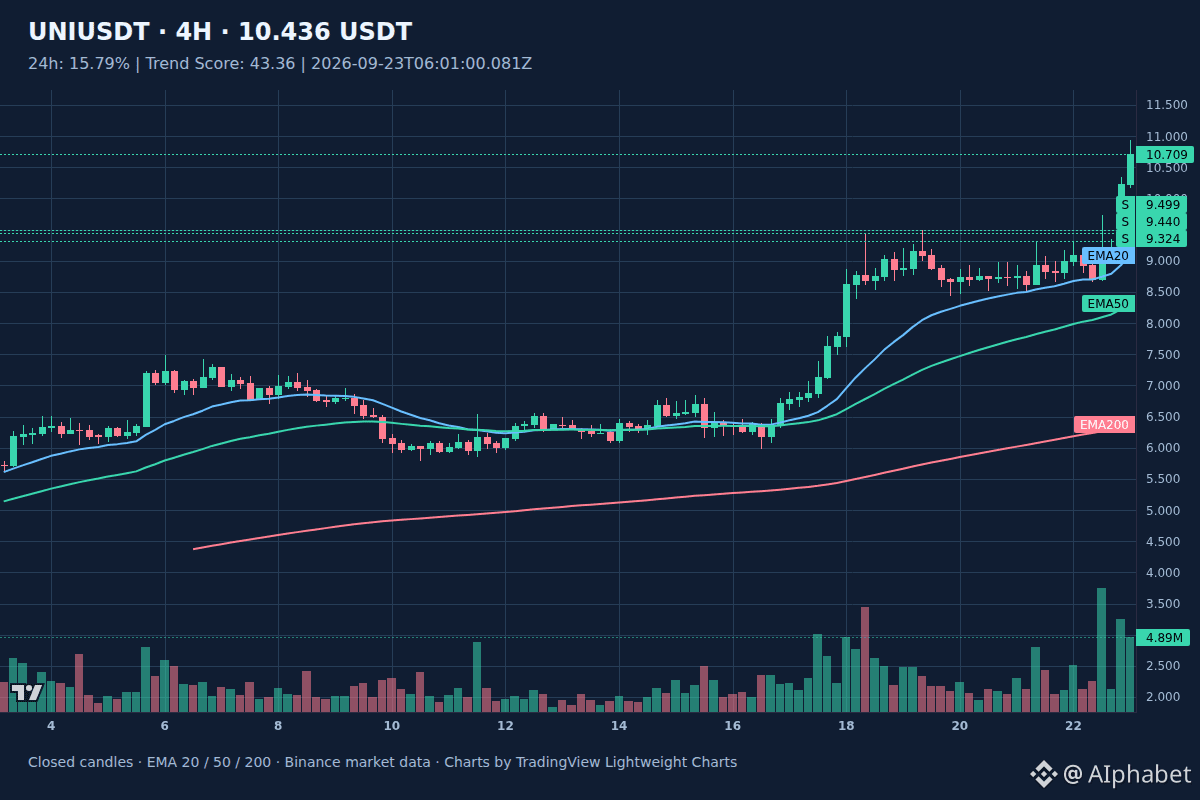
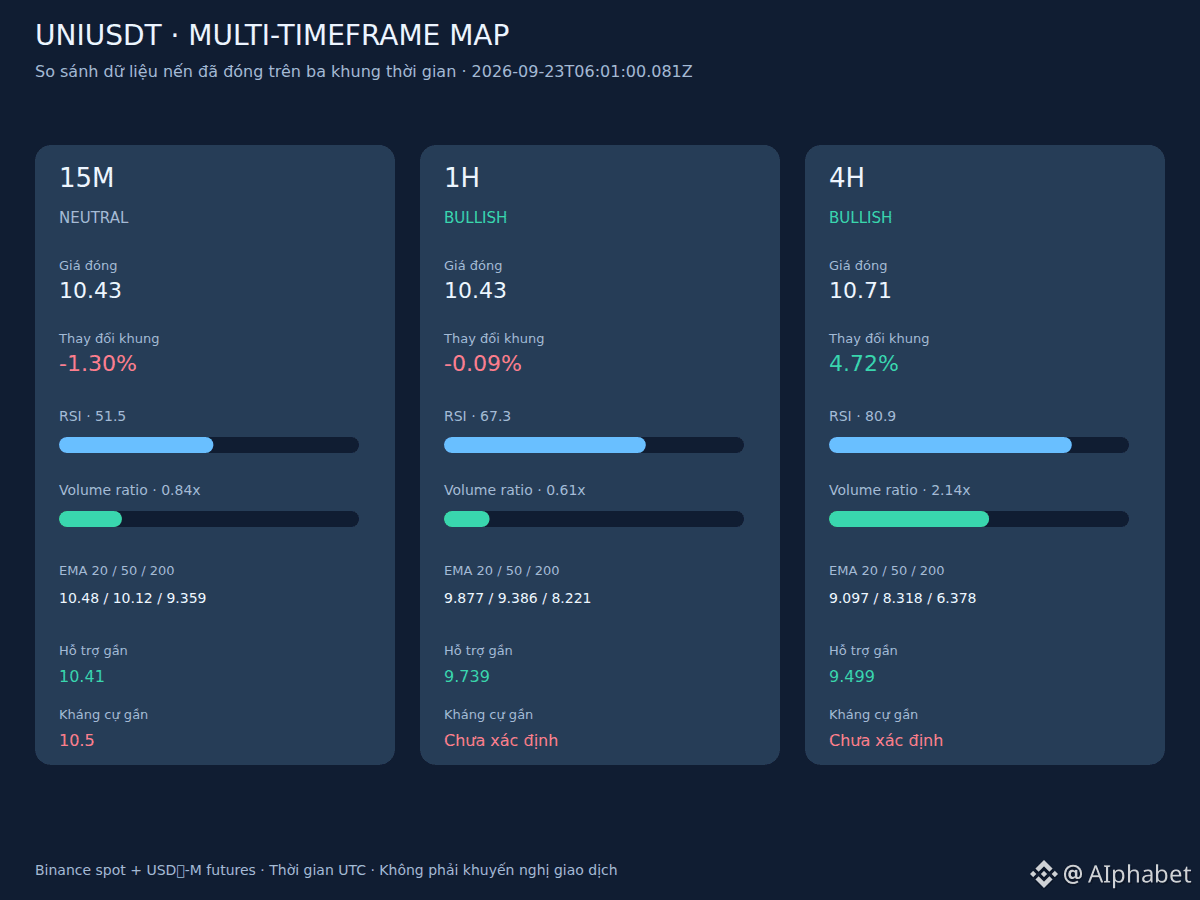
Wide view: The four-hour chart is maintaining strong bullish momentum with trading volume outperforming at 2.14x, and the RSI index touching 80.9.
Close-up: Moving to the one-hour timeframe, the price structure still keeps a positive trend as it stays above the key EMA lines, with RSI at 67.3. The two timeframes are in agreement on the dominant buying strength; however, the short-term chart is starting to show a pause, like a necessary break after a hot rally.
If buying pressure continues to hold and breaks above the resistance zone at 10.499, the price may expand its upward momentum in the short term. 🚀 Conversely, if profit-taking pressure increases and causes the price to dip below the support level of 9.739, the market may need more time for deeper consolidation.
The biggest risk right now is an unexpected pullback from the short timeframe when RSI is in the high zone. 📉
#UNI #Crypto
Wide view: The four-hour chart is maintaining strong bullish momentum with trading volume outperforming at 2.14x, and the RSI index touching 80.9.
Close-up: Moving to the one-hour timeframe, the price structure still keeps a positive trend as it stays above the key EMA lines, with RSI at 67.3. The two timeframes are in agreement on the dominant buying strength; however, the short-term chart is starting to show a pause, like a necessary break after a hot rally.
If buying pressure continues to hold and breaks above the resistance zone at 10.499, the price may expand its upward momentum in the short term. 🚀 Conversely, if profit-taking pressure increases and causes the price to dip below the support level of 9.739, the market may need more time for deeper consolidation.
The biggest risk right now is an unexpected pullback from the short timeframe when RSI is in the high zone. 📉
#UNI #Crypto