🚀 ¡ASTER INTACT CONSOLIDATION: A KEY OPPORTUNITY ON THE RADAR! ⚡
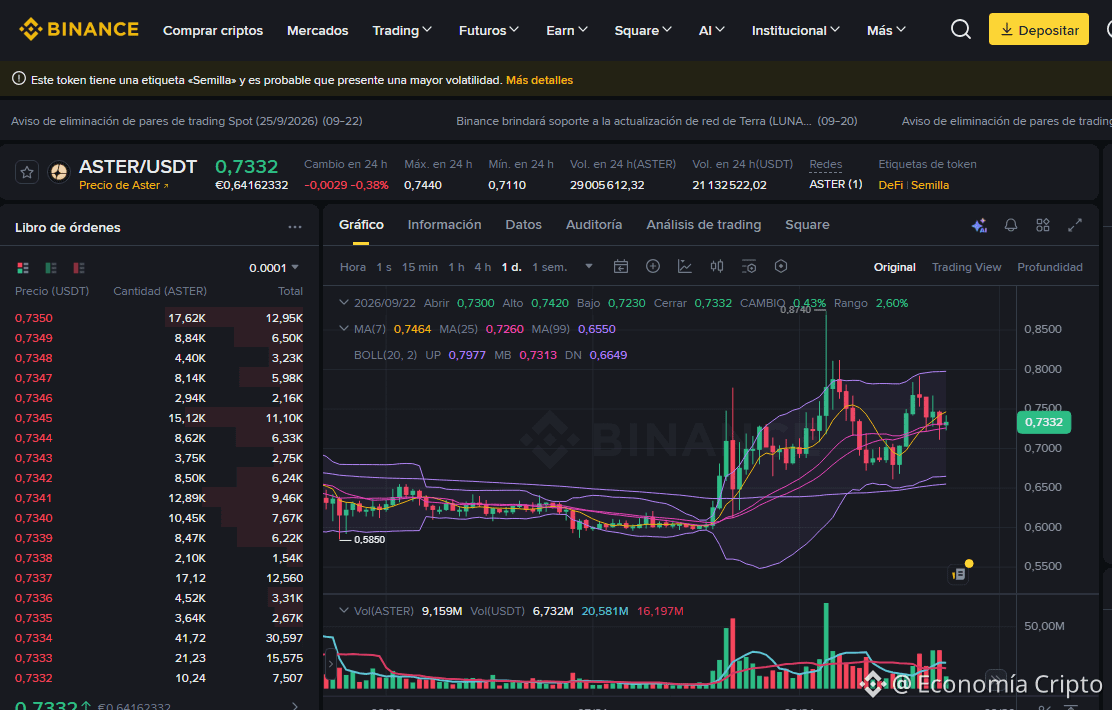
The ASTER/USDT pair is trading at 0.7332, recording a slight variation of -0.38% over the last 24 hours. The daily session shows an open at 0.7300, a high of 0.7440, a low of 0.7110, and a current level of 0.7332 (+0.43% in the daily variation). The token has DeFi and Seed labels, suggesting a behavior of high volatility.
🔍 Trend Analysis and Indicators
Trend: Bullish on the longer-term chart, with a sideways consolidation phase in the short term.
Moving Averages: Price is oscillating near the MA(7) (0.7464) and remains above the MA(25) (0.7260), while the long-term structure stays solid as it trades comfortably above the MA(99) (0.6550).
Bollinger Bands: The quotation is operating very close to the middle band MB (0.7313). The upper band is UP (0.7977) and the lower band is DN (0.6649), reflecting compression and a pause in prior volatility.
Key Levels: Immediate support is in the 0.7110 - 0.7230 area, while the main resistance to overcome is located at the 0.7440 high.
💡 Trading Strategy: Buy or Sell?
Buy (Long)?: This technical consolidation phase near the central moving average offers an attractive accumulation opportunity to position in favor of the main trend. It is suggested to manage risk with a Stop Loss set below the support.
Sell (Short)?: Trading to the downside carries a high risk due to the strong bullish underlying structure; it would only be considered in the event of a clear and sustained loss of the key supports.
#ASTER #AnalisisTecnico #CryptoTrading
The Lord blesses and prospers whoever operates here, in the name of Jesus, because your word says: "Mine is the silver, and mine is the gold, says the LORD of hosts". Hageo 2:8 RV1960-T -
$ASTER
The ASTER/USDT pair is trading at 0.7332, recording a slight variation of -0.38% over the last 24 hours. The daily session shows an open at 0.7300, a high of 0.7440, a low of 0.7110, and a current level of 0.7332 (+0.43% in the daily variation). The token has DeFi and Seed labels, suggesting a behavior of high volatility.
🔍 Trend Analysis and Indicators
Trend: Bullish on the longer-term chart, with a sideways consolidation phase in the short term.
Moving Averages: Price is oscillating near the MA(7) (0.7464) and remains above the MA(25) (0.7260), while the long-term structure stays solid as it trades comfortably above the MA(99) (0.6550).
Bollinger Bands: The quotation is operating very close to the middle band MB (0.7313). The upper band is UP (0.7977) and the lower band is DN (0.6649), reflecting compression and a pause in prior volatility.
Key Levels: Immediate support is in the 0.7110 - 0.7230 area, while the main resistance to overcome is located at the 0.7440 high.
💡 Trading Strategy: Buy or Sell?
Buy (Long)?: This technical consolidation phase near the central moving average offers an attractive accumulation opportunity to position in favor of the main trend. It is suggested to manage risk with a Stop Loss set below the support.
Sell (Short)?: Trading to the downside carries a high risk due to the strong bullish underlying structure; it would only be considered in the event of a clear and sustained loss of the key supports.
#ASTER #AnalisisTecnico #CryptoTrading
The Lord blesses and prospers whoever operates here, in the name of Jesus, because your word says: "Mine is the silver, and mine is the gold, says the LORD of hosts". Hageo 2:8 RV1960-T -
$ASTER