BTC/USDT Technical Analysis & Market Update
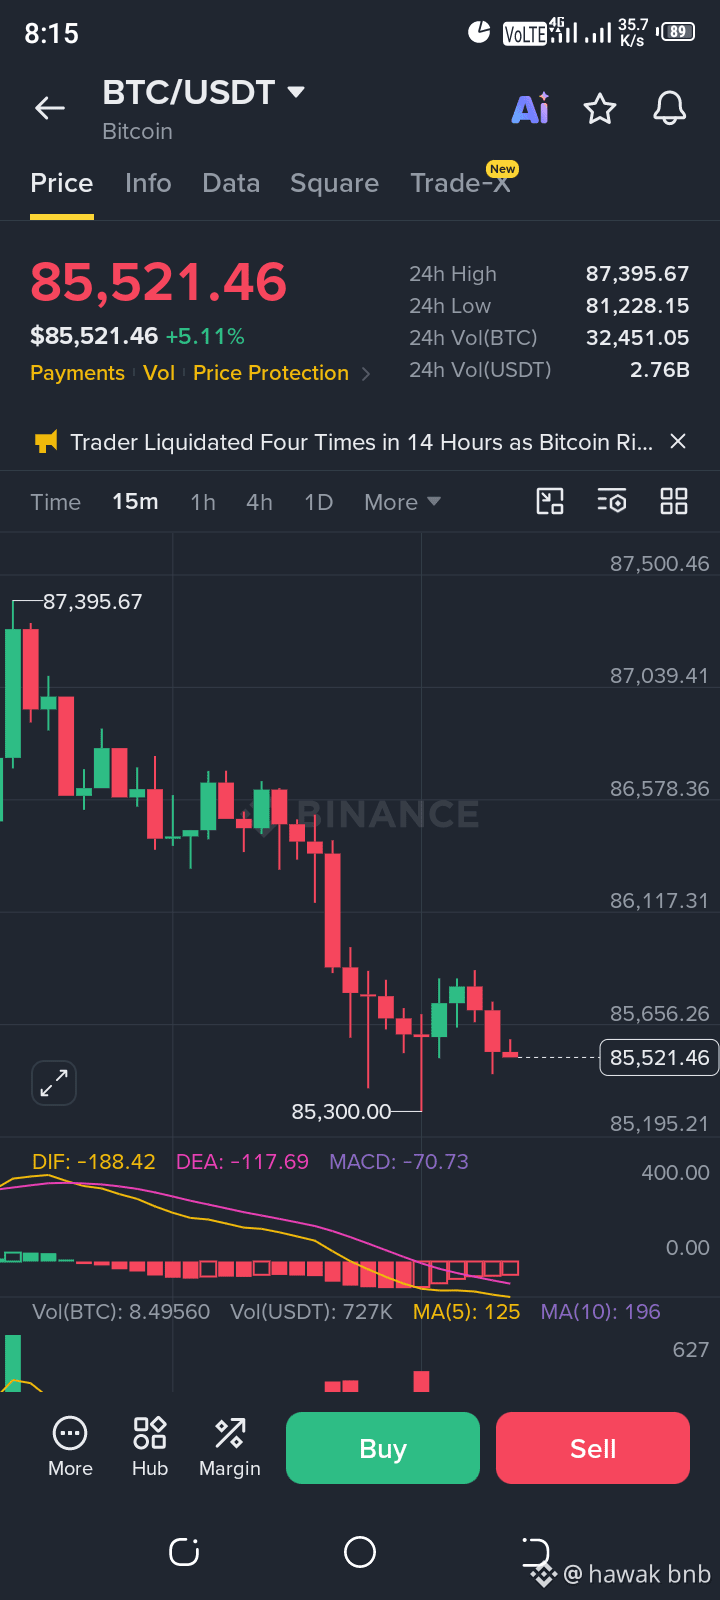
Bitcoin ($BTC ) is currently trading at $85,521.46, reflecting a +5.11% gain over the last 24 hours. However, looking at the 15-minute chart, short-term selling pressure and a pullback are clearly visible.
Key Highlights & Chart Breakdown:
24-Hour Range: Bitcoin reached a 24-hour high of $87,395.67, but experienced a continuous drop from that level, dipping down to a low of $85,300.00.
MACD Indicator: The MACD histogram and the DIF (-188.42) / DEA (-117.69) lines are currently below zero, signaling short-term bearish momentum.
Volume: Fluctuations in volume during the decline indicate intense competition between buyers and sellers.
Trading Strategy:
If Bitcoin holds the support level around $85,300, we could see a bounce back toward $86,500 and $87,000. However, if this support breaks, the price may decline further. Short-term traders should exercise caution and ensure proper use of stop-loss orders.
#Bitcoin #BTC #cryptotrading #BİNANCE $BTC
$ETH
$SOL
#TechnicalAnalysis
Bitcoin ($BTC ) is currently trading at $85,521.46, reflecting a +5.11% gain over the last 24 hours. However, looking at the 15-minute chart, short-term selling pressure and a pullback are clearly visible.
Key Highlights & Chart Breakdown:
24-Hour Range: Bitcoin reached a 24-hour high of $87,395.67, but experienced a continuous drop from that level, dipping down to a low of $85,300.00.
MACD Indicator: The MACD histogram and the DIF (-188.42) / DEA (-117.69) lines are currently below zero, signaling short-term bearish momentum.
Volume: Fluctuations in volume during the decline indicate intense competition between buyers and sellers.
Trading Strategy:
If Bitcoin holds the support level around $85,300, we could see a bounce back toward $86,500 and $87,000. However, if this support breaks, the price may decline further. Short-term traders should exercise caution and ensure proper use of stop-loss orders.
#Bitcoin #BTC #cryptotrading #BİNANCE $BTC
$ETH
$SOL
#TechnicalAnalysis