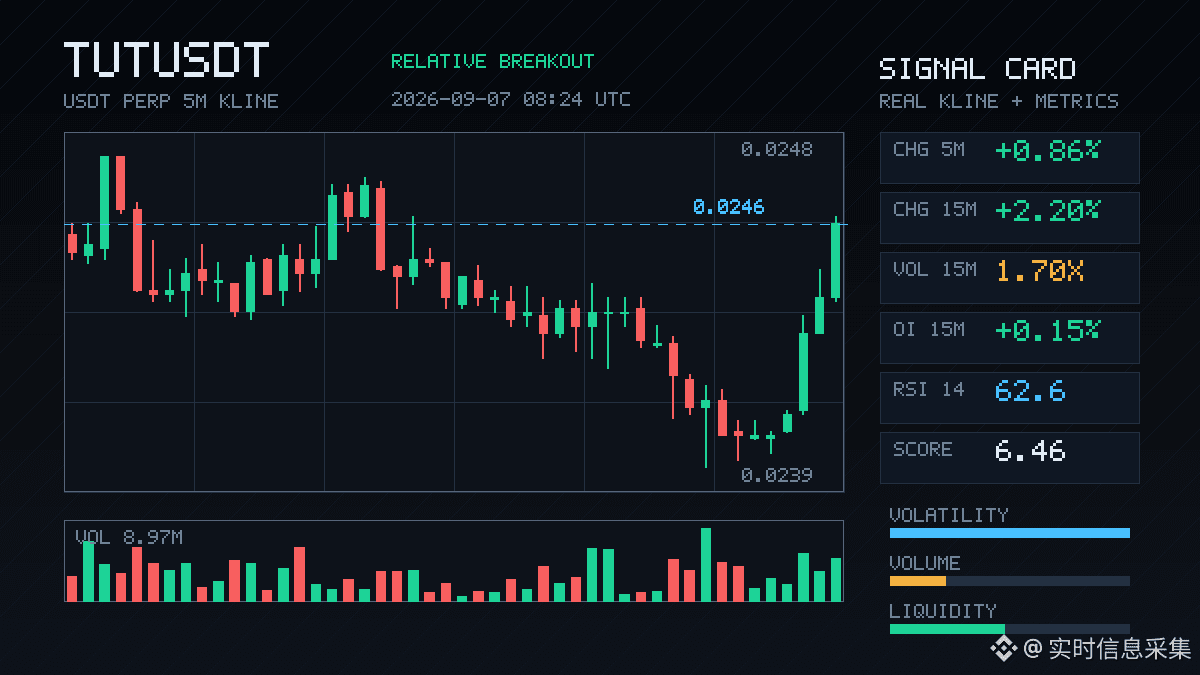
$TUT This 15-minute chart has something interesting going on. It just blasted through the upper band of nearly 20 five-minute candlesticks, with a 2.2% rise backed by 1.7x volume. This is not the kind of move that was just casually pumped.
The most direct impression is—longs are really putting money to work and entering the market. OI is pushing higher on the short cycle, with a nominal change of 2.46%, and combined with an aggressive trade imbalance of 18% and a buy/sell ratio of 1.44, this shows it is not short covering, but new leverage chasing price. The 1-hour OI pulled back a bit, but it is nothing serious; the overall stance is still bullish.
The positioning is also interesting. It was already not far from the historical extreme range, and this time it has been grinding at the boundary for several consecutive cycles without stopping. With an abnormal OI percentile of 94.4% and ranked 7th across the whole pool, a breakout driven by this kind of data resonance is worth a closer look even for short-term trading.
24-hour trading volume is only 26 million U, so the market cap is not large, but the price action is distinctive. The only thing to watch out for is—when a high-leverage product like this starts to see aggressive buying weaken, the pullback can come fast and hard. You can follow it in the short term, but do not lose your discipline. $TUT
The most direct impression is—longs are really putting money to work and entering the market. OI is pushing higher on the short cycle, with a nominal change of 2.46%, and combined with an aggressive trade imbalance of 18% and a buy/sell ratio of 1.44, this shows it is not short covering, but new leverage chasing price. The 1-hour OI pulled back a bit, but it is nothing serious; the overall stance is still bullish.
The positioning is also interesting. It was already not far from the historical extreme range, and this time it has been grinding at the boundary for several consecutive cycles without stopping. With an abnormal OI percentile of 94.4% and ranked 7th across the whole pool, a breakout driven by this kind of data resonance is worth a closer look even for short-term trading.
24-hour trading volume is only 26 million U, so the market cap is not large, but the price action is distinctive. The only thing to watch out for is—when a high-leverage product like this starts to see aggressive buying weaken, the pullback can come fast and hard. You can follow it in the short term, but do not lose your discipline. $TUT