🪙 $BTC Tightening Range: Accumulation Before the Next Breakout? 🚀
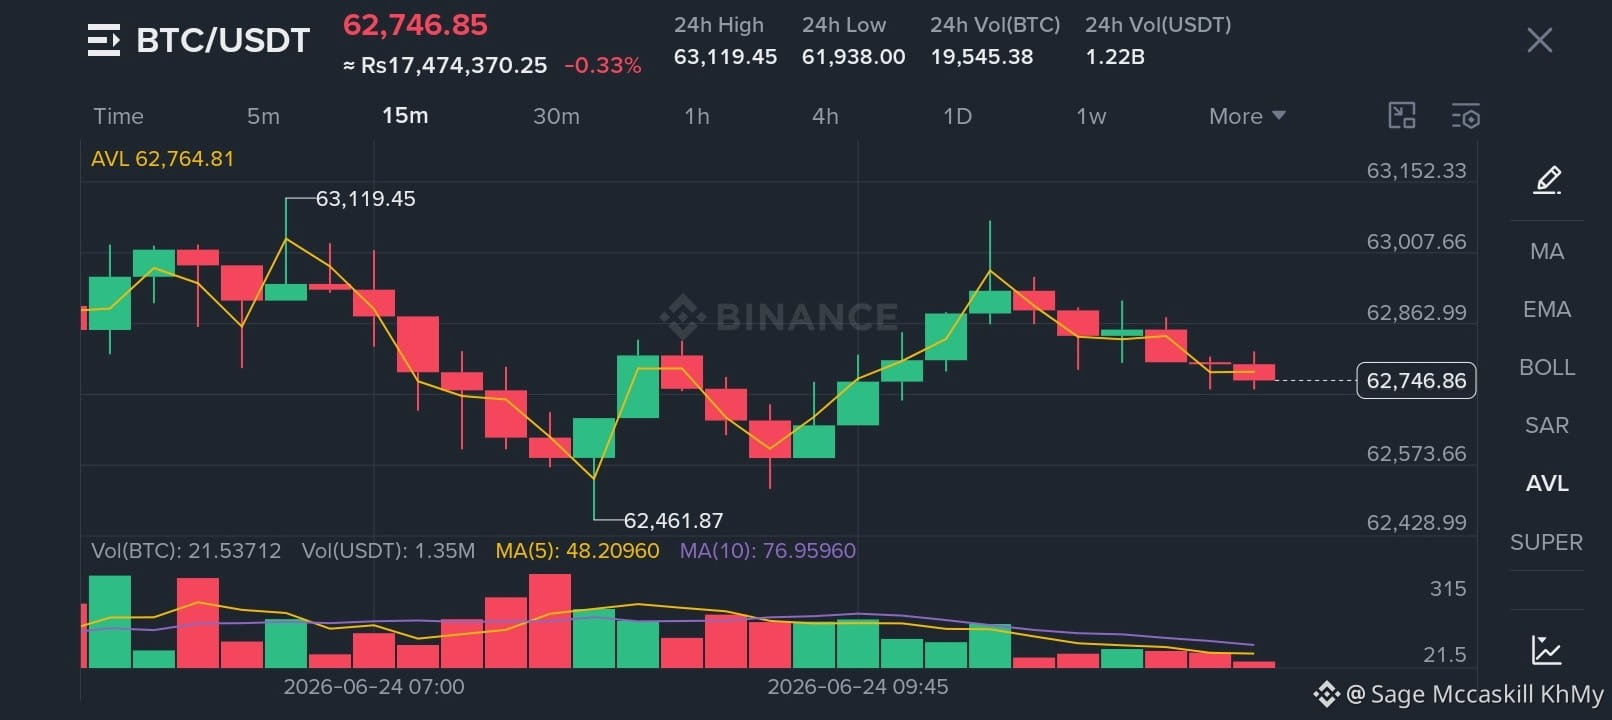
$BTC (BTC/USDT) is flashing a classic consolidation pattern on the 15-minute chart, currently trading at 62,746.85 with a minor 24-hour dip of -0.33%. 📉🔄
After defending the local support near 62,461.87 and testing an intraday high of 63,119.45, the price is compressing into a tight sideways range. This calm behavior usually indicates that both buyers and sellers are gearing up for a significant liquidity move. 🎯📊
If bulls can flip the 63k resistance into solid support, we might see a fast push back to recent highs. Otherwise, a retest of the lower boundary is likely. 🛡️
👉 Is this a local bottom for Bitcoin, or are we heading for one more shakeout? Drop your predictions below! 👇
#Bitcoin #BTC #CryptoTrading. #TechnicalAnalysiss #BinanceSquareBTC
$BTC (BTC/USDT) is flashing a classic consolidation pattern on the 15-minute chart, currently trading at 62,746.85 with a minor 24-hour dip of -0.33%. 📉🔄
After defending the local support near 62,461.87 and testing an intraday high of 63,119.45, the price is compressing into a tight sideways range. This calm behavior usually indicates that both buyers and sellers are gearing up for a significant liquidity move. 🎯📊
If bulls can flip the 63k resistance into solid support, we might see a fast push back to recent highs. Otherwise, a retest of the lower boundary is likely. 🛡️
👉 Is this a local bottom for Bitcoin, or are we heading for one more shakeout? Drop your predictions below! 👇
#Bitcoin #BTC #CryptoTrading. #TechnicalAnalysiss #BinanceSquareBTC