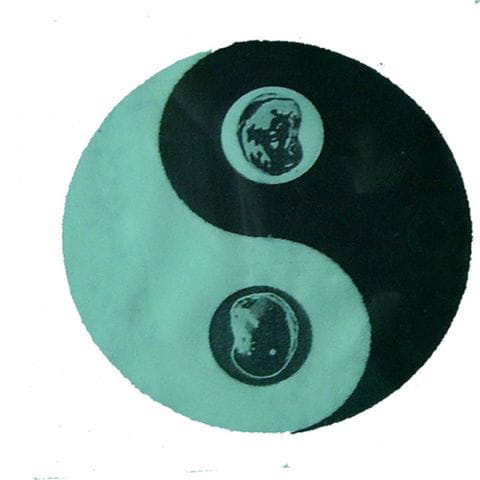
I don’t understand K-line technology. I bought a book called Japanese Candlestick Chart Techniques. I flipped through a few pages without bothering to study it. The essence of K-line fluctuations is the fluctuation of funds. How funds want to draw a chart, within a certain chip and range. You can do whatever you want, but there is a certain "Tao" based on cycles, emotions, and chip ranges.
Speculation or speculation essentially has a set of game theory. For retail investors and major players, when the emotional cycle is low, you have to endure it silently. When the investment cycle is high, you have to stay awake at all times.
Of course, this degree must be grasped well. Circle b uses 10x as a degree, which is a good dividing line.
In circle B, with 100,000 as the principal, theoretically only 3 10x are needed to achieve 100 million.
Speculation or speculation essentially has a set of game theory. For retail investors and major players, when the emotional cycle is low, you have to endure it silently. When the investment cycle is high, you have to stay awake at all times.
Of course, this degree must be grasped well. Circle b uses 10x as a degree, which is a good dividing line.
In circle B, with 100,000 as the principal, theoretically only 3 10x are needed to achieve 100 million.