[What’s next for the market]
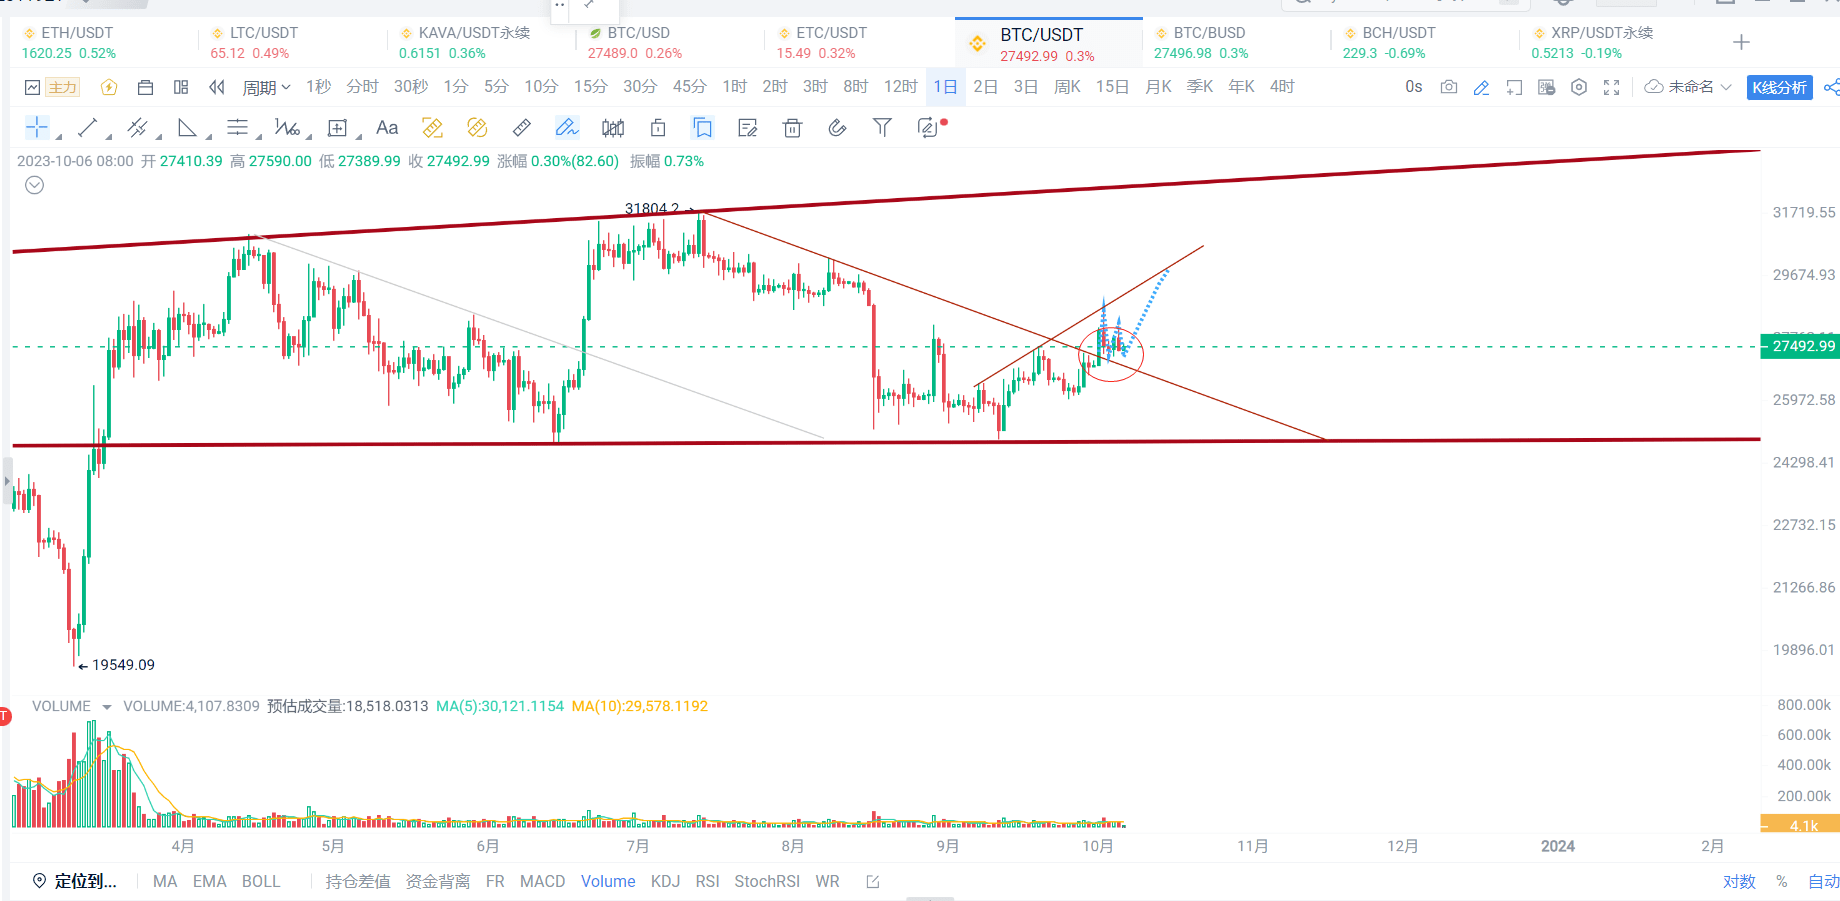
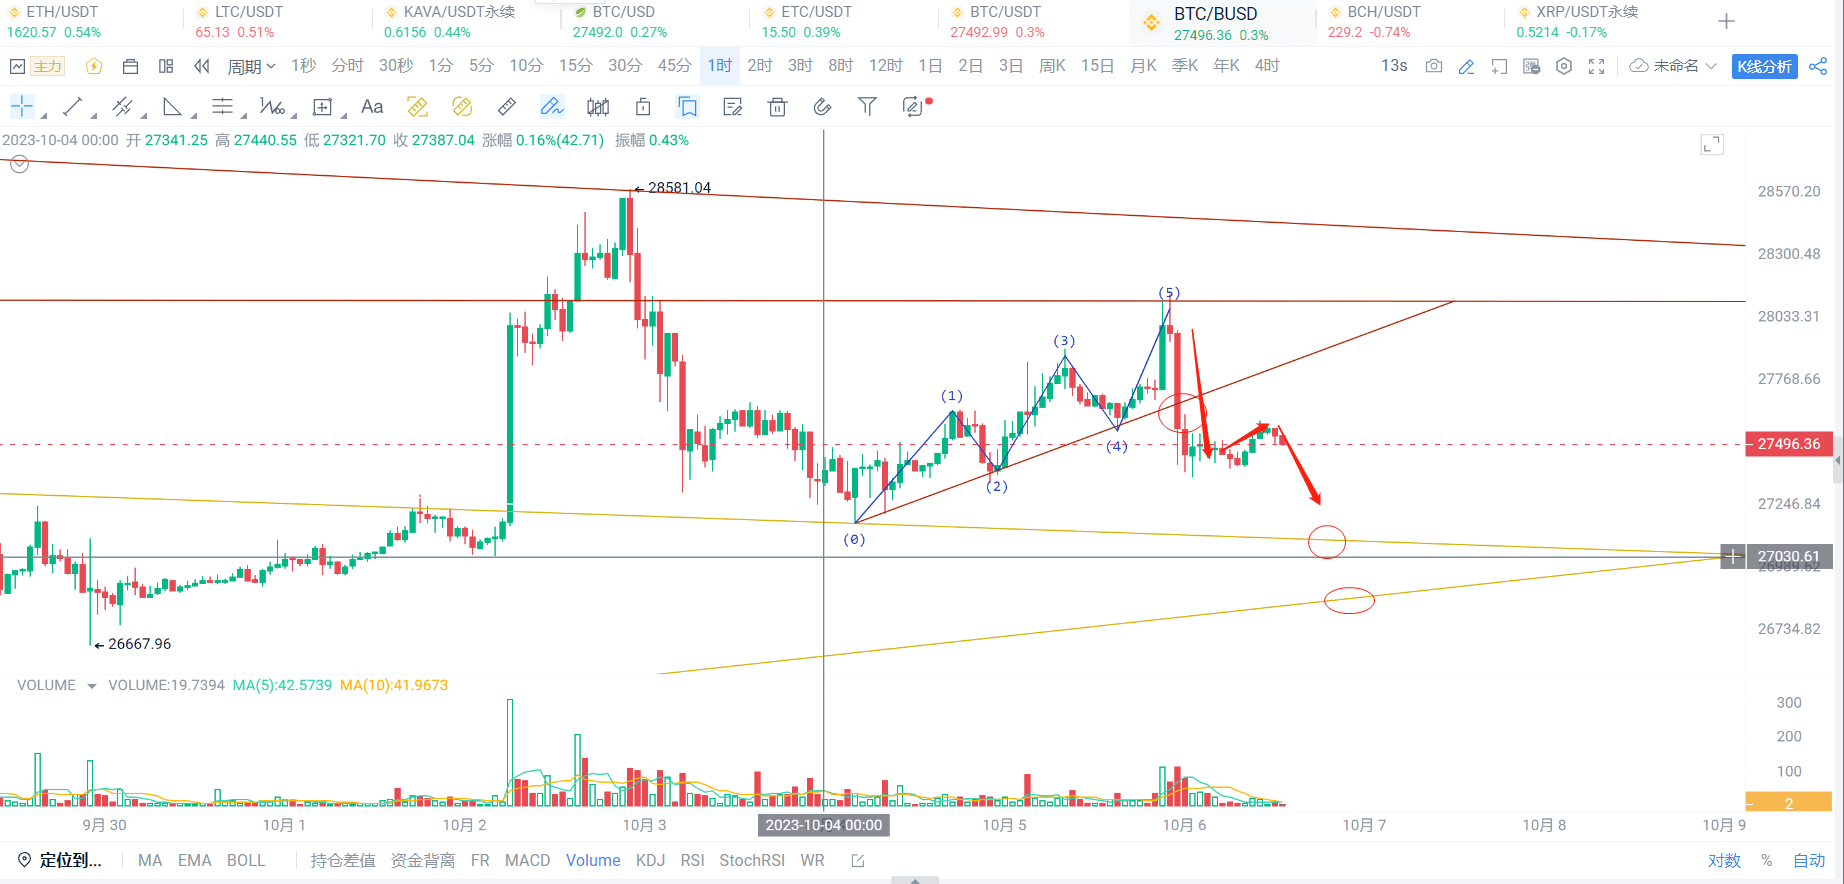
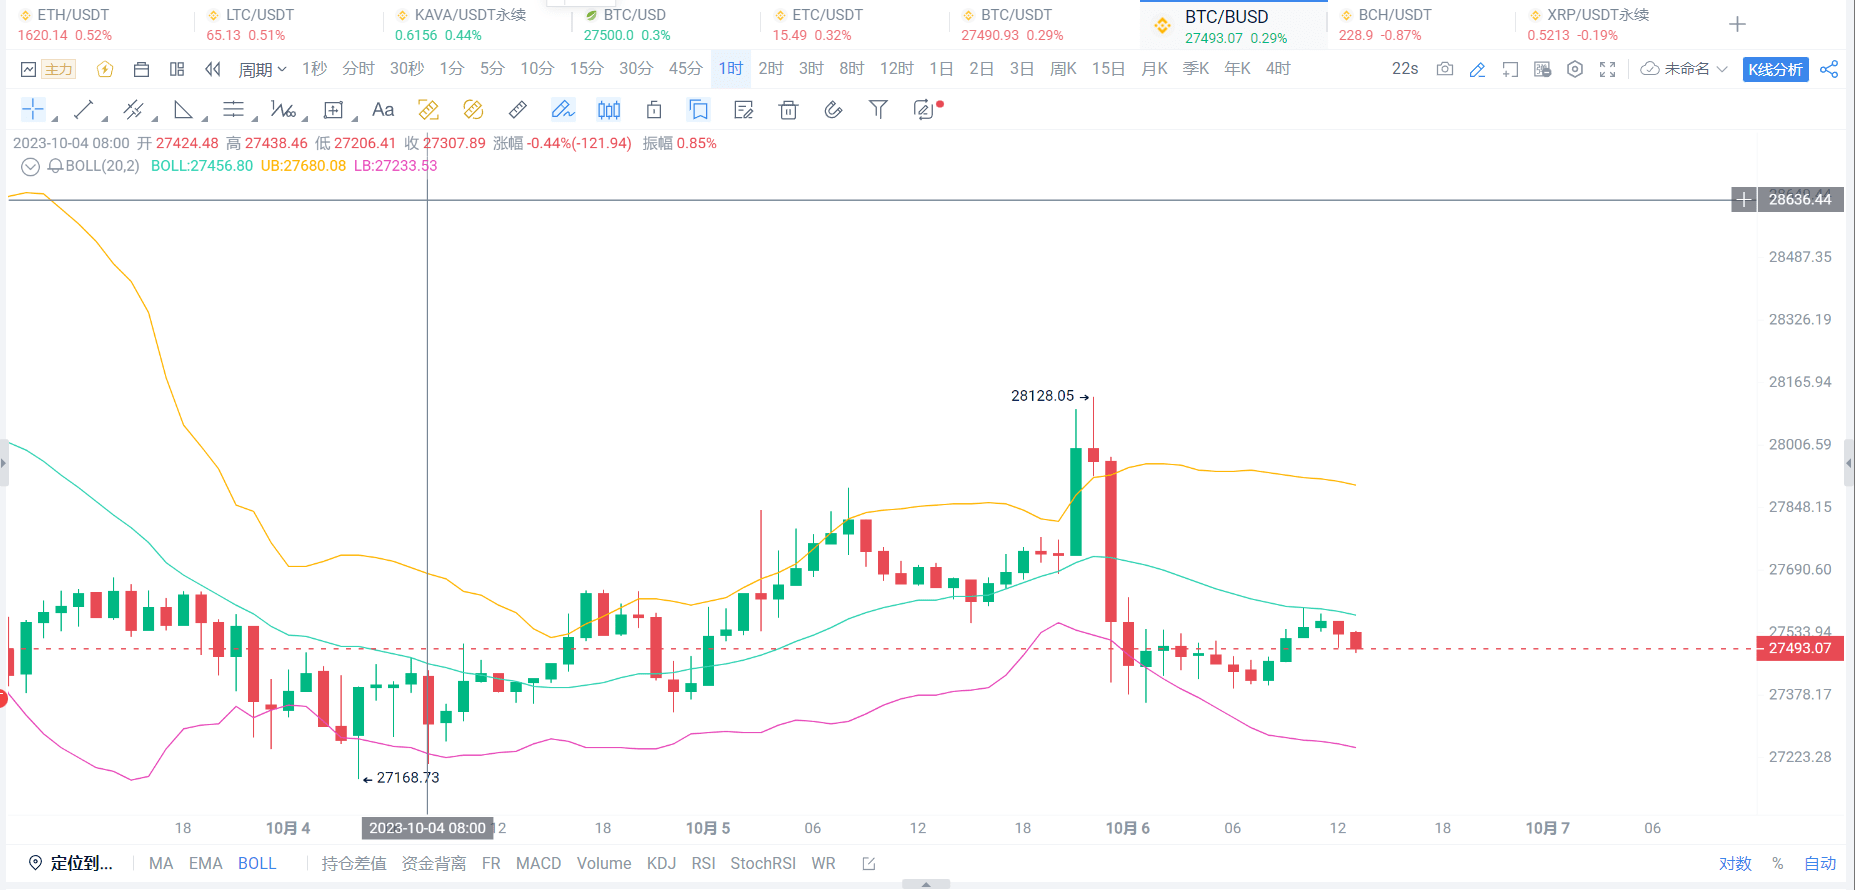
Today's market analysis: Figure 1 - We can see that on the daily line, it took almost 3 months for the market to strongly break through the red resistance trend line on October 1. Therefore, after this line breaks through, the resistance becomes stronger and the support will not It is easy to fall below this line again. Friends who are paying attention also know that after the breakthrough reached more than 28,000, we also posted that we would probably step back, take profit and exit, and wait for 27,000-27,300 before entering again. The result was as we thought, and then we had another wave of hourly levels yesterday. After the fifth wave rose, it was also the highest point near 28100. Take profit and wait and see. Then we will continue the previous strategy and go long at 27000_27300. As shown in Figure 2 - hourly line, we can see that the market will still go back to the lower trend line again. Combined with Figure 3 - Bollinger Bands middle track resistance, there is a high probability that the market will go down to the lower track and then rebound.
Therefore, the operation suggestion is: 27000-27300, continue to buy, and stop loss at 26750.
(Recognized partners, remember to follow and like 🫰)
#BTC #ETH #一起来跟单 #带你看看币安Launchpad #注意资金安全
Today's market analysis: Figure 1 - We can see that on the daily line, it took almost 3 months for the market to strongly break through the red resistance trend line on October 1. Therefore, after this line breaks through, the resistance becomes stronger and the support will not It is easy to fall below this line again. Friends who are paying attention also know that after the breakthrough reached more than 28,000, we also posted that we would probably step back, take profit and exit, and wait for 27,000-27,300 before entering again. The result was as we thought, and then we had another wave of hourly levels yesterday. After the fifth wave rose, it was also the highest point near 28100. Take profit and wait and see. Then we will continue the previous strategy and go long at 27000_27300. As shown in Figure 2 - hourly line, we can see that the market will still go back to the lower trend line again. Combined with Figure 3 - Bollinger Bands middle track resistance, there is a high probability that the market will go down to the lower track and then rebound.
Therefore, the operation suggestion is: 27000-27300, continue to buy, and stop loss at 26750.
(Recognized partners, remember to follow and like 🫰)
#BTC #ETH #一起来跟单 #带你看看币安Launchpad #注意资金安全