

ALTCAP is the total market capitalization of cryptocurrencies excluding Bitcoin. In November 2021, it reached an all-time high of $1.71 trillion. However, since then, the indicator has been in a long-term downward trend.
In June 2022, ALTCAP appears to have reached the bottom of the current cycle at $427.75 billion. In November and December 2022, weekly candles closed below it, but this did not lead to new lows being formed.
From the beginning of 2023, a bullish structure appears to be forming on the chart. This is evidenced by the first rising high (HH) and rising low (HL) relative to late 2022 levels.
At the same time, a bullish pattern "descending wedge" (blue color) is formed on the weekly logarithmic chart. This formation is characterized by bearish lows and highs against the background of a narrowing range.
When such a pattern occurs in a downtrend, it is perceived as a trend reversal pattern. A narrowing range indicates that the downtrend is losing strength.
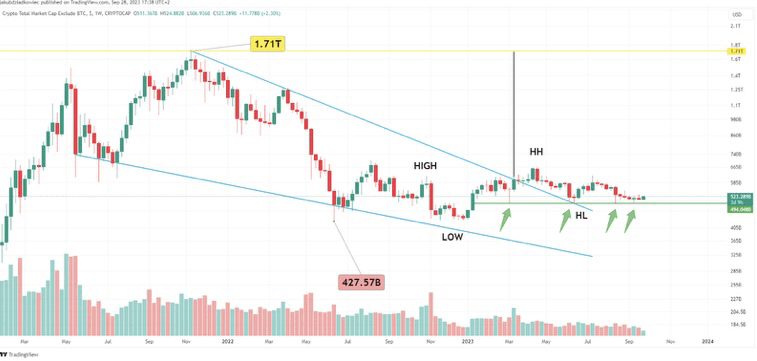
The breakout target of the model, which has been around for almost 2.5 years, will be an ATH of $1.71 trillion (black line). This goal is established by projecting the entire height of the wedge onto the breakout point of the pattern.
However, so far the result of the wedge breakout has only been the formation of a rising high. Subsequently, the capitalization of altcoins fell again and retested the downward resistance line. Now she acts as support.
It is interesting that the retest coincided with the confirmation of the support of the horizontal level of $494 billion (green line). This level has already acted as support 4 times (arrow) and is the minimum range of the current accumulation phase.
To maintain an uptrend, the price must remain above this support level.