
#trx
trx
11.8M views
35,918 Discussing
Hot
Latest


·
--
Verified
Candle_Mage:
👍❤️🔥
1
4
583

See translation
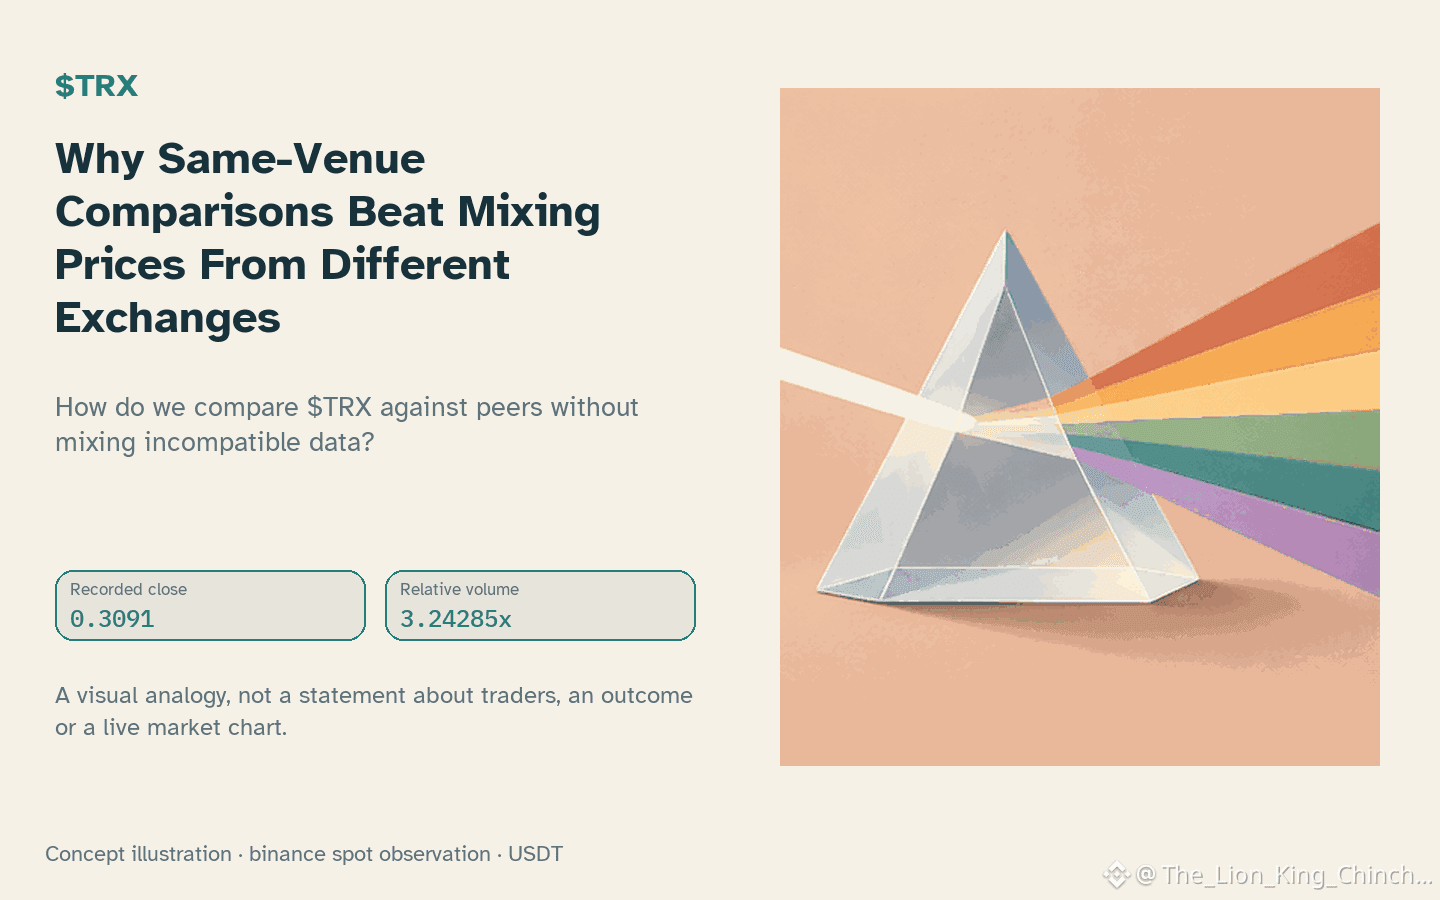
$TRX: Why Same-Venue Comparisons Beat Mixing Prices From Different Exchanges
How do we compare $TRX against peers without mixing incompatible data?
$TRX shows an hourly down direction with volume above its baseline. $ETH is down with above-baseline volume. $MMT is up but not above baseline. These come from the same venue and quote pair. That consistency allows a structural comparison. Mixing feeds from different exchanges would distort the view because timestamps and fills differ.
A useful mechanism here is data hygiene. Start by ensuring all coins use the same exchange, timestamp, and quote currency. If one coin’s volume spikes while another stays flat, the difference in structure is meaningful. It says nothing about capital rotating between them. It is a local observation, not a cause. A shared direction is not correlation.
Consider a counterexample. Suppose $TRX and $ETH both dropped, but one had high volume and the other low. A naive read might link them. A cleaner read notes the volume gap, keeping the analysis specific. The self-check is simple: if you swap the source to a different exchange, does the pattern hold? If not, the insight was an artifact of data mismatch.
The limit is that these are closed-candle observations. They do not predict the next move. Future closed candles that contradict the current volume and price relationship would weaken this interpretation. Rely on the structured comparison, not the narrative of a broader market move. This keeps the analysis clean and testable.
Probabilistic market research, not a recommendation or guaranteed return.
Watchlist contrast: $ETH has hourly direction down and volume above its baseline; $MMT has hourly direction up and volume not above its baseline. This alone does not establish correlation.
#TRX
$TRX : Why Same-Venue Comparisons Beat Mixing Prices From Different Exchanges
How do we compare $TRX against peers without mixing incompatible data?
$TRX shows an hourly down direction with volume above its baseline. $ETH is down with above-baseline volume. $MMT is up but not above baseline. These come from the same venue and quote pair. That consistency allows a structural comparison. Mixing feeds from different exchanges would distort the view because timestamps and fills differ.
A useful mechanism here is data hygiene. Start by ensuring all coins use the same exchange, timestamp, and quote currency. If one coin’s volume spikes while another stays flat, the difference in structure is meaningful. It says nothing about capital rotating between them. It is a local observation, not a cause. A shared direction is not correlation.
Consider a counterexample. Suppose $TRX and $ETH both dropped, but one had high volume and the other low. A naive read might link them. A cleaner read notes the volume gap, keeping the analysis specific. The self-check is simple: if you swap the source to a different exchange, does the pattern hold? If not, the insight was an artifact of data mismatch.
The limit is that these are closed-candle observations. They do not predict the next move. Future closed candles that contradict the current volume and price relationship would weaken this interpretation. Rely on the structured comparison, not the narrative of a broader market move. This keeps the analysis clean and testable.
Probabilistic market research, not a recommendation or guaranteed return.
Watchlist contrast: $ETH has hourly direction down and volume above its baseline; $MMT has hourly direction up and volume not above its baseline. This alone does not establish correlation.
#TRX
How do we compare $TRX against peers without mixing incompatible data?
$TRX shows an hourly down direction with volume above its baseline. $ETH is down with above-baseline volume. $MMT is up but not above baseline. These come from the same venue and quote pair. That consistency allows a structural comparison. Mixing feeds from different exchanges would distort the view because timestamps and fills differ.
A useful mechanism here is data hygiene. Start by ensuring all coins use the same exchange, timestamp, and quote currency. If one coin’s volume spikes while another stays flat, the difference in structure is meaningful. It says nothing about capital rotating between them. It is a local observation, not a cause. A shared direction is not correlation.
Consider a counterexample. Suppose $TRX and $ETH both dropped, but one had high volume and the other low. A naive read might link them. A cleaner read notes the volume gap, keeping the analysis specific. The self-check is simple: if you swap the source to a different exchange, does the pattern hold? If not, the insight was an artifact of data mismatch.
The limit is that these are closed-candle observations. They do not predict the next move. Future closed candles that contradict the current volume and price relationship would weaken this interpretation. Rely on the structured comparison, not the narrative of a broader market move. This keeps the analysis clean and testable.
Probabilistic market research, not a recommendation or guaranteed return.
Watchlist contrast: $ETH has hourly direction down and volume above its baseline; $MMT has hourly direction up and volume not above its baseline. This alone does not establish correlation.
#TRX
27

See translation
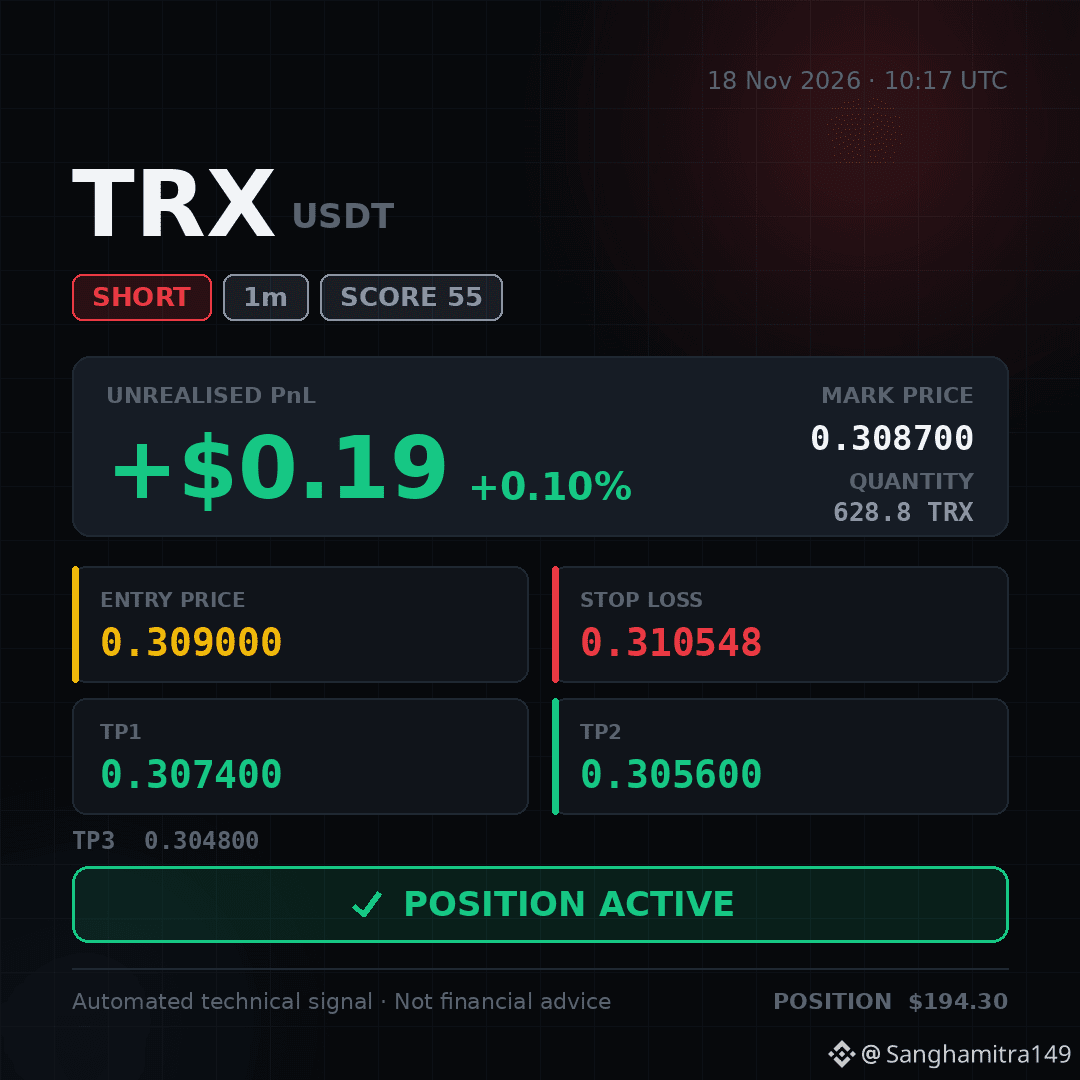
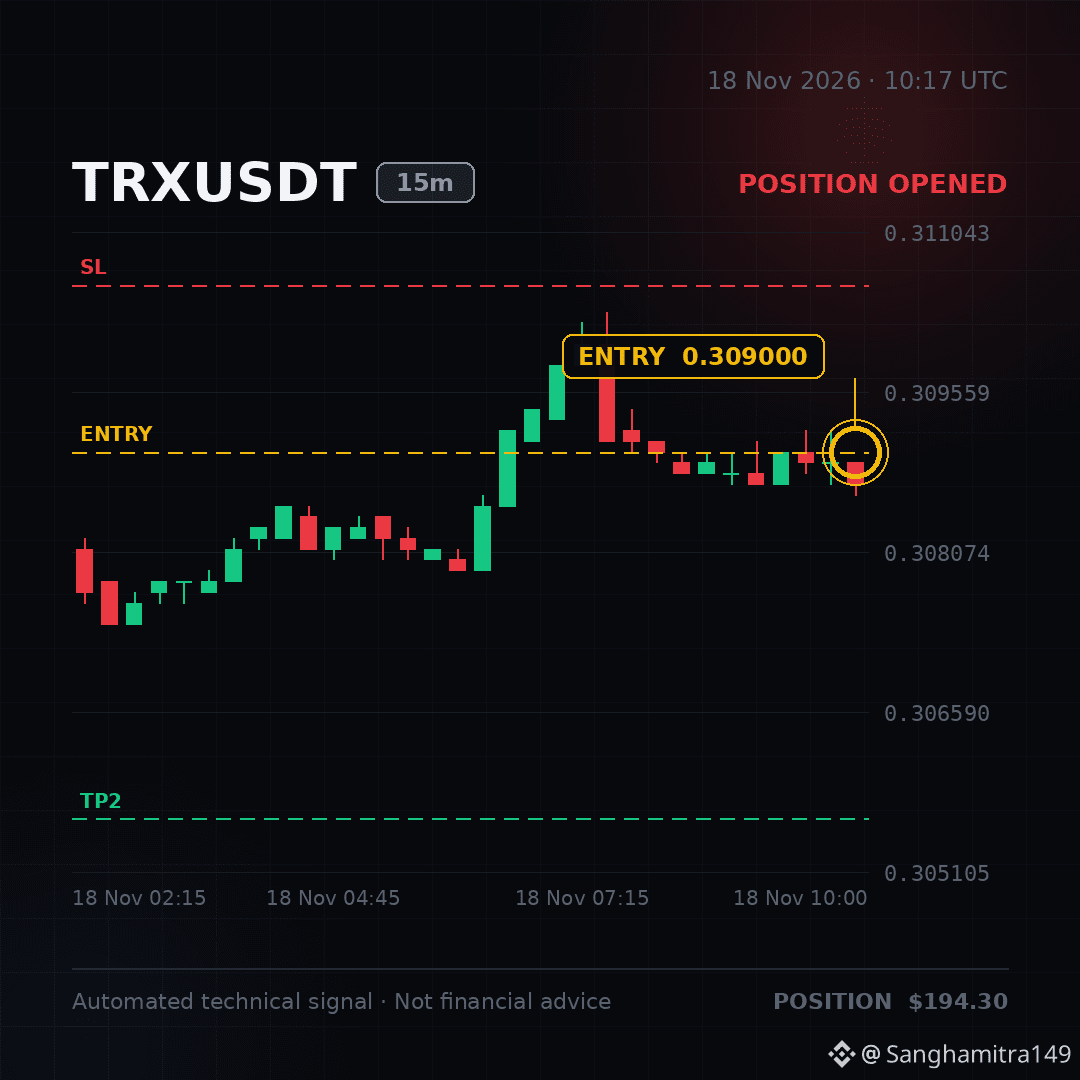
✅ POSITION ACTIVE — I've taken this short. Running at +0.10%.
🚨 #TRX Squeeze Incoming! 🤯🩸
I’m taking this short now! $TRX 👇
Short.... First.... Watch... Later........‼️‼️‼️
Entry: 0.309 – 0.3091
Stop-loss: 0.3105
🟢 TP1: 0.3074
🟢 TP2: 0.3056
🟢 TP3: 0.3048
Join the ride! 👇⬇️⬇️ Short.. With meee...👇⬇️ $TRX
✅ POSITION ACTIVE — I've taken this short. Running at +0.10%.
🚨 #TRX Squeeze Incoming! 🤯🩸
I’m taking this short now! $TRX 👇
Short.... First.... Watch... Later........‼️‼️‼️
Entry: 0.309 – 0.3091
Stop-loss: 0.3105
🟢 TP1: 0.3074
🟢 TP2: 0.3056
🟢 TP3: 0.3048
Join the ride! 👇⬇️⬇️ Short.. With meee...👇⬇️ $TRX
🚨 #TRX Squeeze Incoming! 🤯🩸
I’m taking this short now! $TRX 👇
Short.... First.... Watch... Later........‼️‼️‼️
Entry: 0.309 – 0.3091
Stop-loss: 0.3105
🟢 TP1: 0.3074
🟢 TP2: 0.3056
🟢 TP3: 0.3048
Join the ride! 👇⬇️⬇️ Short.. With meee...👇⬇️ $TRX

·
--
See translation
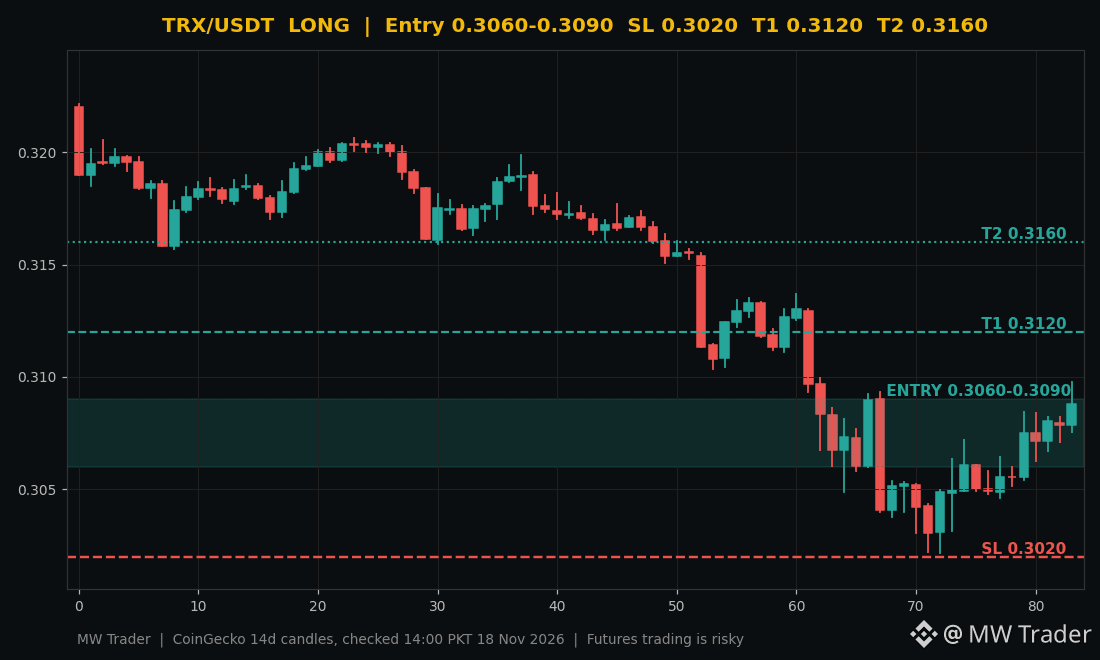
$TRX #TRX is up 1.02 percent at $0.3086, steady near its 24 hour high. 📈
Tron ran from a 24 hour low of $0.305164 to a high of $0.309769, and the last candle closed at $0.3088, so buyers are holding a tight range near the top. 🟢 My plan is a long on the entry zone of $0.306 to $0.309, with a stop loss at $0.302, target 1 at $0.312 and target 2 at $0.316. The $0.3098 high is the level to beat, and a clean break above it opens the way to $0.316. The range is tight, so size stays small and the stop stays firm. ⚠️
Does TRX break $0.3098 and run to $0.316, or does $0.306 give way first? 🤔
Futures trading is risky, trade small, manage risk, do your own research.
Follow for more trades.
#Tron #Crypto #FuturesTrading #TradingSignals
$TRX #TRX is up 1.02 percent at $0.3086, steady near its 24 hour high. 📈
Tron ran from a 24 hour low of $0.305164 to a high of $0.309769, and the last candle closed at $0.3088, so buyers are holding a tight range near the top. 🟢 My plan is a long on the entry zone of $0.306 to $0.309, with a stop loss at $0.302, target 1 at $0.312 and target 2 at $0.316. The $0.3098 high is the level to beat, and a clean break above it opens the way to $0.316. The range is tight, so size stays small and the stop stays firm. ⚠️
Does TRX break $0.3098 and run to $0.316, or does $0.306 give way first? 🤔
Futures trading is risky, trade small, manage risk, do your own research.
Follow for more trades.
#Tron #Crypto #FuturesTrading #TradingSignals
Tron ran from a 24 hour low of $0.305164 to a high of $0.309769, and the last candle closed at $0.3088, so buyers are holding a tight range near the top. 🟢 My plan is a long on the entry zone of $0.306 to $0.309, with a stop loss at $0.302, target 1 at $0.312 and target 2 at $0.316. The $0.3098 high is the level to beat, and a clean break above it opens the way to $0.316. The range is tight, so size stays small and the stop stays firm. ⚠️
Does TRX break $0.3098 and run to $0.316, or does $0.306 give way first? 🤔
Futures trading is risky, trade small, manage risk, do your own research.
Follow for more trades.
#Tron #Crypto #FuturesTrading #TradingSignals
1

See translation
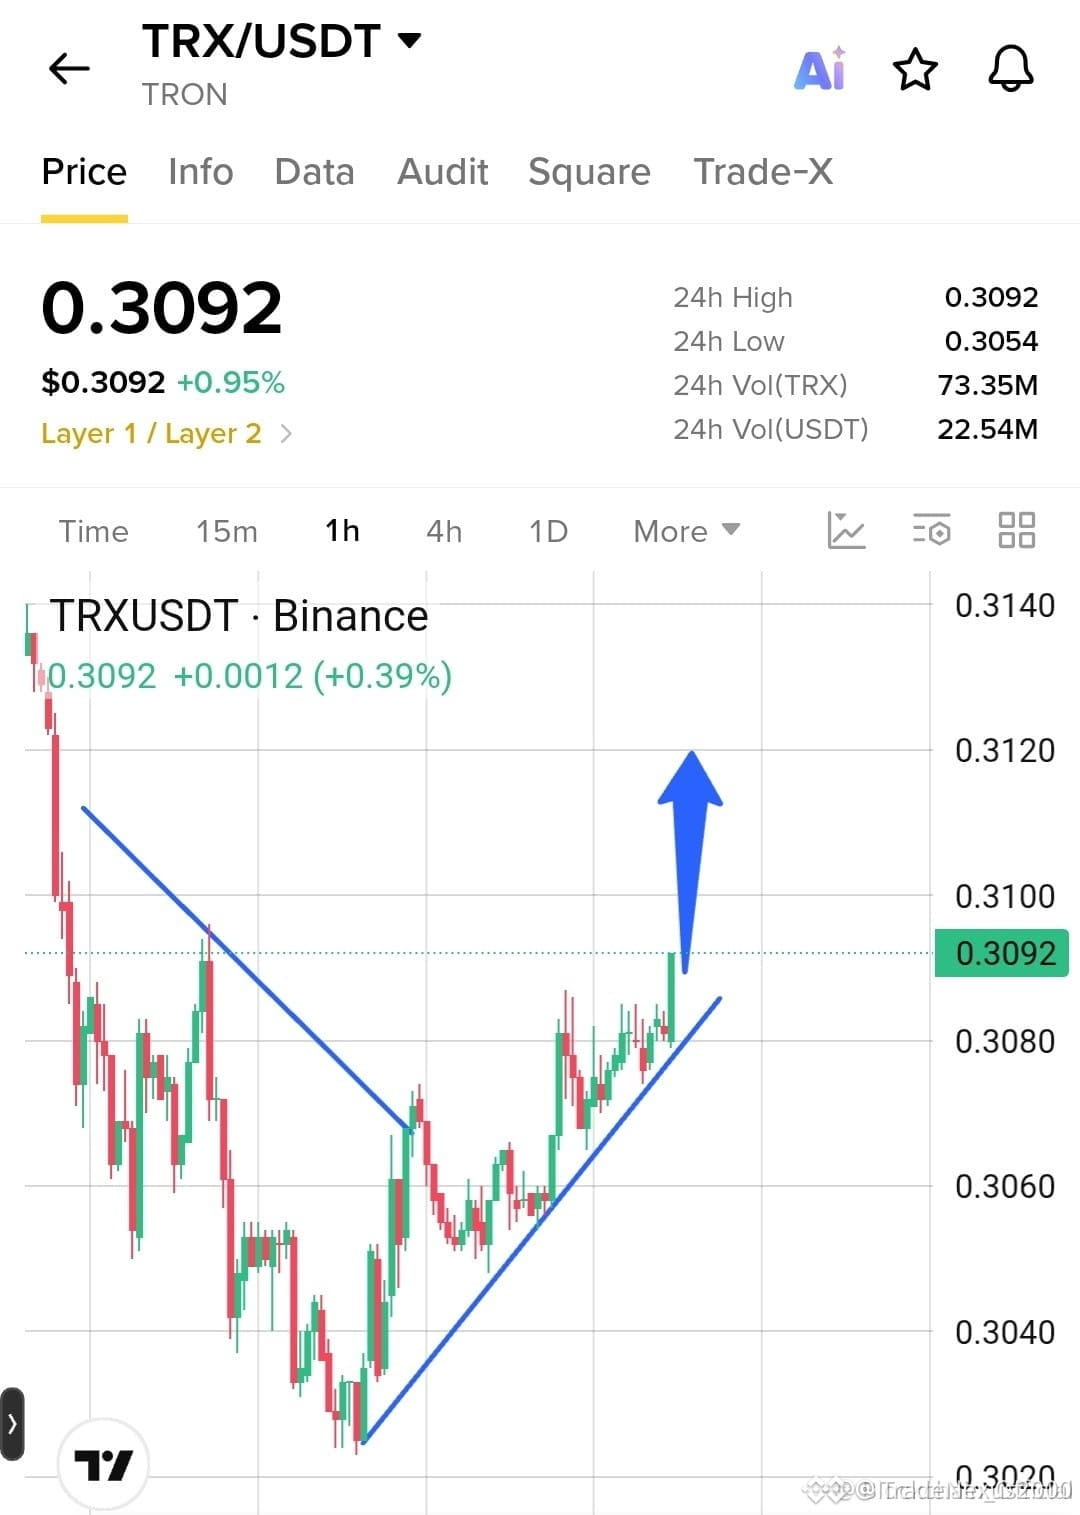
🦈 $TRX FORMING A CLEAN ACCUMULATION BASE AHEAD OF A LIQUIDITY SWEEP TOWARD RESISTANCE! 💥
Entry: $0.3080 – $0.3092 ⚡
Target: $0.3120 🚀
Stop Loss: $0.3060 ⚠️
Price action on the lower timeframes reveals a persistent higher-low structure pressing directly against overhead supply. Institutional order flow shows passive absorption at current levels, signaling aggressive buyers stepping in before the breakout. 📊
As efficiency builds and minor resting liquidity is cleared above the range, expect an impulsive expansion into the higher targets. 💡 Are you positioned for the continuation leg or waiting for a retest of the demand zone? 👇
⚠️ Not financial advice. Always manage your risk. 🛡️
🏷️ #TRX #SmartMoney #Breakout #Crypto
🔥 🦈
🦈 $TRX FORMING A CLEAN ACCUMULATION BASE AHEAD OF A LIQUIDITY SWEEP TOWARD RESISTANCE! 💥
Entry: $0.3080 – $0.3092 ⚡
Target: $0.3120 🚀
Stop Loss: $0.3060 ⚠️
Price action on the lower timeframes reveals a persistent higher-low structure pressing directly against overhead supply. Institutional order flow shows passive absorption at current levels, signaling aggressive buyers stepping in before the breakout. 📊
As efficiency builds and minor resting liquidity is cleared above the range, expect an impulsive expansion into the higher targets. 💡 Are you positioned for the continuation leg or waiting for a retest of the demand zone? 👇
⚠️ Not financial advice. Always manage your risk. 🛡️
🏷️ #TRX #SmartMoney #Breakout #Crypto
🔥 🦈
Entry: $0.3080 – $0.3092 ⚡
Target: $0.3120 🚀
Stop Loss: $0.3060 ⚠️
Price action on the lower timeframes reveals a persistent higher-low structure pressing directly against overhead supply. Institutional order flow shows passive absorption at current levels, signaling aggressive buyers stepping in before the breakout. 📊
As efficiency builds and minor resting liquidity is cleared above the range, expect an impulsive expansion into the higher targets. 💡 Are you positioned for the continuation leg or waiting for a retest of the demand zone? 👇
⚠️ Not financial advice. Always manage your risk. 🛡️
🏷️ #TRX #SmartMoney #Breakout #Crypto
🔥 🦈
1

·
--
Bullish
See translation
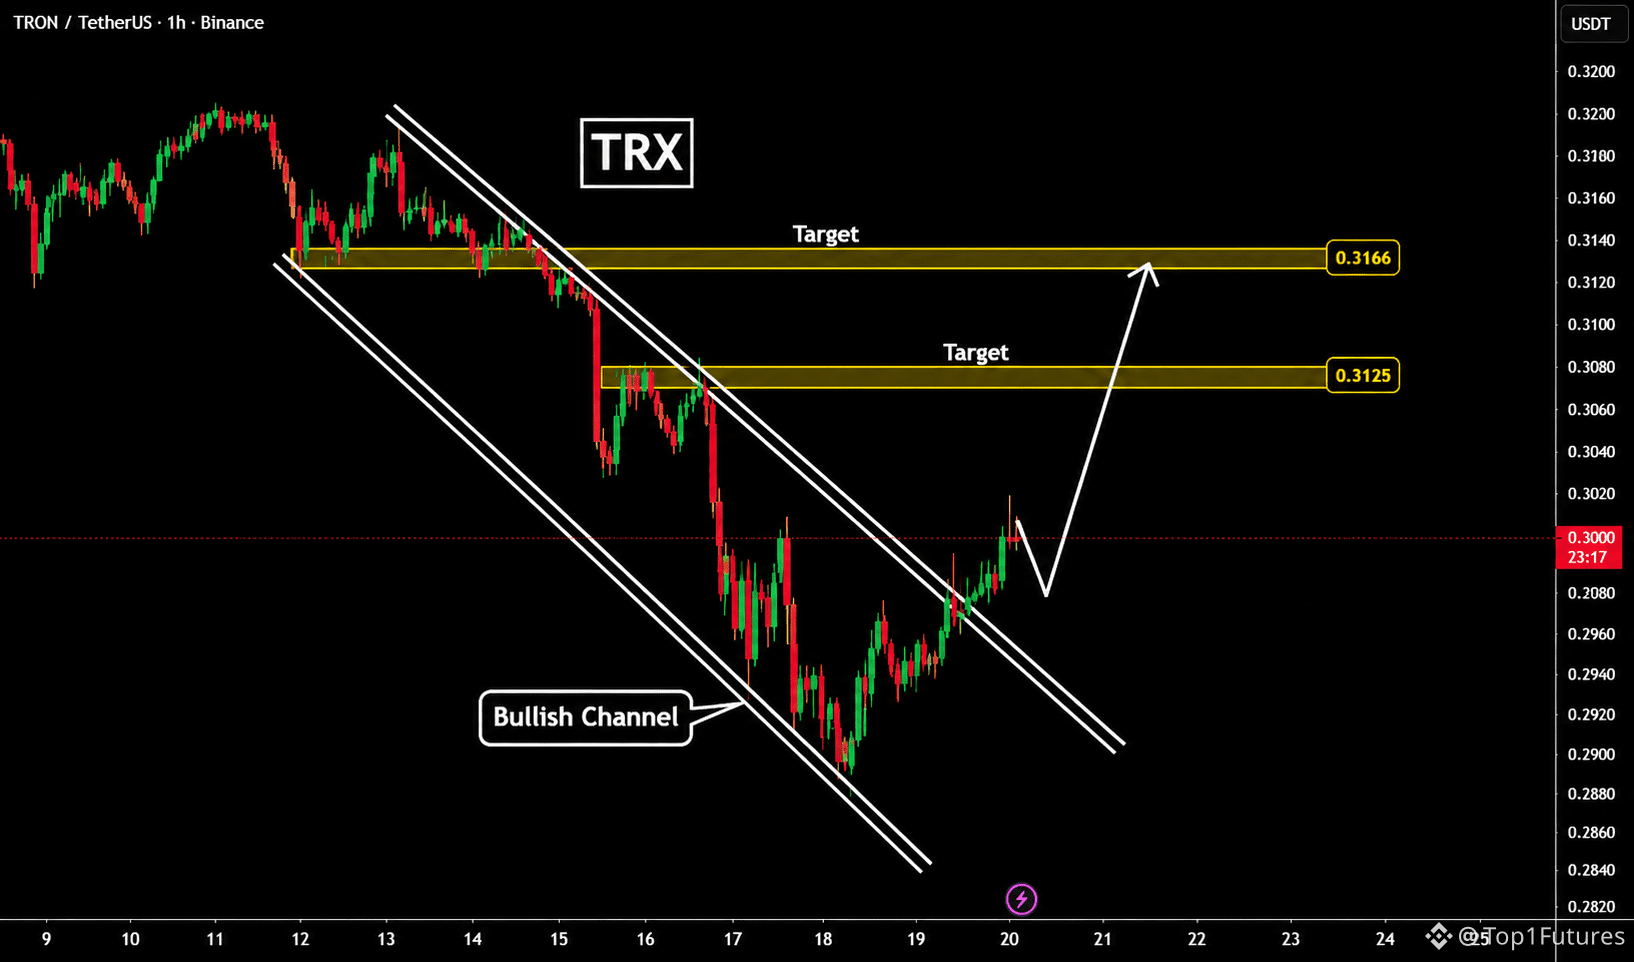
$TRX Descending channel signals upward move towards $0.3165🔼📈
#TRX is showing early signs of a potential bullish reversal after spending several days trading inside a descending channel on the 1H chart.
Following a prolonged decline, buyers have started to regain control, pushing the price towards and above the upper boundary of the channel.
However, I would prefer to see a small pullback before the next upward move.
If the breakout holds, I will be watching the following upside targets:
Bullish targets:
0.3135
0.3165
$TRX Descending channel signals upward move towards $0.3165🔼📈
#TRX is showing early signs of a potential bullish reversal after spending several days trading inside a descending channel on the 1H chart.
Following a prolonged decline, buyers have started to regain control, pushing the price towards and above the upper boundary of the channel.
However, I would prefer to see a small pullback before the next upward move.
If the breakout holds, I will be watching the following upside targets:
Bullish targets:
0.3135
0.3165
#TRX is showing early signs of a potential bullish reversal after spending several days trading inside a descending channel on the 1H chart.
Following a prolonged decline, buyers have started to regain control, pushing the price towards and above the upper boundary of the channel.
However, I would prefer to see a small pullback before the next upward move.
If the breakout holds, I will be watching the following upside targets:
Bullish targets:
0.3135
0.3165
1
58

See translation
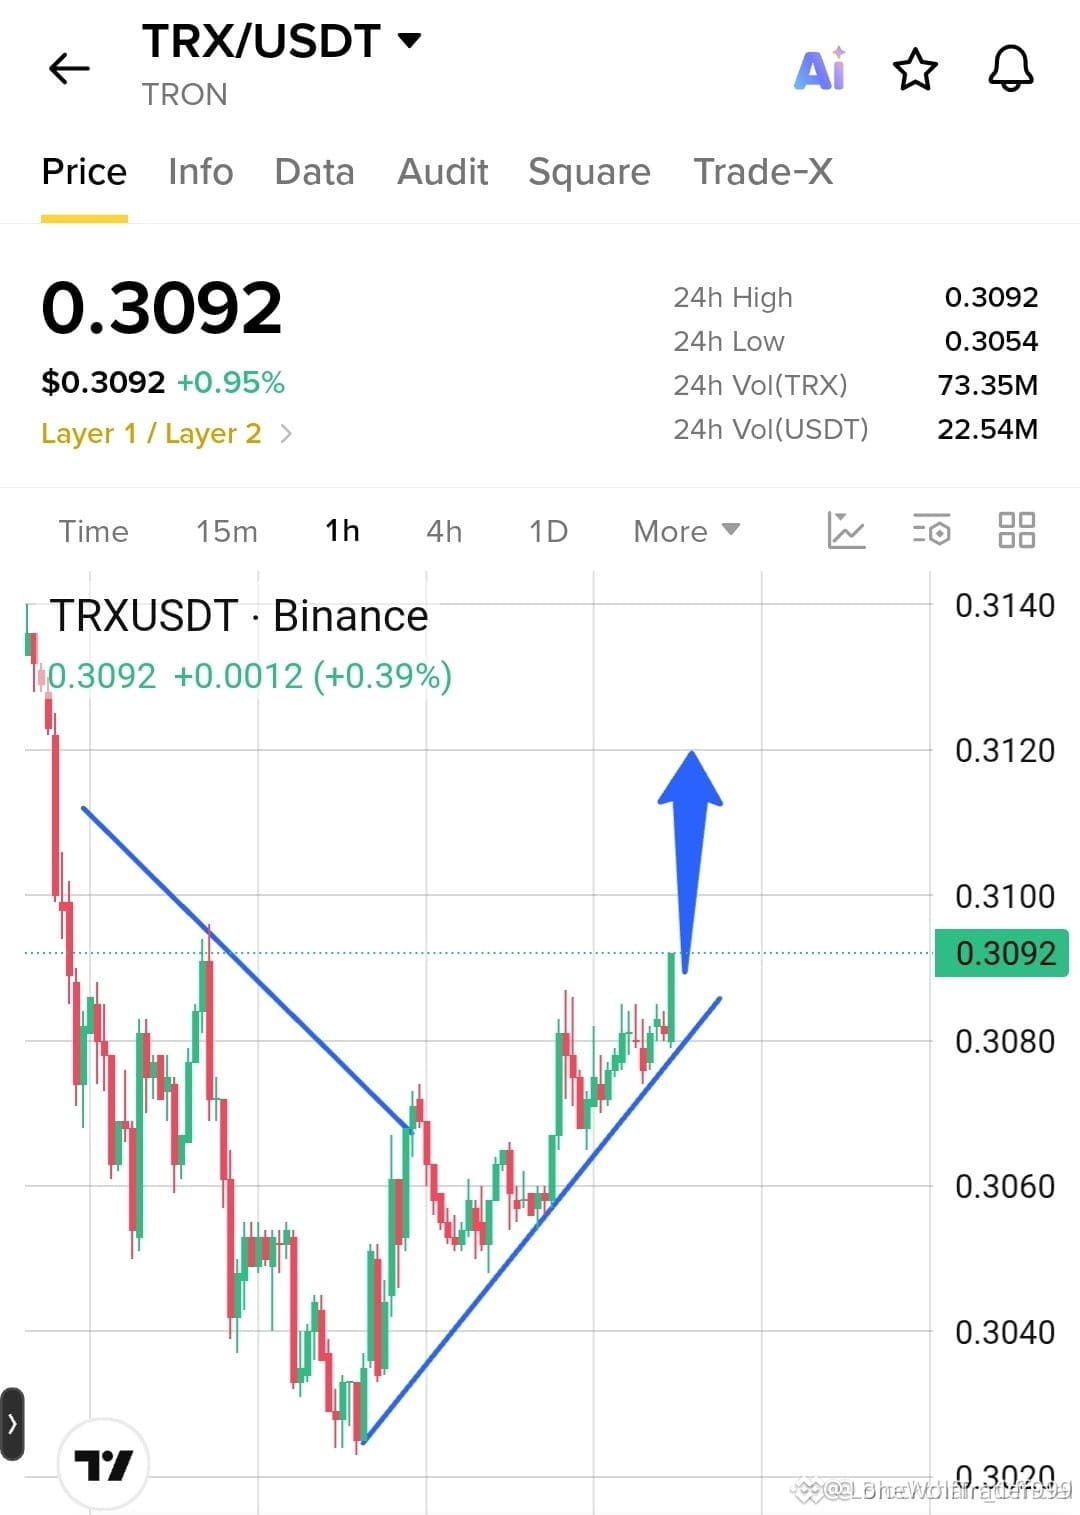
🚀 $TRX BUYERS STEPPING UP HARD AS RISING SUPPORT PRESSURES RESISTANCE! ⚡
Entry: 0.3080 - 0.3092 ⚡
Target: 0.3120 🚀
Stop Loss: 0.3060 ⚠️
Price action is coiling tightly as higher lows build an unyielding foundation. Buyers are steadily absorbing overhead supply, setting the stage for a clean structural break toward higher liquidity. 📊
Momentum indicators on the lower timeframes are tilting upward as accumulation intensifies within the current band. If volume expands on the push past immediate resistance, expect a rapid sprint to the final target. ⚡
💬 Are you positioning ahead of the breakout or waiting for confirmation on the retest? 👇
⚠️ Not financial advice. Always manage your risk. 🛡️
🏷️ #TRX #LongSetup #Crypto #Breakout
🔥 💎
🚀 $TRX BUYERS STEPPING UP HARD AS RISING SUPPORT PRESSURES RESISTANCE! ⚡
Entry: 0.3080 - 0.3092 ⚡
Target: 0.3120 🚀
Stop Loss: 0.3060 ⚠️
Price action is coiling tightly as higher lows build an unyielding foundation. Buyers are steadily absorbing overhead supply, setting the stage for a clean structural break toward higher liquidity. 📊
Momentum indicators on the lower timeframes are tilting upward as accumulation intensifies within the current band. If volume expands on the push past immediate resistance, expect a rapid sprint to the final target. ⚡
💬 Are you positioning ahead of the breakout or waiting for confirmation on the retest? 👇
⚠️ Not financial advice. Always manage your risk. 🛡️
🏷️ #TRX #LongSetup #Crypto #Breakout
🔥 💎
Entry: 0.3080 - 0.3092 ⚡
Target: 0.3120 🚀
Stop Loss: 0.3060 ⚠️
Price action is coiling tightly as higher lows build an unyielding foundation. Buyers are steadily absorbing overhead supply, setting the stage for a clean structural break toward higher liquidity. 📊
Momentum indicators on the lower timeframes are tilting upward as accumulation intensifies within the current band. If volume expands on the push past immediate resistance, expect a rapid sprint to the final target. ⚡
💬 Are you positioning ahead of the breakout or waiting for confirmation on the retest? 👇
⚠️ Not financial advice. Always manage your risk. 🛡️
🏷️ #TRX #LongSetup #Crypto #Breakout
🔥 💎

·
--
See translation
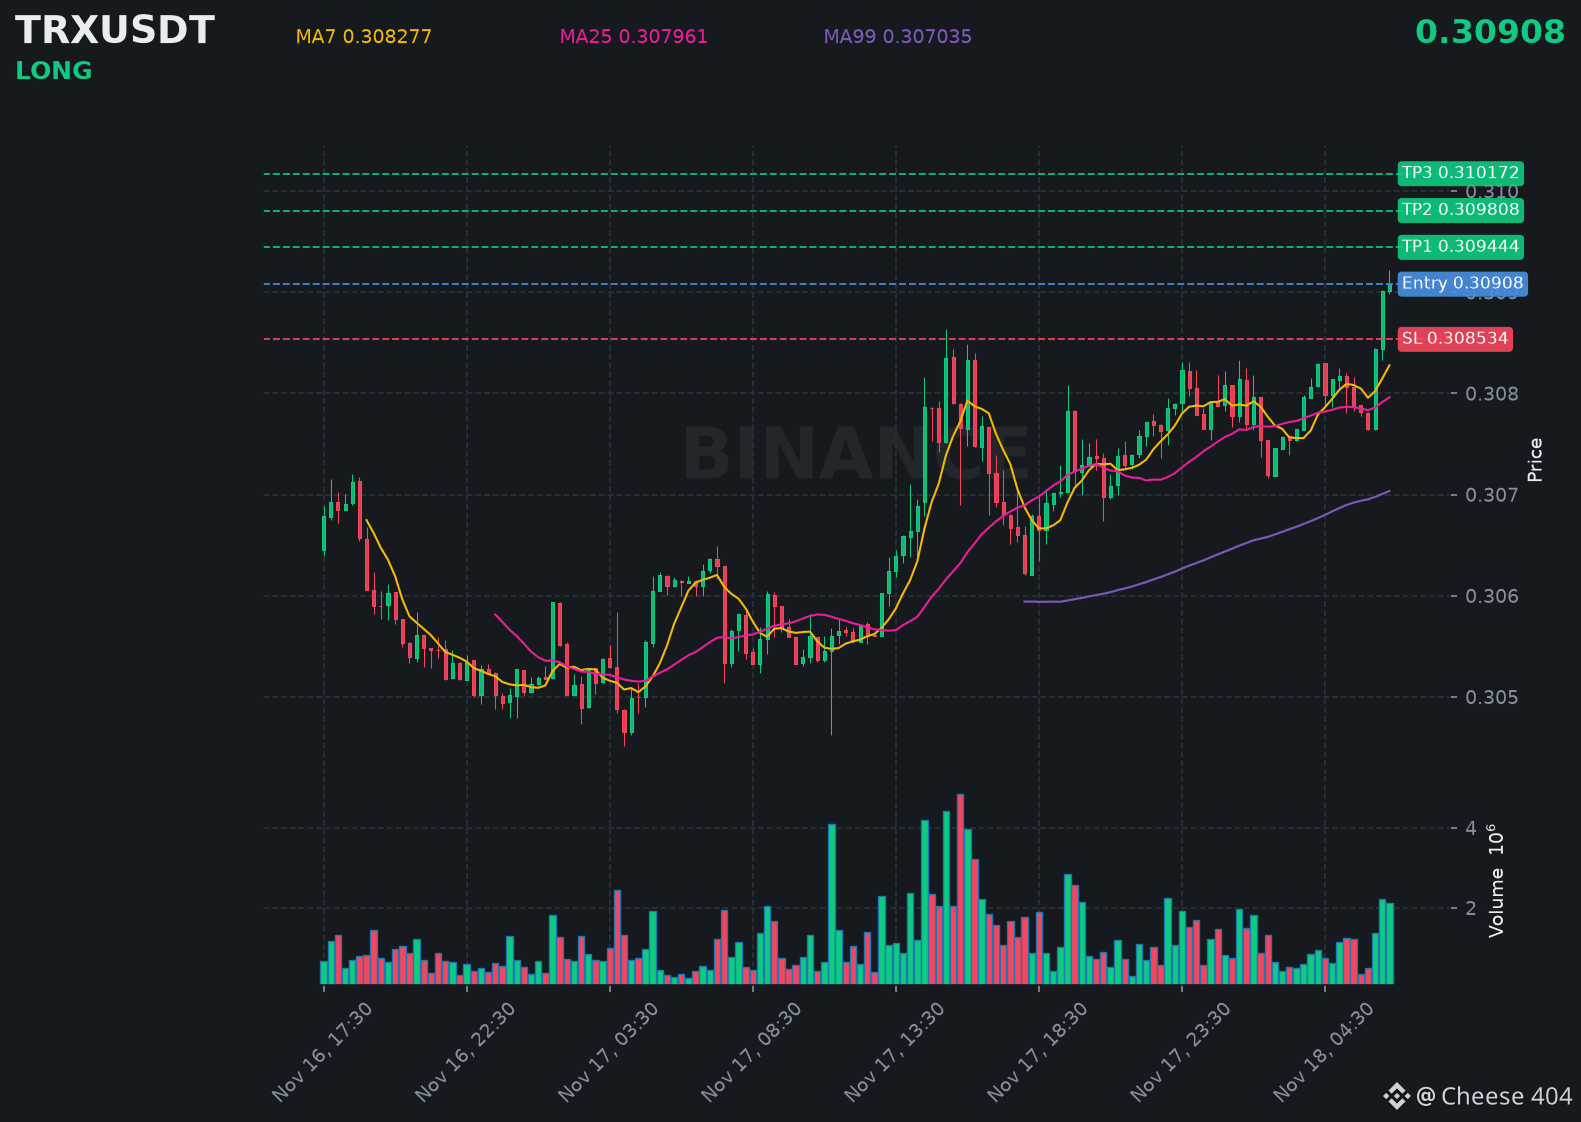
$TRX looks primed to keep climbing, with bulls firmly in control of the trend.
📍 @ 0.30908 | Volume: 0.65M USD
RSI 67 | EMA20: 0.308111 USD
📈 Trade Plan:
📈 Entry: 0.308971 – 0.309189
🛑 Stop Loss: 0.308534
🎯 TP1: 0.309444
🎯 TP2: 0.309808
🎯 TP3: 0.310172
Waiting for a retest, then riding the uptrend.
👉 $TRX 👈 Catch it
#TRX
$TRX looks primed to keep climbing, with bulls firmly in control of the trend.
📍 @ 0.30908 | Volume: 0.65M USD
RSI 67 | EMA20: 0.308111 USD
📈 Trade Plan:
📈 Entry: 0.308971 – 0.309189
🛑 Stop Loss: 0.308534
🎯 TP1: 0.309444
🎯 TP2: 0.309808
🎯 TP3: 0.310172
Waiting for a retest, then riding the uptrend.
👉 $TRX 👈 Catch it
#TRX
📍 @ 0.30908 | Volume: 0.65M USD
RSI 67 | EMA20: 0.308111 USD
📈 Trade Plan:
📈 Entry: 0.308971 – 0.309189
🛑 Stop Loss: 0.308534
🎯 TP1: 0.309444
🎯 TP2: 0.309808
🎯 TP3: 0.310172
Waiting for a retest, then riding the uptrend.
👉 $TRX 👈 Catch it
#TRX
64


See translation
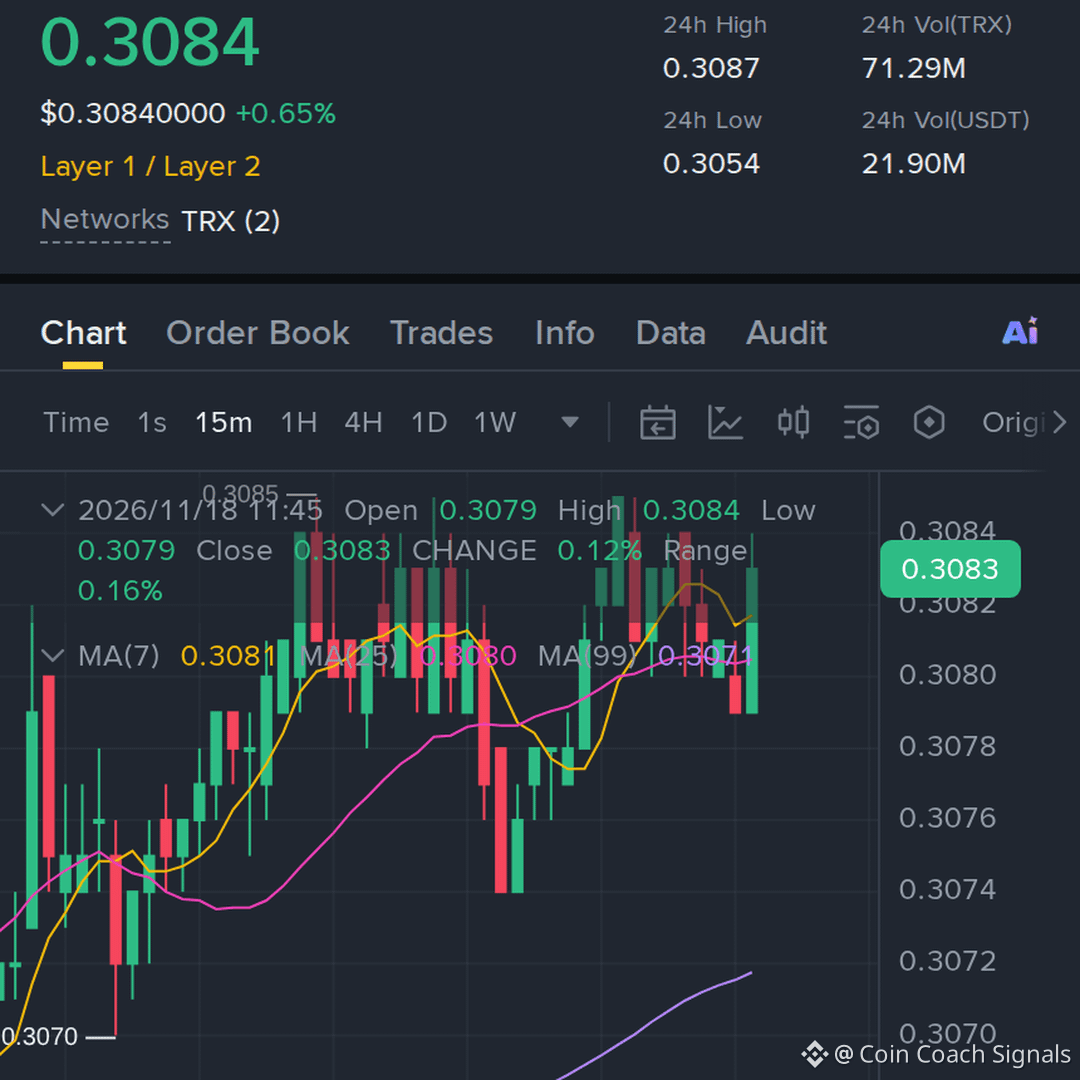
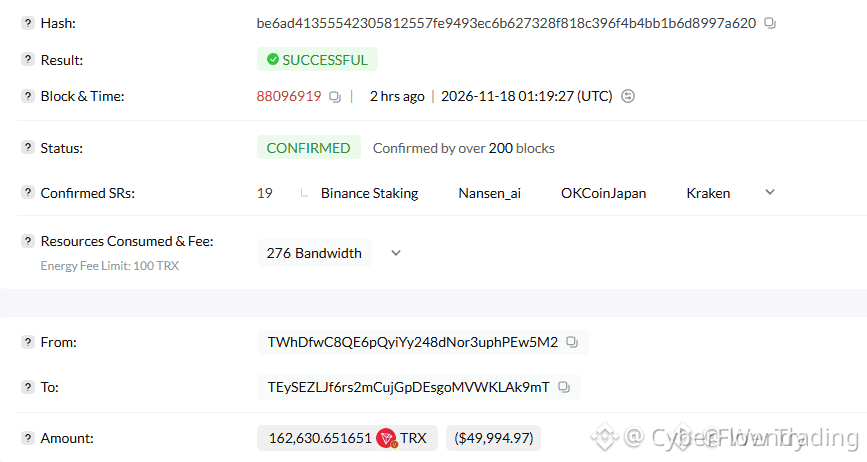
🐋 INSTITUTIONAL ACCUMULATION IN $TRX ACCELERATES WITH ANOTHER TREASURY BUY! 📈
Entry: 0.3074 ⚡
Corporate treasuries do not trade micro-trends; they lock in supply and drain order books with surgical precision. Seeing heavyweights absorb spot inventory at 0.3074 proves smart money is quietly building structural weight behind the asset. 🦈
When corporate balance sheets start hoarding float while retail looks the other way, the underlying supply dynamic shifts permanently. Accumulation phases like this are where multi-month bases are forged before the next liquidity expansion. 📊
💬 Are you tracking corporate treasury inflows as a leading indicator for your own entries? 👇
⚠️ Not financial advice. Always manage your risk. 🛡️
🏷️ #TRX #SmartMoney #Accumulation #Crypto #Altcoins
🔥 💎
🐋 INSTITUTIONAL ACCUMULATION IN $TRX ACCELERATES WITH ANOTHER TREASURY BUY! 📈
Entry: 0.3074 ⚡
Corporate treasuries do not trade micro-trends; they lock in supply and drain order books with surgical precision. Seeing heavyweights absorb spot inventory at 0.3074 proves smart money is quietly building structural weight behind the asset. 🦈
When corporate balance sheets start hoarding float while retail looks the other way, the underlying supply dynamic shifts permanently. Accumulation phases like this are where multi-month bases are forged before the next liquidity expansion. 📊
💬 Are you tracking corporate treasury inflows as a leading indicator for your own entries? 👇
⚠️ Not financial advice. Always manage your risk. 🛡️
🏷️ #TRX #SmartMoney #Accumulation #Crypto #Altcoins
🔥 💎
Entry: 0.3074 ⚡
Corporate treasuries do not trade micro-trends; they lock in supply and drain order books with surgical precision. Seeing heavyweights absorb spot inventory at 0.3074 proves smart money is quietly building structural weight behind the asset. 🦈
When corporate balance sheets start hoarding float while retail looks the other way, the underlying supply dynamic shifts permanently. Accumulation phases like this are where multi-month bases are forged before the next liquidity expansion. 📊
💬 Are you tracking corporate treasury inflows as a leading indicator for your own entries? 👇
⚠️ Not financial advice. Always manage your risk. 🛡️
🏷️ #TRX #SmartMoney #Accumulation #Crypto #Altcoins
🔥 💎
5
See translation
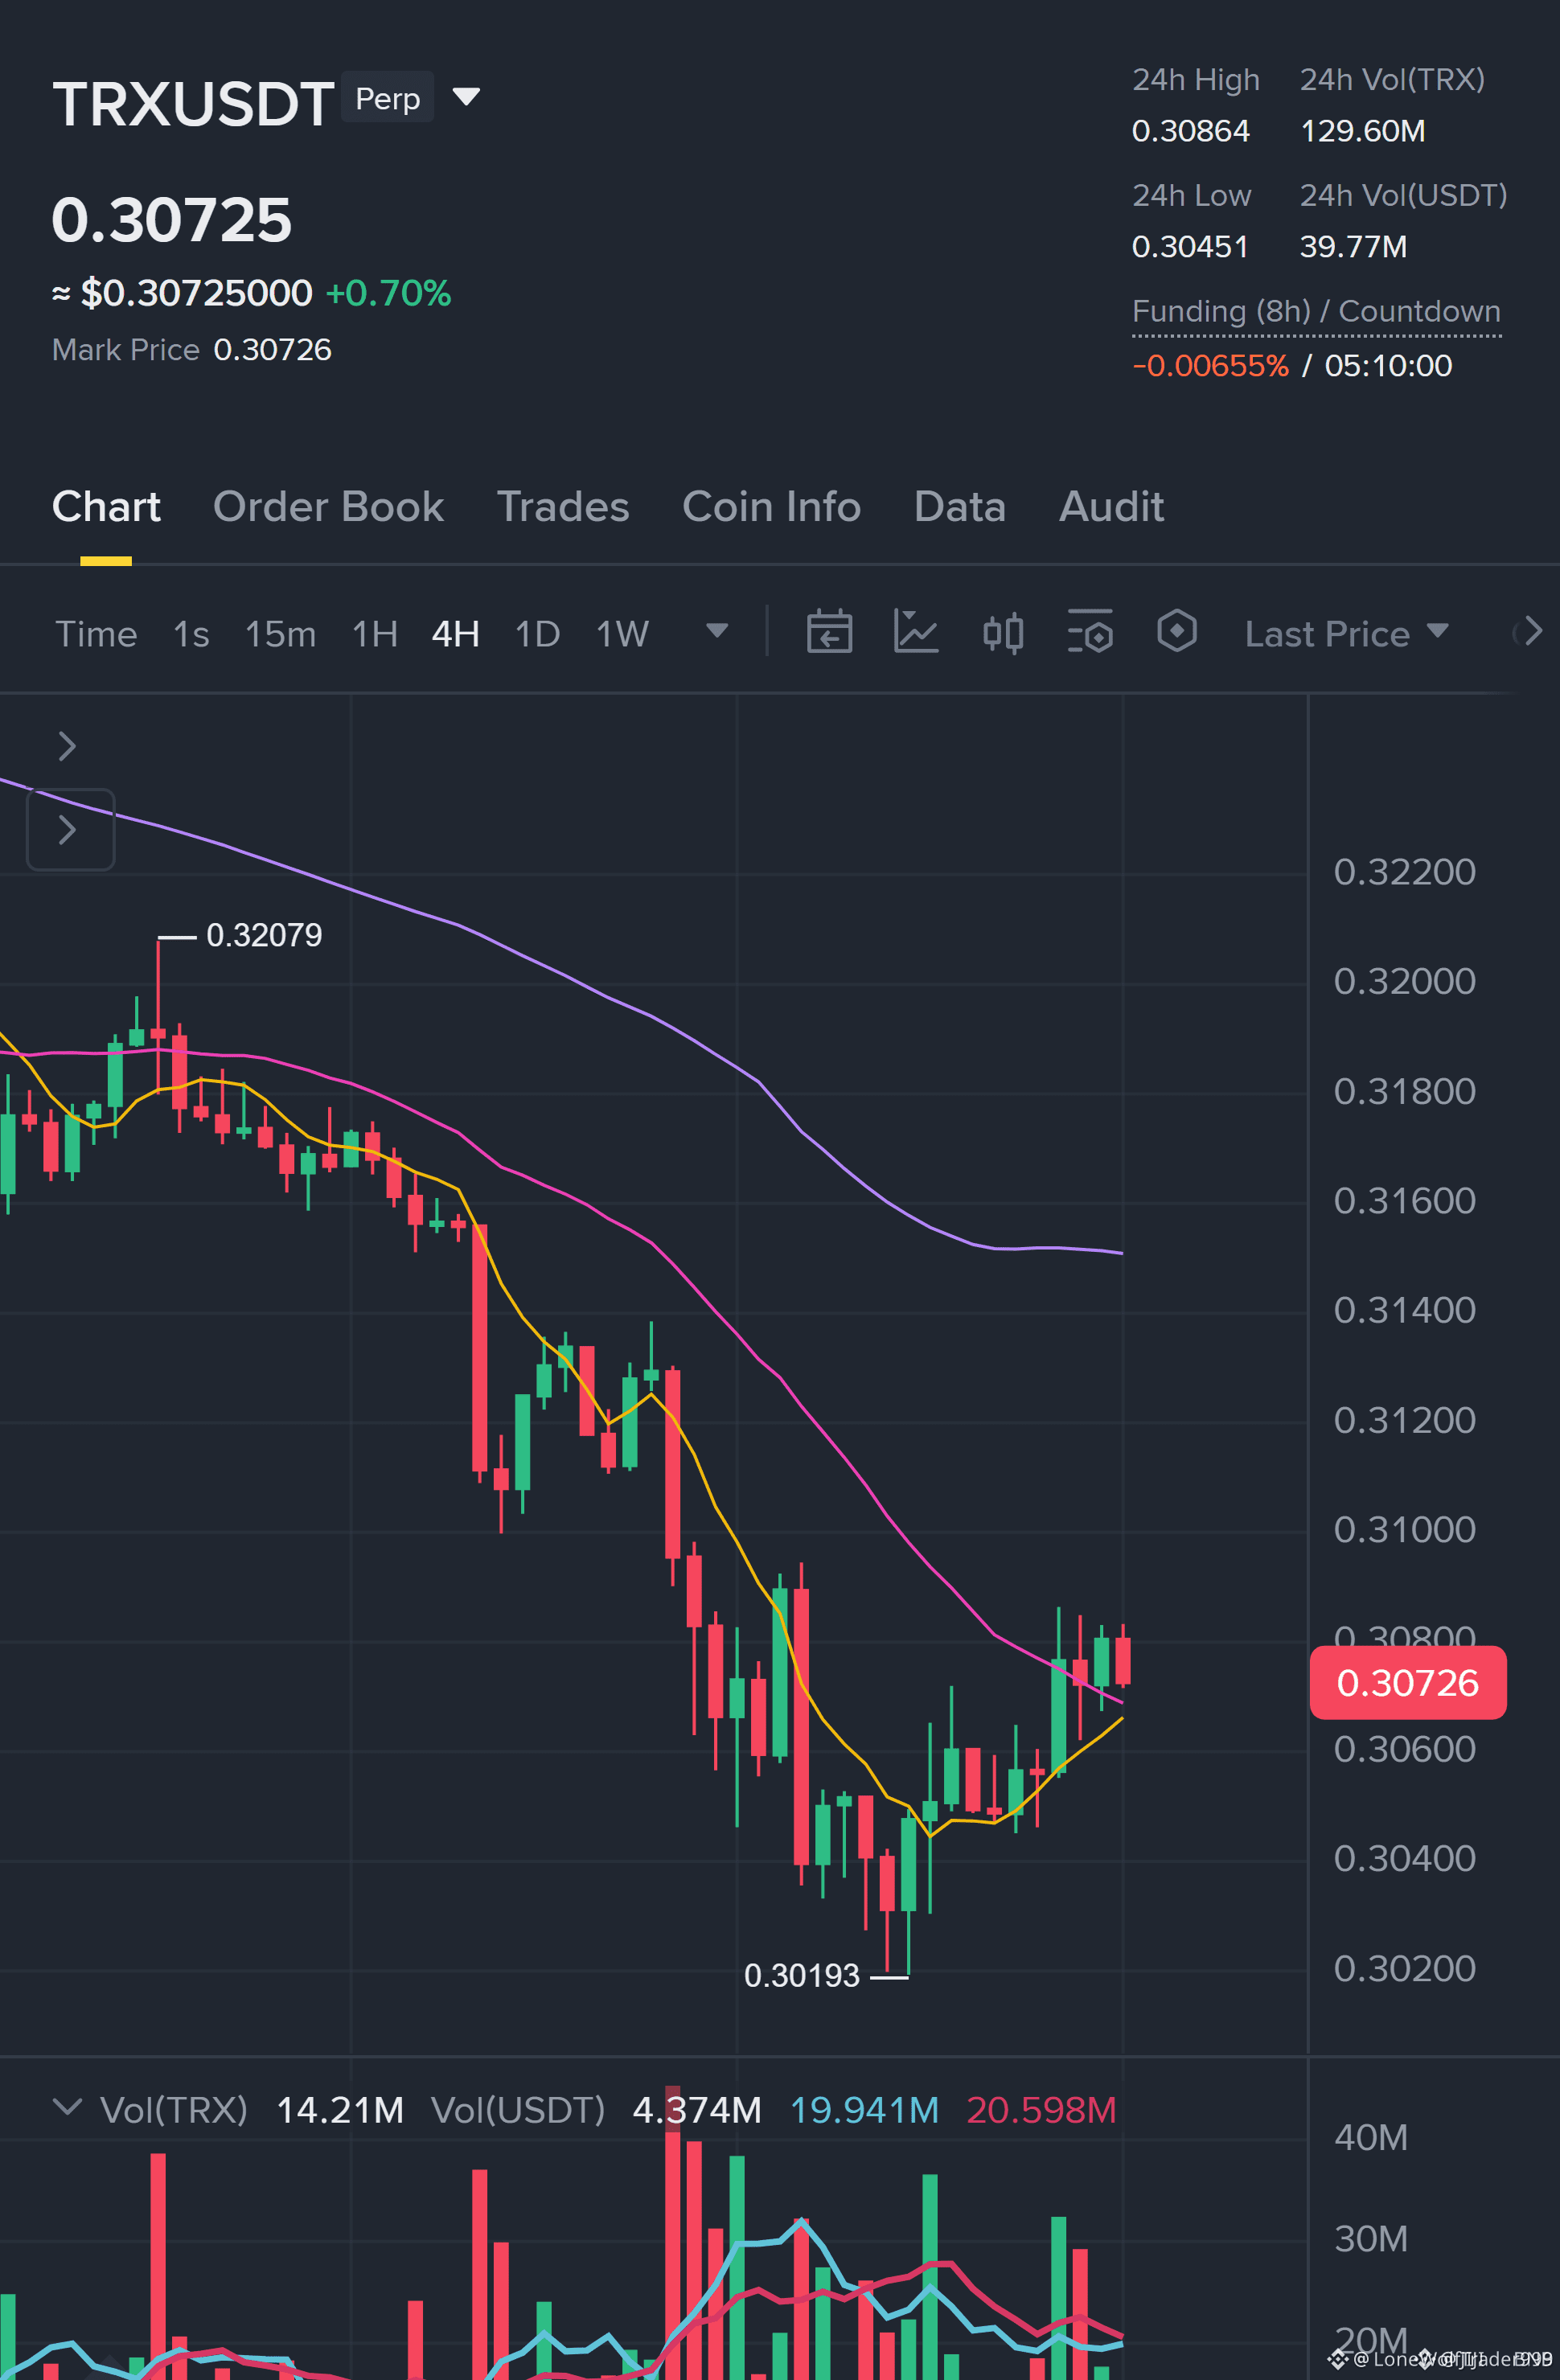
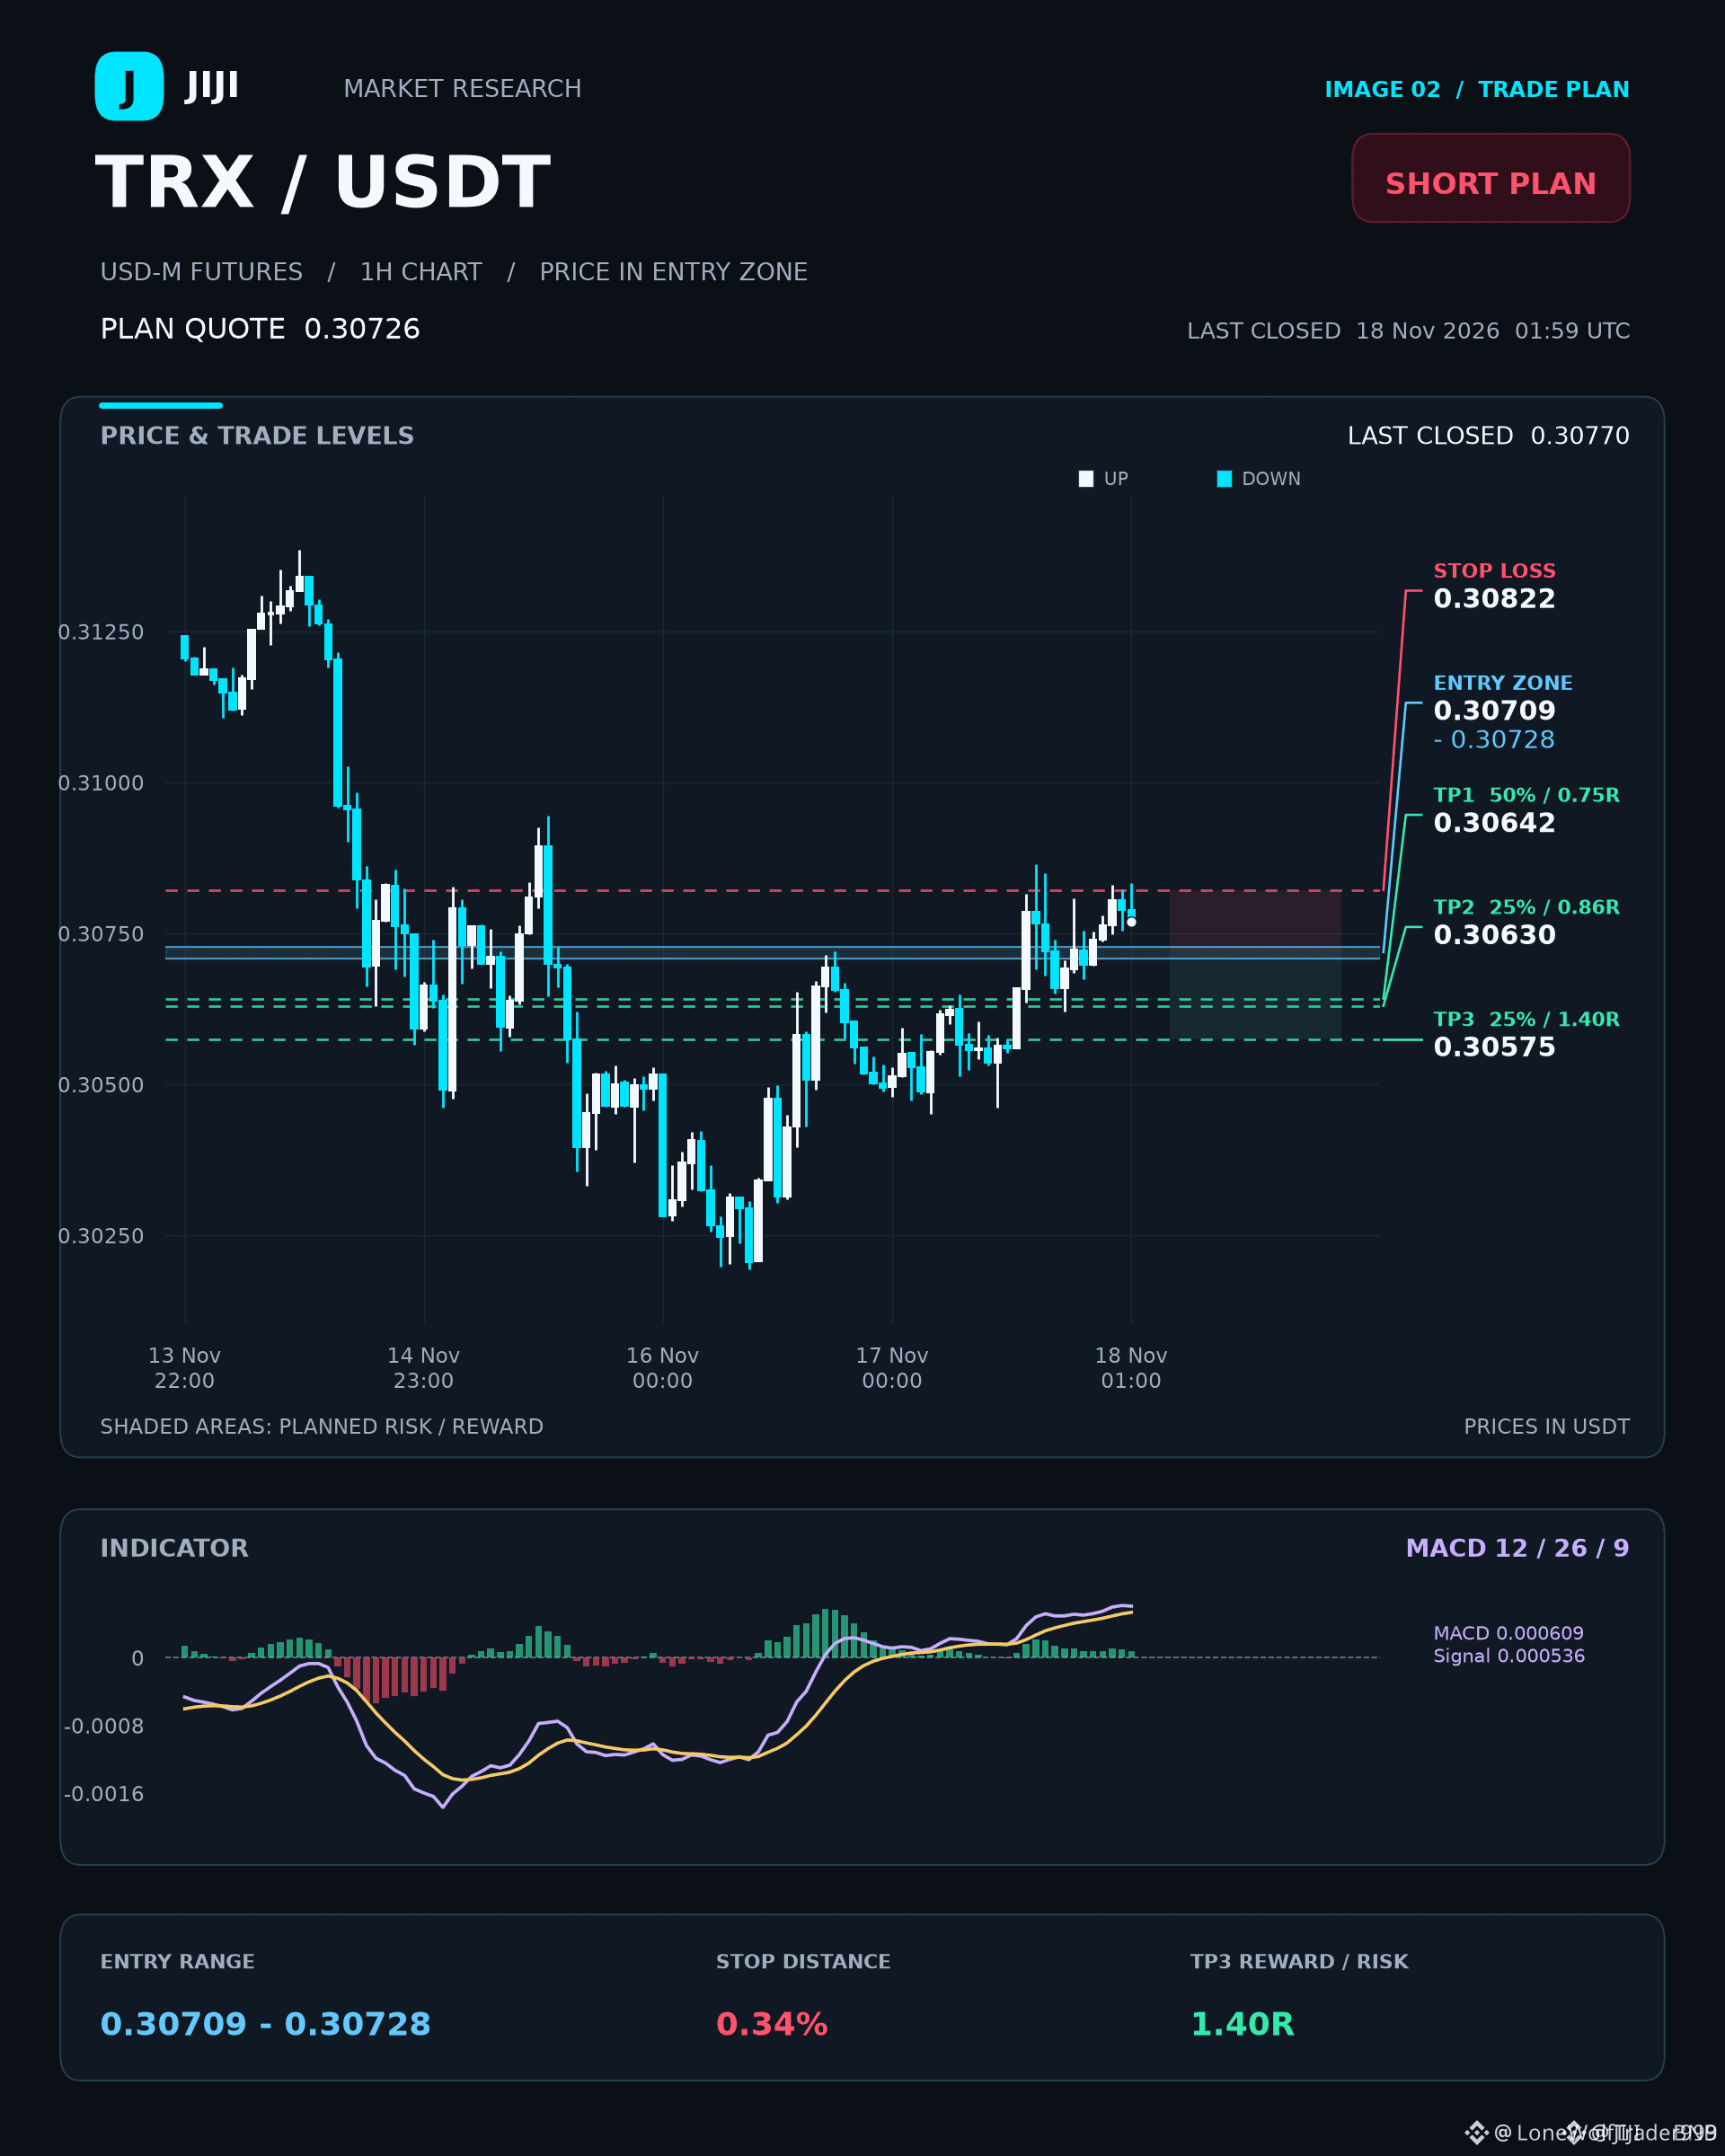
📉 $TRX BEARISH EMA STACK FLASHES A TIGHT SHORT SETUP ⚠️
Entry: 0.30718 ⚡
Target: 0.30575 🚀
Stop Loss: 0.30822 ⚠️
The four-hour chart shows sellers firmly in control with a heavy bearish moving average stack, while momentum tests local friction. 📊
Hourly RSI lingering near sixty suggests caution because momentum can push higher, meaning net margins demand surgical execution to clear fees and slippage. ⚡
Patience is key until a fifteen-minute candle confirms the breakdown. 🔍 Are you hunting this downside continuation or waiting for structure to shift? 👇
⚠️ Not financial advice. Always manage your risk. 🛡️
🏷️ #TRX #ShortSetup #Crypto #Trading #Futures
🔥 💎
📉 $TRX BEARISH EMA STACK FLASHES A TIGHT SHORT SETUP ⚠️
Entry: 0.30718 ⚡
Target: 0.30575 🚀
Stop Loss: 0.30822 ⚠️
The four-hour chart shows sellers firmly in control with a heavy bearish moving average stack, while momentum tests local friction. 📊
Hourly RSI lingering near sixty suggests caution because momentum can push higher, meaning net margins demand surgical execution to clear fees and slippage. ⚡
Patience is key until a fifteen-minute candle confirms the breakdown. 🔍 Are you hunting this downside continuation or waiting for structure to shift? 👇
⚠️ Not financial advice. Always manage your risk. 🛡️
🏷️ #TRX #ShortSetup #Crypto #Trading #Futures
🔥 💎
Entry: 0.30718 ⚡
Target: 0.30575 🚀
Stop Loss: 0.30822 ⚠️
The four-hour chart shows sellers firmly in control with a heavy bearish moving average stack, while momentum tests local friction. 📊
Hourly RSI lingering near sixty suggests caution because momentum can push higher, meaning net margins demand surgical execution to clear fees and slippage. ⚡
Patience is key until a fifteen-minute candle confirms the breakdown. 🔍 Are you hunting this downside continuation or waiting for structure to shift? 👇
⚠️ Not financial advice. Always manage your risk. 🛡️
🏷️ #TRX #ShortSetup #Crypto #Trading #Futures
🔥 💎
1

Article
See translation
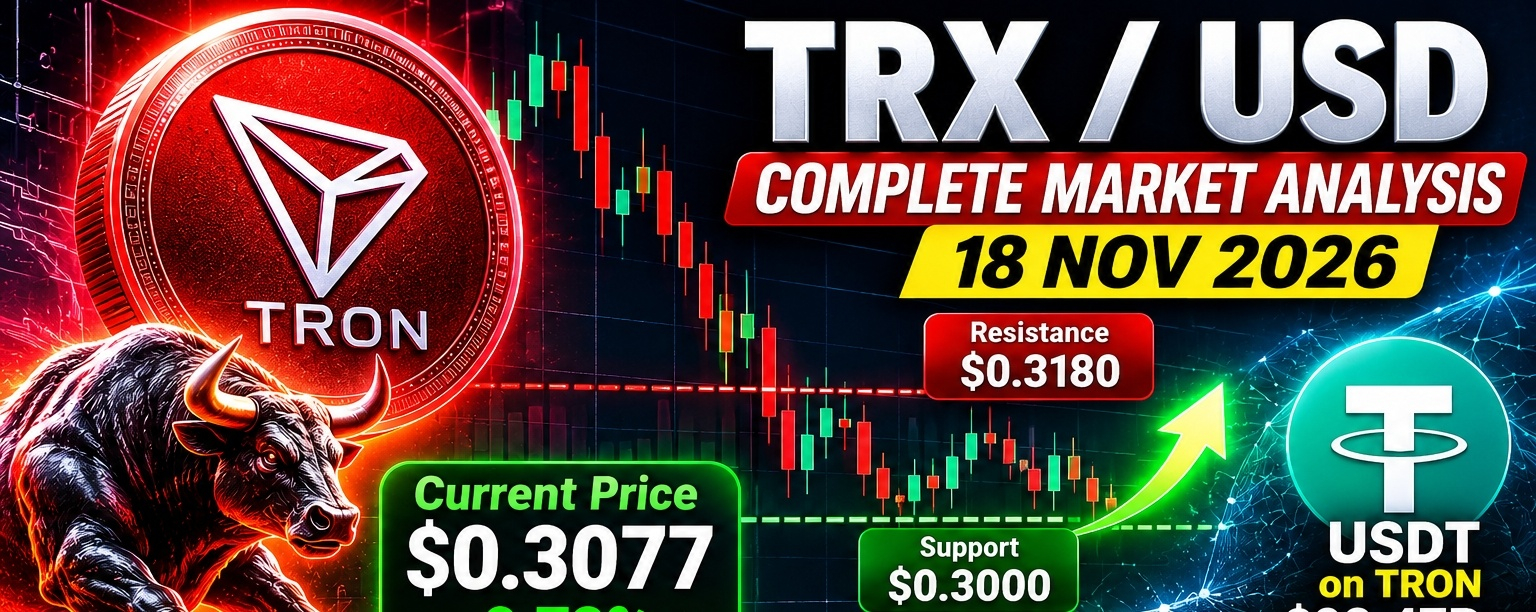
TRX / USD - Complete Analysis 18 Nov 2026 | Price: ∼$0.3077$TRX / USD - Complete Analysis 18 Nov 2026 | Price: ∼$0.3077
$TRX is the outlier in this market. While XRP is down -48% YTD and most altcoins are crashing, TRX is UP +6.51% YTD and +5.34% in 1 year. It is not rallying, but it is refusing to collapse.
This is a low-volatility, high-utility, bearish-consolidation coin right now. Boring price, incredibly strong network.
{spot}(TRXUSDT)
This is not financial advice.
1. Live Market Snapshot
| Metric | Value |
| --- | --- |
| Current Price | $0.3077 |
| 24h Range | $0.3048 - $0.3087 |
| 24h Change | +0.72% |
| Market Cap | ~$29.04B - Rank #8 |
| Circulating Supply | 95.04B TRX |
| Total Supply | 95.04B TRX |
| All-Time High | $0.4392 (4 Dec 2024) - now -30.0% below ATH |
Performance - This is the key story:
5 sessions: -3.17%
1 month: -8.09%
6 months: -14.03%
Year-to-date: +6.51%
1 year: +5.34%
Compare: XRP YTD -48%, TRX YTD +6.5%. TRX is holding up because its revenue does not depend on speculation.
Sentiment: Neutral 66%, Fear & Greed 12 - Extreme Fear (market-wide fear, not TRX-specific panic).
2. What Just Happened?
TRX has been in a very tight, boring range for 3 days:
15 Nov: $0.3069 - $0.3096 -> Close $0.3054
16 Nov: $0.3053 - $0.3074 -> Close $0.3052
17 Nov: $0.3052 - $0.3066 -> Close $0.3058
No crash, no pump. Just sideways grinding while the rest of crypto fell. US inflation data on 10 Nov pushed bond yields up and dampened risk appetite, which is keeping all coins capped.
3. Technical Analysis
Trend: Bearish on charts, Bullish on resilience
TRX trades 6.61% below its 200-day EMA at $0.32653, while the 50-day EMA has crossed $0.00197 below the 200-day line, completing a bearish crossover (Death Cross).
On the 4H chart, $TRX remains below both the H4 SMA-50 at $0.3122 and H4 SMA-200 at $0.3231, indicating a bearish medium-term structure even as price attempts to climb.
Technical rating: Strong Bearish on 4H, 1D, and 1W in automated models.
Momentum: Weak, Not Oversold
RSI (1D): 37.5 - 38
MACD: Bearish, histogram below zero
MA: Bearish
RSI 37 means selling pressure, but not oversold like XRP was at 17. TRX is slowly bleeding, not capitulating.
Key Levels
| Type | Level | Why it matters |
| --- | --- | --- |
| Strong Support | $0.2973 - $0.3000 | Major floor, monthly support, buy zone $0.2982 - $0.3036 |
| Support 1 | $0.3033 | Nearest support, S1 strength 89 |
| Support 2 | $0.3015 | 24h support |
| Resistance 1 | $0.3082 - $0.3110 | 4H Kijun + nearest resistance, only 0.9% above |
| Resistance 2 | $0.3092 - $0.3094 | R1 strength 87, 24h resistance |
| Resistance 3 | $0.3180 | Monthly resistance / December target |
| Major Resistance | $0.3231 - $0.3265 | 200 SMA + 200 EMA - must reclaim to flip bullish |
| Breakout Target | $0.3654 | Next major resistance if $0.32 breaks |
Highest-probability scenario: Base case at 45%, with Consolidation near current trend and a target range of $0.296 - $0.327.
24h forecast: Trade within $0.30752 - $0.30804, with 24h target $0.3040, support $0.3015, resistance $0.3094.
4. Fundamental Analysis - Why TRX Is Different
TRON is a Layer 1 blockchain founded in 2017 by Justin Sun. It uses Delegated Proof-of-Stake (DPoS) with 27 Super Representatives.
The #1 Reason TRX Holds Up: USDT
TRON is now the main network for USDT, the largest stablecoin.
USDT on Tron: $92.47B - $94.2B in circulation, 50.7% of all USDT
In Q3 2026, TRON overtook Ethereum for average USDT supply: $90.75B on TRON vs $87.73B on Ethereum
Average native stablecoin supply in Q3: $92.25B, up 4.18% QoQ and 14.58% YoY
In Q3 2026, TRON processed $2.21 Trillion in stablecoin settlement volume
TRON handled about 73% of stablecoin transaction volume in September 2026
Over 7 days in November: 16M+ USDT transfers, ~$177.8B in reported volume
Cumulative transaction value on TRON exceeded $30 Trillion
USDT makes up 98.5% of stablecoins on TRON. That is both its biggest strength and biggest risk.
Other Bullish Fundamentals
1. Real Revenue: In Q3 2026 the network created about 360M TRX and burned a large amount - TRX is deflationary when usage is high because fees burn TRX.
2. First US Spot Staked TRX ETF Launched: In Oct 2026, the first U.S. spot staked TRX ETF debuted, giving institutions regulated exposure + staking yield.
3. Institutional Adoption: Tron Inc., a Nasdaq-listed company backed by Justin Sun, became one of the 27... in Oct 2026, expanding institutional access.
4. Low Fees / Fast: 3-second blocks, bandwidth/energy model instead of high gas fees. Perfect for remittances and P2P payments in Asia, Africa, Latin America.
Bearish / Risk Factors
1. USDT Concentration Risk: If Tether ever has regulatory trouble, TRON is hit hardest.
2. Centralization + Justin Sun Risk: DPoS with 27 validators is more centralized than Bitcoin/Ethereum. Justin Sun is one of crypto's most controversial figures - reputation risk is real.
3. No Hype Narrative: TRX doesn't have meme, AI, or ETF hype like other coins. It grows slowly.
4. US Macro: Strong US inflation data keeps Tron vulnerable as rising funding costs dampen risk appetite.
5. Scenarios - What to Watch
🟢 Bullish Scenario (30% probability)
Trigger: Daily close above $0.3122 (H4 SMA-50), then above $0.3231
Target: $0.3180 -> $0.3265 -> $0.3654
Forecast: TRX could be $0.384 - $0.385 by end of 2026 in historical models, and $0.385 in 2027 in some forecasts.
🟡 Base / Sideways Scenario (45% probability - Most Likely)
Range: $0.3000 - $0.3180
November 2026 target is $0.3060 by end of month, with $0.3000 support and $0.3180 resistance framing the monthly channel. TRX keeps grinding sideways while USDT usage grows.
Projected for 2026: Trade between $0.2950 and $0.3300, with December target $0.3180.
🔴 Bearish Scenario (25% probability)
Trigger: Daily close below $0.2973 / $0.3000 with volume
Target: $0.2901 (stop zone) -> $0.28 -> $0.26
This would break the 2026 base and signal TRX finally joining the broader market sell-off.
6. Long-Term Outlook
| Year | Forecast Range / Target |
| --- | --- |
| Nov 2026 | $0.3000 - $0.3180, target $0.3060 |
| Dec 2026 | $0.3180 target, up to $0.385 in optimistic models |
| 2027 | $0.385 |
| 2030 | $0.510 |
| 2040 | $1.000 |
These are model forecasts, not guarantees. TRX moves slowly - it took 7 years to go from $0.01 to $0.30.
7. Strategy Summary (Not Advice)
For Traders:
TRX is a range-trading coin, not a breakout coin right now
Buy zone: $0.2982 - $0.3036, Stop: $0.2901, First target: $0.3239
Sell / Short zone: Near $0.3110 - $0.3180 if rejected
Do not expect 20% moves - TRX moves 1-2% per day
For Long-Term Holders / Staking:
TRX is one of the few coins where staking + real usage supports price
Its strength is defensive: it falls less in bear markets
Its weakness is offensive: it pumps less in bull markets
TRX vs XRP Quick Comparison:
| | TRX | XRP |
| --- | --- | --- |
| YTD | +6.51% | -48.33% |
| Use Case | USDT settlement | Cross-border bank payments |
| Volatility | Very Low | Very High |
| Risk | Centralization / USDT | Regulation / ETF flows |
Want me to do:
TRX vs XRP - which is better to buy now head-to-head?
TRX 1H / 4H scalp levels with exact entry / SL / TP?
TRX staking calculator - how much you earn if you stake 10,000 TRX?
#TRX #TRXUpdate #TRX/USDT❤️ #trxanalysis #TradingCommunity
TRX / USD - Complete Analysis 18 Nov 2026 | Price: ∼$0.3077
$TRX / USD - Complete Analysis 18 Nov 2026 | Price: ∼$0.3077
$TRX is the outlier in this market. While XRP is down -48% YTD and most altcoins are crashing, TRX is UP +6.51% YTD and +5.34% in 1 year. It is not rallying, but it is refusing to collapse.
This is a low-volatility, high-utility, bearish-consolidation coin right now. Boring price, incredibly strong network.
This is not financial advice.
1. Live Market Snapshot
| Metric | Value |
| --- | --- |
| Current Price | $0.3077 |
| 24h Range | $0.3048 - $0.3087 |
| 24h Change | +0.72% |
| Market Cap | ~$29.04B - Rank #8 |
| Circulating Supply | 95.04B TRX |
| Total Supply | 95.04B TRX |
| All-Time High | $0.4392 (4 Dec 2024) - now -30.0% below ATH |
Performance - This is the key story:
5 sessions: -3.17%
1 month: -8.09%
6 months: -14.03%
Year-to-date: +6.51%
1 year: +5.34%
Compare: XRP YTD -48%, TRX YTD +6.5%. TRX is holding up because its revenue does not depend on speculation.
Sentiment: Neutral 66%, Fear & Greed 12 - Extreme Fear (market-wide fear, not TRX-specific panic).
2. What Just Happened?
TRX has been in a very tight, boring range for 3 days:
15 Nov: $0.3069 - $0.3096 -> Close $0.3054
16 Nov: $0.3053 - $0.3074 -> Close $0.3052
17 Nov: $0.3052 - $0.3066 -> Close $0.3058
No crash, no pump. Just sideways grinding while the rest of crypto fell. US inflation data on 10 Nov pushed bond yields up and dampened risk appetite, which is keeping all coins capped.
3. Technical Analysis
Trend: Bearish on charts, Bullish on resilience
TRX trades 6.61% below its 200-day EMA at $0.32653, while the 50-day EMA has crossed $0.00197 below the 200-day line, completing a bearish crossover (Death Cross).
On the 4H chart, $TRX remains below both the H4 SMA-50 at $0.3122 and H4 SMA-200 at $0.3231, indicating a bearish medium-term structure even as price attempts to climb.
Technical rating: Strong Bearish on 4H, 1D, and 1W in automated models.
Momentum: Weak, Not Oversold
RSI (1D): 37.5 - 38
MACD: Bearish, histogram below zero
MA: Bearish
RSI 37 means selling pressure, but not oversold like XRP was at 17. TRX is slowly bleeding, not capitulating.
Key Levels
| Type | Level | Why it matters |
| --- | --- | --- |
| Strong Support | $0.2973 - $0.3000 | Major floor, monthly support, buy zone $0.2982 - $0.3036 |
| Support 1 | $0.3033 | Nearest support, S1 strength 89 |
| Support 2 | $0.3015 | 24h support |
| Resistance 1 | $0.3082 - $0.3110 | 4H Kijun + nearest resistance, only 0.9% above |
| Resistance 2 | $0.3092 - $0.3094 | R1 strength 87, 24h resistance |
| Resistance 3 | $0.3180 | Monthly resistance / December target |
| Major Resistance | $0.3231 - $0.3265 | 200 SMA + 200 EMA - must reclaim to flip bullish |
| Breakout Target | $0.3654 | Next major resistance if $0.32 breaks |
Highest-probability scenario: Base case at 45%, with Consolidation near current trend and a target range of $0.296 - $0.327.
24h forecast: Trade within $0.30752 - $0.30804, with 24h target $0.3040, support $0.3015, resistance $0.3094.
4. Fundamental Analysis - Why TRX Is Different
TRON is a Layer 1 blockchain founded in 2017 by Justin Sun. It uses Delegated Proof-of-Stake (DPoS) with 27 Super Representatives.
The #1 Reason TRX Holds Up: USDT
TRON is now the main network for USDT, the largest stablecoin.
USDT on Tron: $92.47B - $94.2B in circulation, 50.7% of all USDT
In Q3 2026, TRON overtook Ethereum for average USDT supply: $90.75B on TRON vs $87.73B on Ethereum
Average native stablecoin supply in Q3: $92.25B, up 4.18% QoQ and 14.58% YoY
In Q3 2026, TRON processed $2.21 Trillion in stablecoin settlement volume
TRON handled about 73% of stablecoin transaction volume in September 2026
Over 7 days in November: 16M+ USDT transfers, ~$177.8B in reported volume
Cumulative transaction value on TRON exceeded $30 Trillion
USDT makes up 98.5% of stablecoins on TRON. That is both its biggest strength and biggest risk.
Other Bullish Fundamentals
1. Real Revenue: In Q3 2026 the network created about 360M TRX and burned a large amount - TRX is deflationary when usage is high because fees burn TRX.
2. First US Spot Staked TRX ETF Launched: In Oct 2026, the first U.S. spot staked TRX ETF debuted, giving institutions regulated exposure + staking yield.
3. Institutional Adoption: Tron Inc., a Nasdaq-listed company backed by Justin Sun, became one of the 27... in Oct 2026, expanding institutional access.
4. Low Fees / Fast: 3-second blocks, bandwidth/energy model instead of high gas fees. Perfect for remittances and P2P payments in Asia, Africa, Latin America.
Bearish / Risk Factors
1. USDT Concentration Risk: If Tether ever has regulatory trouble, TRON is hit hardest.
2. Centralization + Justin Sun Risk: DPoS with 27 validators is more centralized than Bitcoin/Ethereum. Justin Sun is one of crypto's most controversial figures - reputation risk is real.
3. No Hype Narrative: TRX doesn't have meme, AI, or ETF hype like other coins. It grows slowly.
4. US Macro: Strong US inflation data keeps Tron vulnerable as rising funding costs dampen risk appetite.
5. Scenarios - What to Watch
🟢 Bullish Scenario (30% probability)
Trigger: Daily close above $0.3122 (H4 SMA-50), then above $0.3231
Target: $0.3180 -> $0.3265 -> $0.3654
Forecast: TRX could be $0.384 - $0.385 by end of 2026 in historical models, and $0.385 in 2027 in some forecasts.
🟡 Base / Sideways Scenario (45% probability - Most Likely)
Range: $0.3000 - $0.3180
November 2026 target is $0.3060 by end of month, with $0.3000 support and $0.3180 resistance framing the monthly channel. TRX keeps grinding sideways while USDT usage grows.
Projected for 2026: Trade between $0.2950 and $0.3300, with December target $0.3180.
🔴 Bearish Scenario (25% probability)
Trigger: Daily close below $0.2973 / $0.3000 with volume
Target: $0.2901 (stop zone) -> $0.28 -> $0.26
This would break the 2026 base and signal TRX finally joining the broader market sell-off.
6. Long-Term Outlook
| Year | Forecast Range / Target |
| --- | --- |
| Nov 2026 | $0.3000 - $0.3180, target $0.3060 |
| Dec 2026 | $0.3180 target, up to $0.385 in optimistic models |
| 2027 | $0.385 |
| 2030 | $0.510 |
| 2040 | $1.000 |
These are model forecasts, not guarantees. TRX moves slowly - it took 7 years to go from $0.01 to $0.30.
7. Strategy Summary (Not Advice)
For Traders:
TRX is a range-trading coin, not a breakout coin right now
Buy zone: $0.2982 - $0.3036, Stop: $0.2901, First target: $0.3239
Sell / Short zone: Near $0.3110 - $0.3180 if rejected
Do not expect 20% moves - TRX moves 1-2% per day
For Long-Term Holders / Staking:
TRX is one of the few coins where staking + real usage supports price
Its strength is defensive: it falls less in bear markets
Its weakness is offensive: it pumps less in bull markets
TRX vs XRP Quick Comparison:
| | TRX | XRP |
| --- | --- | --- |
| YTD | +6.51% | -48.33% |
| Use Case | USDT settlement | Cross-border bank payments |
| Volatility | Very Low | Very High |
| Risk | Centralization / USDT | Regulation / ETF flows |
Want me to do:
TRX vs XRP - which is better to buy now head-to-head?
TRX 1H / 4H scalp levels with exact entry / SL / TP?
TRX staking calculator - how much you earn if you stake 10,000 TRX?
#TRX #TRXUpdate #TRX/USDT❤️ #trxanalysis #TradingCommunity
$TRX is the outlier in this market. While XRP is down -48% YTD and most altcoins are crashing, TRX is UP +6.51% YTD and +5.34% in 1 year. It is not rallying, but it is refusing to collapse.
This is a low-volatility, high-utility, bearish-consolidation coin right now. Boring price, incredibly strong network.
This is not financial advice.
1. Live Market Snapshot
| Metric | Value |
| --- | --- |
| Current Price | $0.3077 |
| 24h Range | $0.3048 - $0.3087 |
| 24h Change | +0.72% |
| Market Cap | ~$29.04B - Rank #8 |
| Circulating Supply | 95.04B TRX |
| Total Supply | 95.04B TRX |
| All-Time High | $0.4392 (4 Dec 2024) - now -30.0% below ATH |
Performance - This is the key story:
5 sessions: -3.17%
1 month: -8.09%
6 months: -14.03%
Year-to-date: +6.51%
1 year: +5.34%
Compare: XRP YTD -48%, TRX YTD +6.5%. TRX is holding up because its revenue does not depend on speculation.
Sentiment: Neutral 66%, Fear & Greed 12 - Extreme Fear (market-wide fear, not TRX-specific panic).
2. What Just Happened?
TRX has been in a very tight, boring range for 3 days:
15 Nov: $0.3069 - $0.3096 -> Close $0.3054
16 Nov: $0.3053 - $0.3074 -> Close $0.3052
17 Nov: $0.3052 - $0.3066 -> Close $0.3058
No crash, no pump. Just sideways grinding while the rest of crypto fell. US inflation data on 10 Nov pushed bond yields up and dampened risk appetite, which is keeping all coins capped.
3. Technical Analysis
Trend: Bearish on charts, Bullish on resilience
TRX trades 6.61% below its 200-day EMA at $0.32653, while the 50-day EMA has crossed $0.00197 below the 200-day line, completing a bearish crossover (Death Cross).
On the 4H chart, $TRX remains below both the H4 SMA-50 at $0.3122 and H4 SMA-200 at $0.3231, indicating a bearish medium-term structure even as price attempts to climb.
Technical rating: Strong Bearish on 4H, 1D, and 1W in automated models.
Momentum: Weak, Not Oversold
RSI (1D): 37.5 - 38
MACD: Bearish, histogram below zero
MA: Bearish
RSI 37 means selling pressure, but not oversold like XRP was at 17. TRX is slowly bleeding, not capitulating.
Key Levels
| Type | Level | Why it matters |
| --- | --- | --- |
| Strong Support | $0.2973 - $0.3000 | Major floor, monthly support, buy zone $0.2982 - $0.3036 |
| Support 1 | $0.3033 | Nearest support, S1 strength 89 |
| Support 2 | $0.3015 | 24h support |
| Resistance 1 | $0.3082 - $0.3110 | 4H Kijun + nearest resistance, only 0.9% above |
| Resistance 2 | $0.3092 - $0.3094 | R1 strength 87, 24h resistance |
| Resistance 3 | $0.3180 | Monthly resistance / December target |
| Major Resistance | $0.3231 - $0.3265 | 200 SMA + 200 EMA - must reclaim to flip bullish |
| Breakout Target | $0.3654 | Next major resistance if $0.32 breaks |
Highest-probability scenario: Base case at 45%, with Consolidation near current trend and a target range of $0.296 - $0.327.
24h forecast: Trade within $0.30752 - $0.30804, with 24h target $0.3040, support $0.3015, resistance $0.3094.
4. Fundamental Analysis - Why TRX Is Different
TRON is a Layer 1 blockchain founded in 2017 by Justin Sun. It uses Delegated Proof-of-Stake (DPoS) with 27 Super Representatives.
The #1 Reason TRX Holds Up: USDT
TRON is now the main network for USDT, the largest stablecoin.
USDT on Tron: $92.47B - $94.2B in circulation, 50.7% of all USDT
In Q3 2026, TRON overtook Ethereum for average USDT supply: $90.75B on TRON vs $87.73B on Ethereum
Average native stablecoin supply in Q3: $92.25B, up 4.18% QoQ and 14.58% YoY
In Q3 2026, TRON processed $2.21 Trillion in stablecoin settlement volume
TRON handled about 73% of stablecoin transaction volume in September 2026
Over 7 days in November: 16M+ USDT transfers, ~$177.8B in reported volume
Cumulative transaction value on TRON exceeded $30 Trillion
USDT makes up 98.5% of stablecoins on TRON. That is both its biggest strength and biggest risk.
Other Bullish Fundamentals
1. Real Revenue: In Q3 2026 the network created about 360M TRX and burned a large amount - TRX is deflationary when usage is high because fees burn TRX.
2. First US Spot Staked TRX ETF Launched: In Oct 2026, the first U.S. spot staked TRX ETF debuted, giving institutions regulated exposure + staking yield.
3. Institutional Adoption: Tron Inc., a Nasdaq-listed company backed by Justin Sun, became one of the 27... in Oct 2026, expanding institutional access.
4. Low Fees / Fast: 3-second blocks, bandwidth/energy model instead of high gas fees. Perfect for remittances and P2P payments in Asia, Africa, Latin America.
Bearish / Risk Factors
1. USDT Concentration Risk: If Tether ever has regulatory trouble, TRON is hit hardest.
2. Centralization + Justin Sun Risk: DPoS with 27 validators is more centralized than Bitcoin/Ethereum. Justin Sun is one of crypto's most controversial figures - reputation risk is real.
3. No Hype Narrative: TRX doesn't have meme, AI, or ETF hype like other coins. It grows slowly.
4. US Macro: Strong US inflation data keeps Tron vulnerable as rising funding costs dampen risk appetite.
5. Scenarios - What to Watch
🟢 Bullish Scenario (30% probability)
Trigger: Daily close above $0.3122 (H4 SMA-50), then above $0.3231
Target: $0.3180 -> $0.3265 -> $0.3654
Forecast: TRX could be $0.384 - $0.385 by end of 2026 in historical models, and $0.385 in 2027 in some forecasts.
🟡 Base / Sideways Scenario (45% probability - Most Likely)
Range: $0.3000 - $0.3180
November 2026 target is $0.3060 by end of month, with $0.3000 support and $0.3180 resistance framing the monthly channel. TRX keeps grinding sideways while USDT usage grows.
Projected for 2026: Trade between $0.2950 and $0.3300, with December target $0.3180.
🔴 Bearish Scenario (25% probability)
Trigger: Daily close below $0.2973 / $0.3000 with volume
Target: $0.2901 (stop zone) -> $0.28 -> $0.26
This would break the 2026 base and signal TRX finally joining the broader market sell-off.
6. Long-Term Outlook
| Year | Forecast Range / Target |
| --- | --- |
| Nov 2026 | $0.3000 - $0.3180, target $0.3060 |
| Dec 2026 | $0.3180 target, up to $0.385 in optimistic models |
| 2027 | $0.385 |
| 2030 | $0.510 |
| 2040 | $1.000 |
These are model forecasts, not guarantees. TRX moves slowly - it took 7 years to go from $0.01 to $0.30.
7. Strategy Summary (Not Advice)
For Traders:
TRX is a range-trading coin, not a breakout coin right now
Buy zone: $0.2982 - $0.3036, Stop: $0.2901, First target: $0.3239
Sell / Short zone: Near $0.3110 - $0.3180 if rejected
Do not expect 20% moves - TRX moves 1-2% per day
For Long-Term Holders / Staking:
TRX is one of the few coins where staking + real usage supports price
Its strength is defensive: it falls less in bear markets
Its weakness is offensive: it pumps less in bull markets
TRX vs XRP Quick Comparison:
| | TRX | XRP |
| --- | --- | --- |
| YTD | +6.51% | -48.33% |
| Use Case | USDT settlement | Cross-border bank payments |
| Volatility | Very Low | Very High |
| Risk | Centralization / USDT | Regulation / ETF flows |
Want me to do:
TRX vs XRP - which is better to buy now head-to-head?
TRX 1H / 4H scalp levels with exact entry / SL / TP?
TRX staking calculator - how much you earn if you stake 10,000 TRX?
#TRX #TRXUpdate #TRX/USDT❤️ #trxanalysis #TradingCommunity
89

·
--
See translation
$TRX — A Coin Worth Watching
$TRX continues to attract attention because of its role in the TRON ecosystem and its use in blockchain transactions.
For traders, the important question is whether TRX can maintain its current price structure and attract fresh buying interest.
A sustained move above resistance could open the door to further upside, but losing key support may weaken the short-term outlook.
No need to rush into a trade. Let the chart confirm the direction first.
Are you holding $TRX or waiting for a better entry?
#TRX #TRON #CryptoTrading
$TRX — A Coin Worth Watching
$TRX continues to attract attention because of its role in the TRON ecosystem and its use in blockchain transactions.
For traders, the important question is whether TRX can maintain its current price structure and attract fresh buying interest.
A sustained move above resistance could open the door to further upside, but losing key support may weaken the short-term outlook.
No need to rush into a trade. Let the chart confirm the direction first.
Are you holding $TRX or waiting for a better entry?
#TRX #TRON #CryptoTrading
$TRX continues to attract attention because of its role in the TRON ecosystem and its use in blockchain transactions.
For traders, the important question is whether TRX can maintain its current price structure and attract fresh buying interest.
A sustained move above resistance could open the door to further upside, but losing key support may weaken the short-term outlook.
No need to rush into a trade. Let the chart confirm the direction first.
Are you holding $TRX or waiting for a better entry?
#TRX #TRON #CryptoTrading
2
1
112

·
--
See translation
watching $TRX, gave a controlled pullback and the trend is trying to continue
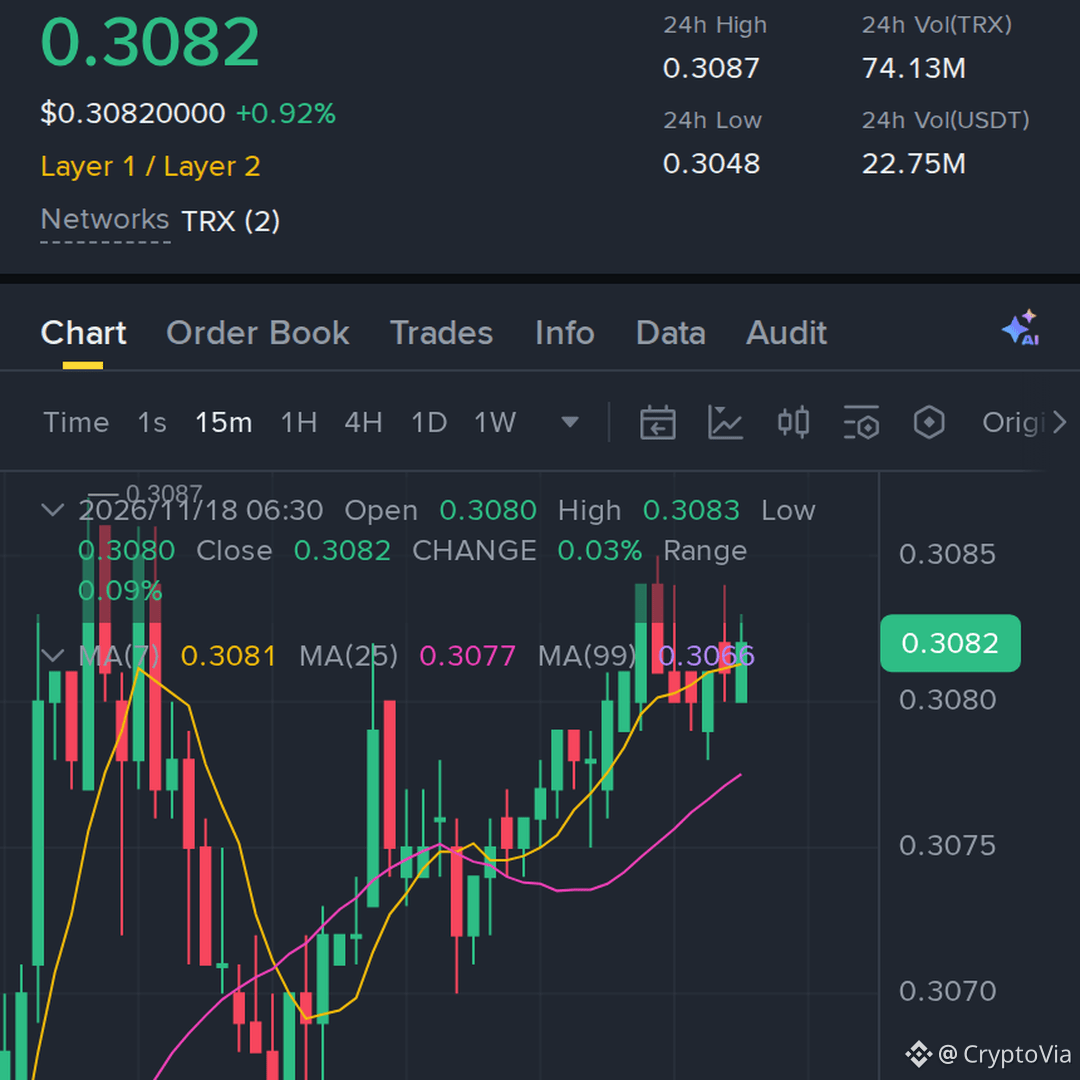
The 24-hour move stands at +0.92%, with the latest price near 0.3082. The faster average is holding over the slower one, so buyers still have the trend advantage for now. RSI is 65.1, which points to positive momentum without being deeply overbought. Volume is only about 0.4x its recent average, so stronger participation would help confirm the move. The recent support area is around 0.307, while resistance is near 0.3085. For the long, the entry band gives a defined pullback area to assess instead of buying a stretched candle.
Long setup | Spot chart | 15M
Entry: 0.3081–0.3082
TP1: 0.3151 / TP2: 0.3211 / TP3: 0.3304
Stop Loss: 0.3032
#TRX #crypto #binance #Write2Earn!
watching $TRX , gave a controlled pullback and the trend is trying to continue
The 24-hour move stands at +0.92%, with the latest price near 0.3082. The faster average is holding over the slower one, so buyers still have the trend advantage for now. RSI is 65.1, which points to positive momentum without being deeply overbought. Volume is only about 0.4x its recent average, so stronger participation would help confirm the move. The recent support area is around 0.307, while resistance is near 0.3085. For the long, the entry band gives a defined pullback area to assess instead of buying a stretched candle.
Long setup | Spot chart | 15M
Entry: 0.3081–0.3082
TP1: 0.3151 / TP2: 0.3211 / TP3: 0.3304
Stop Loss: 0.3032
#TRX #crypto #binance #Write2Earn!
The 24-hour move stands at +0.92%, with the latest price near 0.3082. The faster average is holding over the slower one, so buyers still have the trend advantage for now. RSI is 65.1, which points to positive momentum without being deeply overbought. Volume is only about 0.4x its recent average, so stronger participation would help confirm the move. The recent support area is around 0.307, while resistance is near 0.3085. For the long, the entry band gives a defined pullback area to assess instead of buying a stretched candle.
Long setup | Spot chart | 15M
Entry: 0.3081–0.3082
TP1: 0.3151 / TP2: 0.3211 / TP3: 0.3304
Stop Loss: 0.3032
#TRX #crypto #binance #Write2Earn!
90

·
--
See translation
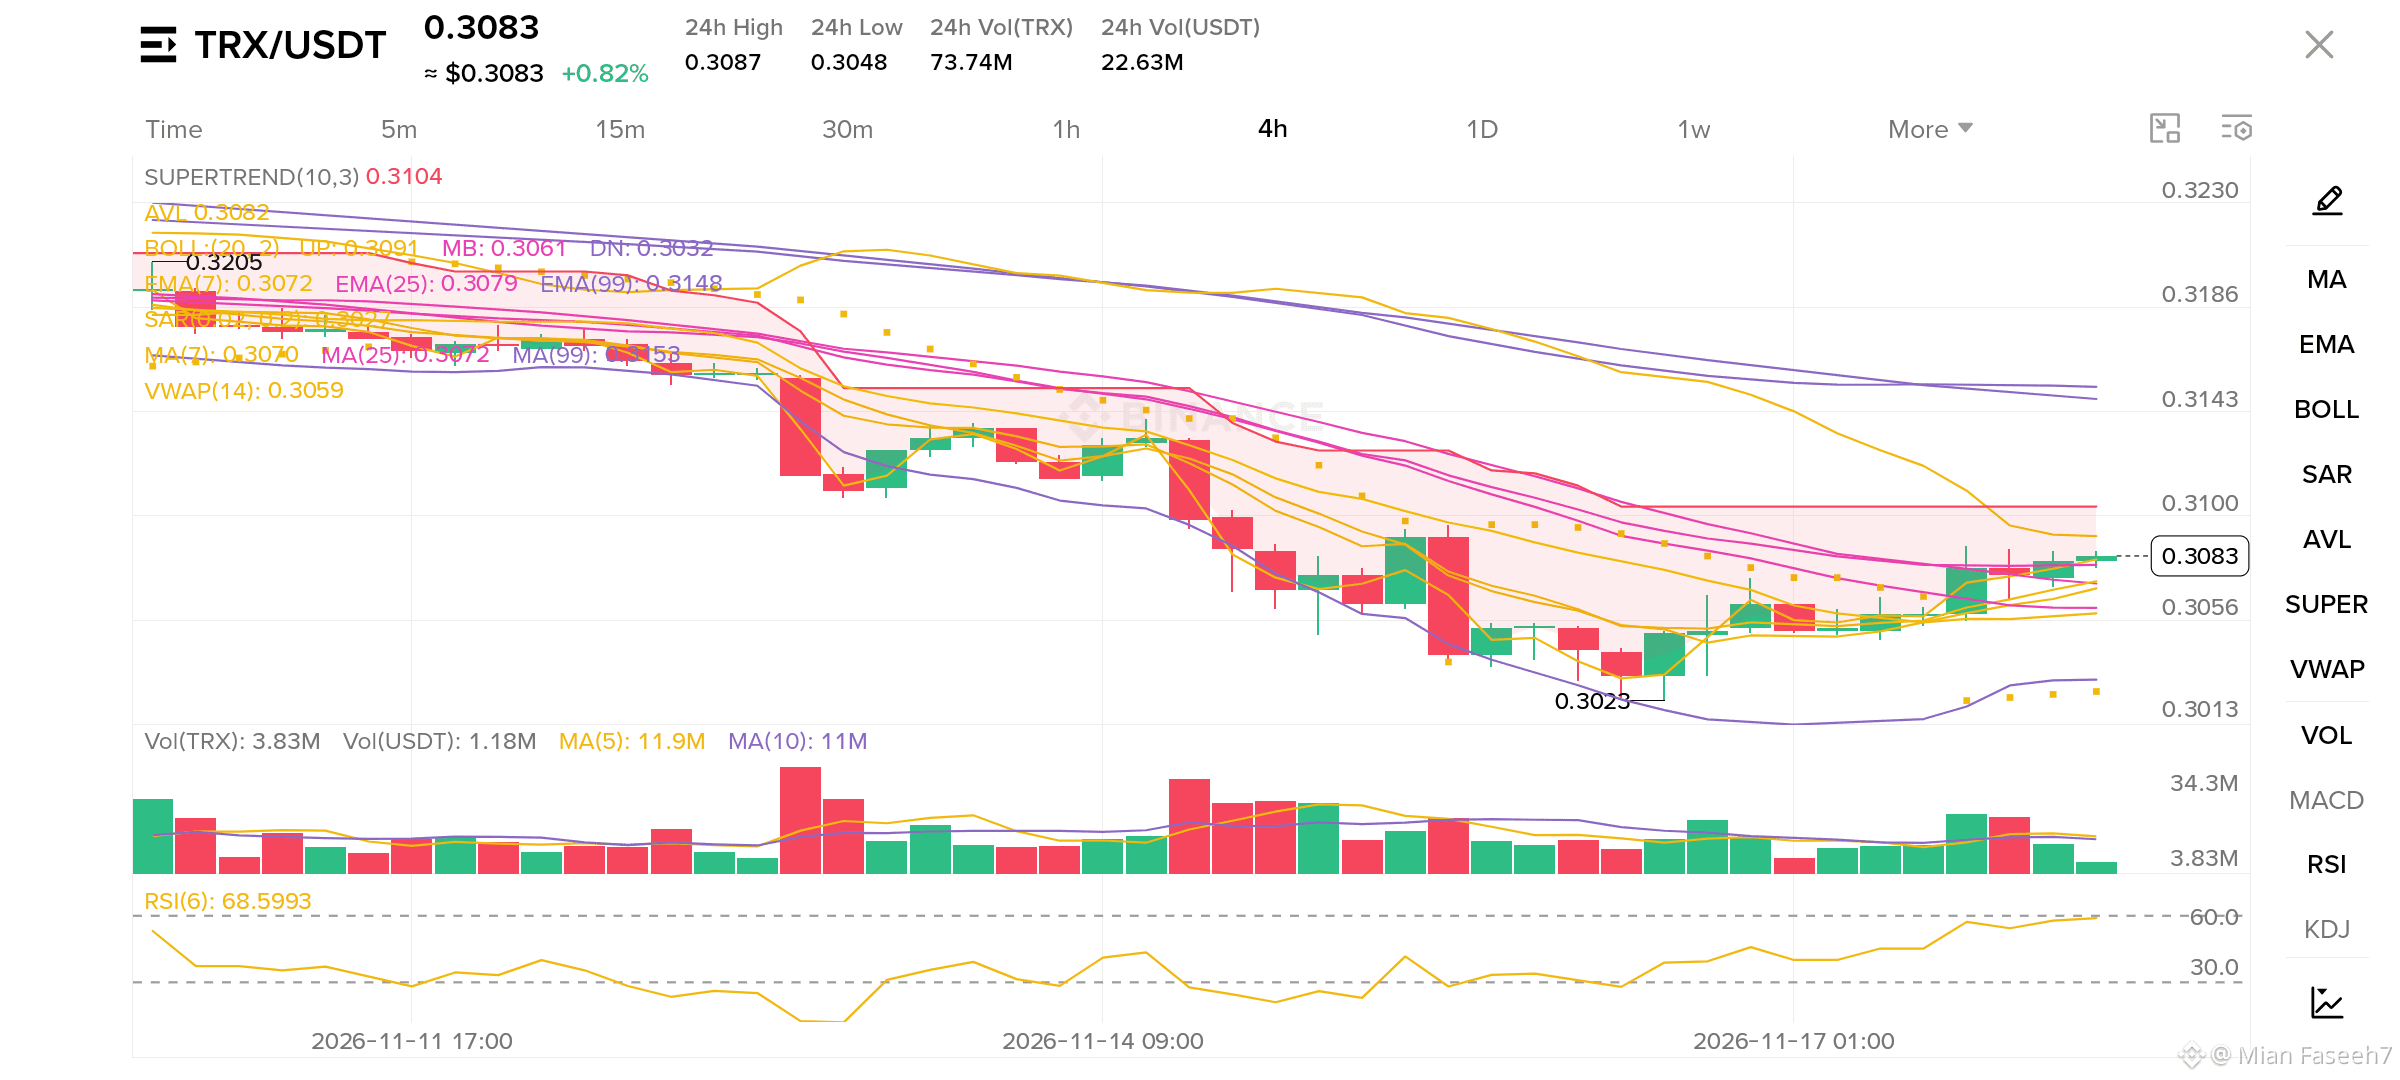
$TRX is trading at $0.3083 after rising from $0.3048 low. Buyers pushed it up and now TRX is trying to hold near its 24h high.
Right now $TRX is still below Supertrend $0.3104, so $0.3104 is the main resistance. RSI is at 68.60, which means TRX is near overbought zone, buyers are strong but a small pullback can come.
If $TRX holds above $0.3048, the next target is $0.3087 and then $0.3104. If it breaks below $0.3048, then we can see $0.3025 again.
I am still holding TRX here, this move looks strong. What about you guys? Are you holding TRX or booking profit here?
Follow for daily TRX updates and simple analysis.
{spot}(TRXUSDT)
If this analysis helped you, a small Tip is appreciated 🙏
#TRX #Tron #Crypto #BinanceSquare
$TRX is trading at $0.3083 after rising from $0.3048 low. Buyers pushed it up and now TRX is trying to hold near its 24h high.
Right now $TRX is still below Supertrend $0.3104, so $0.3104 is the main resistance. RSI is at 68.60, which means TRX is near overbought zone, buyers are strong but a small pullback can come.
If $TRX holds above $0.3048, the next target is $0.3087 and then $0.3104. If it breaks below $0.3048, then we can see $0.3025 again.
I am still holding TRX here, this move looks strong. What about you guys? Are you holding TRX or booking profit here?
Follow for daily TRX updates and simple analysis.
If this analysis helped you, a small Tip is appreciated 🙏
#TRX #Tron #Crypto #BinanceSquare
Right now $TRX is still below Supertrend $0.3104, so $0.3104 is the main resistance. RSI is at 68.60, which means TRX is near overbought zone, buyers are strong but a small pullback can come.
If $TRX holds above $0.3048, the next target is $0.3087 and then $0.3104. If it breaks below $0.3048, then we can see $0.3025 again.
I am still holding TRX here, this move looks strong. What about you guys? Are you holding TRX or booking profit here?
Follow for daily TRX updates and simple analysis.
If this analysis helped you, a small Tip is appreciated 🙏
#TRX #Tron #Crypto #BinanceSquare
1
140
·
--
See translation
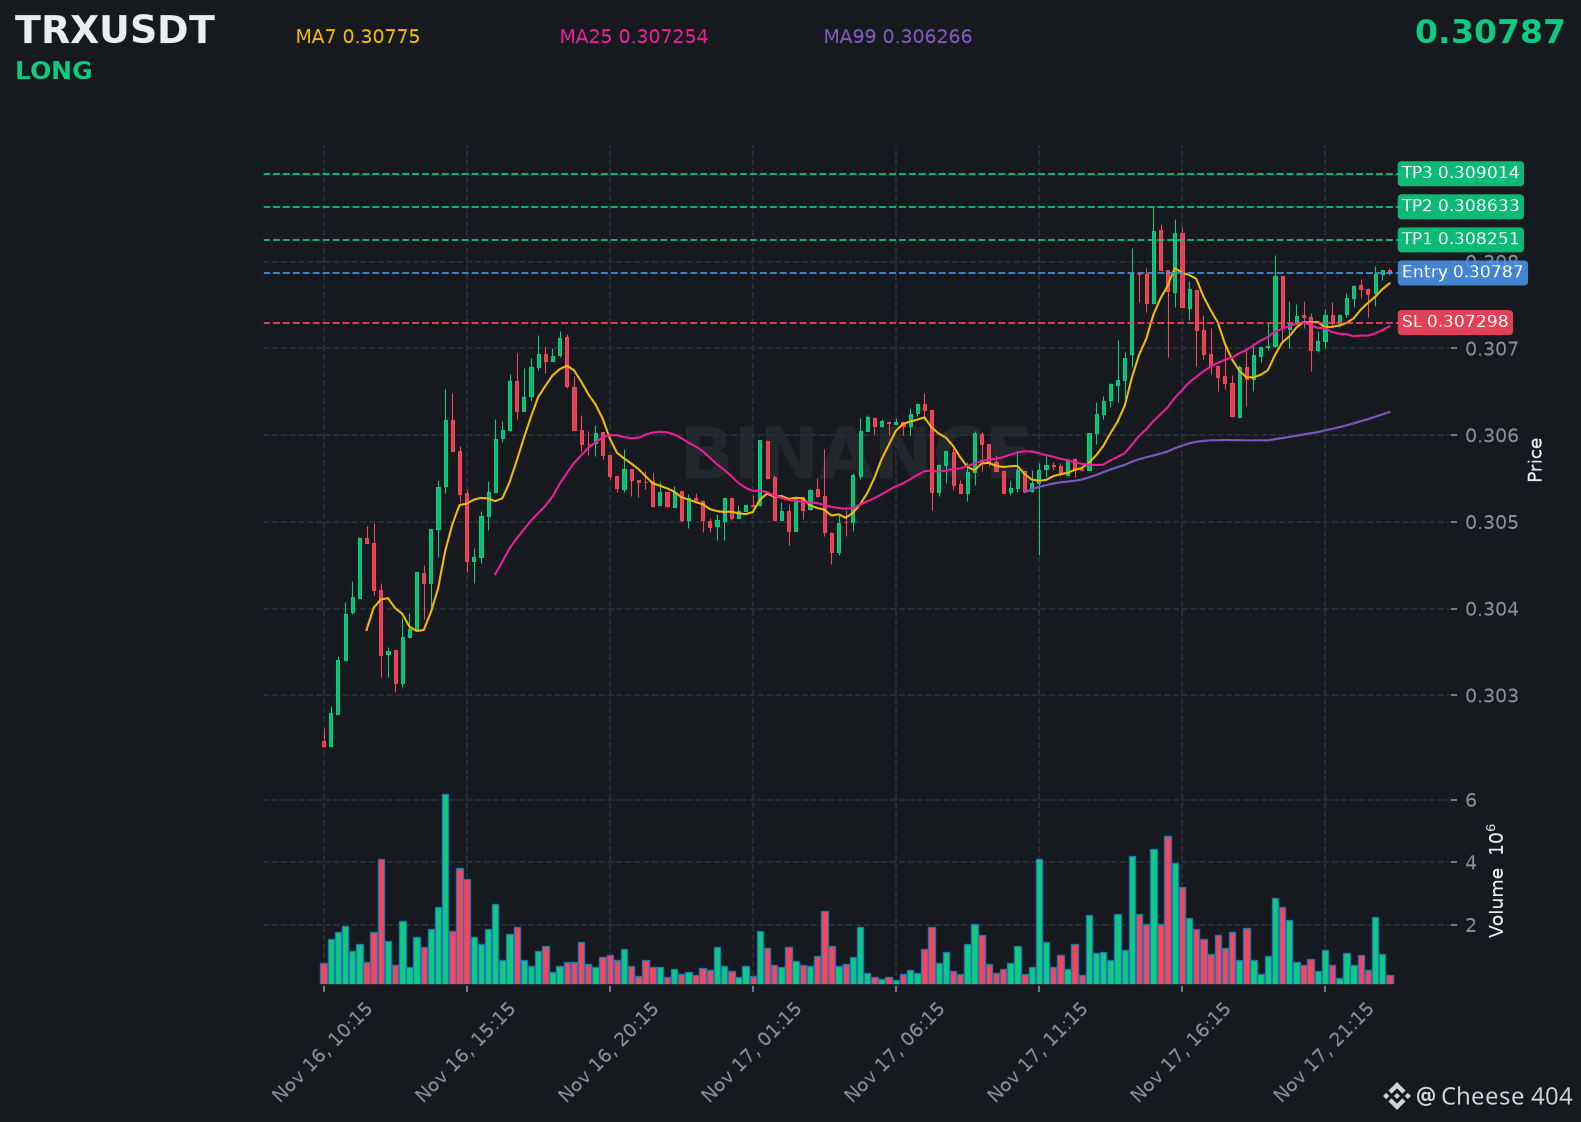
$TRX just printed a strong bullish candle, signaling more upside pressure building right now.
📍 @ 0.30787 | Volume: 0.13M USD
RSI 61 | EMA20: 0.307466 USD
📈 Trade Plan:
📈 Entry: 0.307756 – 0.307984
🛑 Stop Loss: 0.307298
🎯 TP1: 0.308251
🎯 TP2: 0.308633
🎯 TP3: 0.309014
Waiting for a retest, then riding the uptrend.
👉 $TRX 👈 Catch it
#TRX
$TRX just printed a strong bullish candle, signaling more upside pressure building right now.
📍 @ 0.30787 | Volume: 0.13M USD
RSI 61 | EMA20: 0.307466 USD
📈 Trade Plan:
📈 Entry: 0.307756 – 0.307984
🛑 Stop Loss: 0.307298
🎯 TP1: 0.308251
🎯 TP2: 0.308633
🎯 TP3: 0.309014
Waiting for a retest, then riding the uptrend.
👉 $TRX 👈 Catch it
#TRX
📍 @ 0.30787 | Volume: 0.13M USD
RSI 61 | EMA20: 0.307466 USD
📈 Trade Plan:
📈 Entry: 0.307756 – 0.307984
🛑 Stop Loss: 0.307298
🎯 TP1: 0.308251
🎯 TP2: 0.308633
🎯 TP3: 0.309014
Waiting for a retest, then riding the uptrend.
👉 $TRX 👈 Catch it
#TRX
90

See translation
🔴 $TRX — SHORT
📍 Entry 0.30787
🛑 Stop 0.30964 (-0.57%)
🎯 TP1 0.306331 (+0.50%)
⚖️ R:R 0.87 · continuation
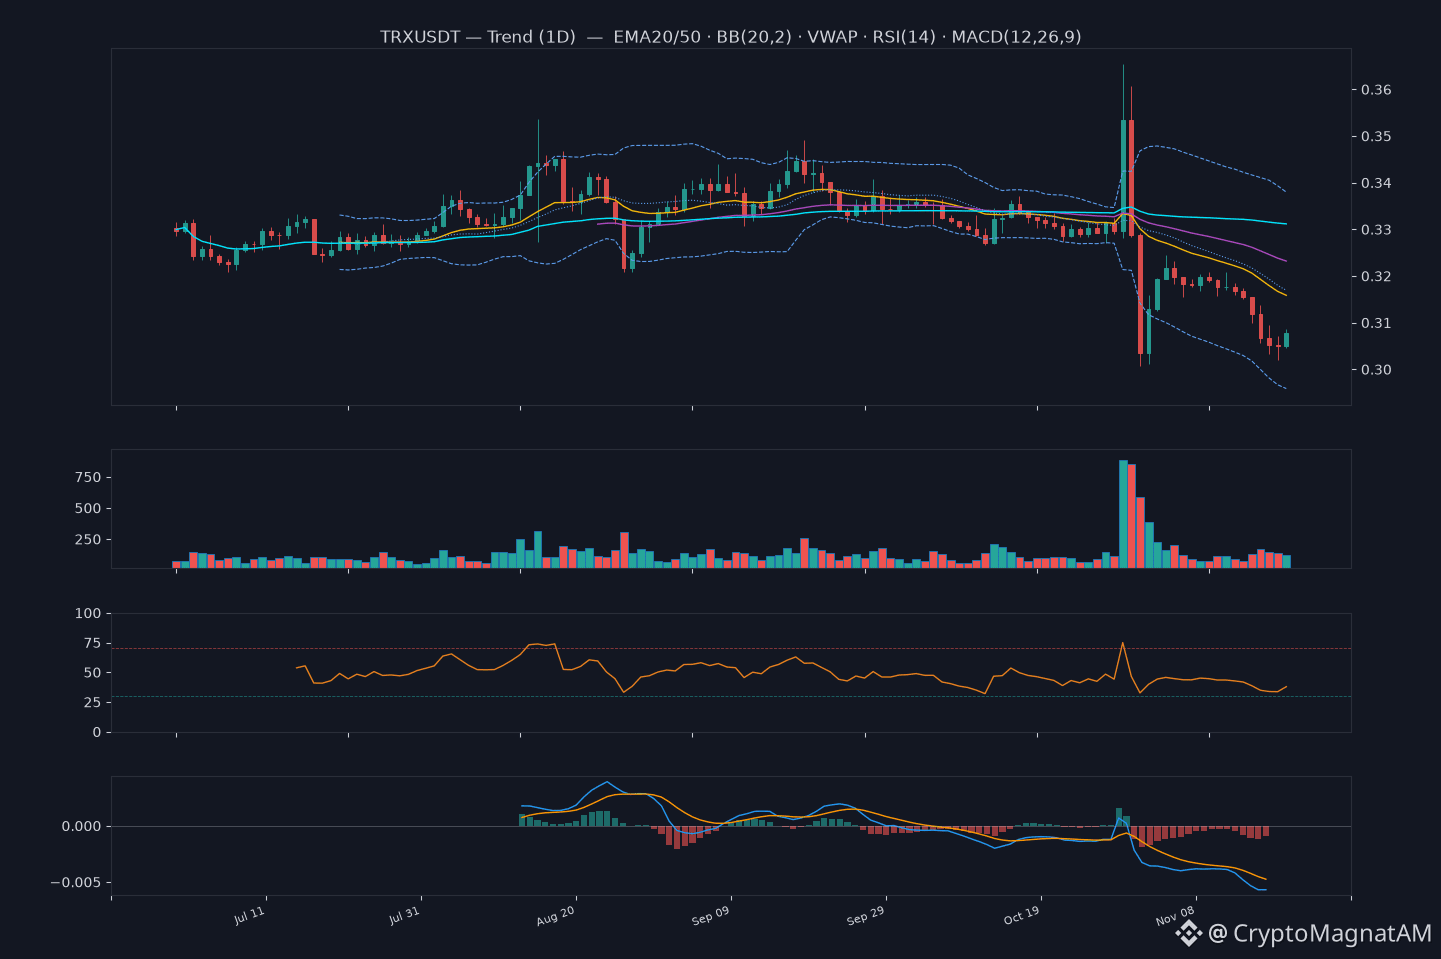
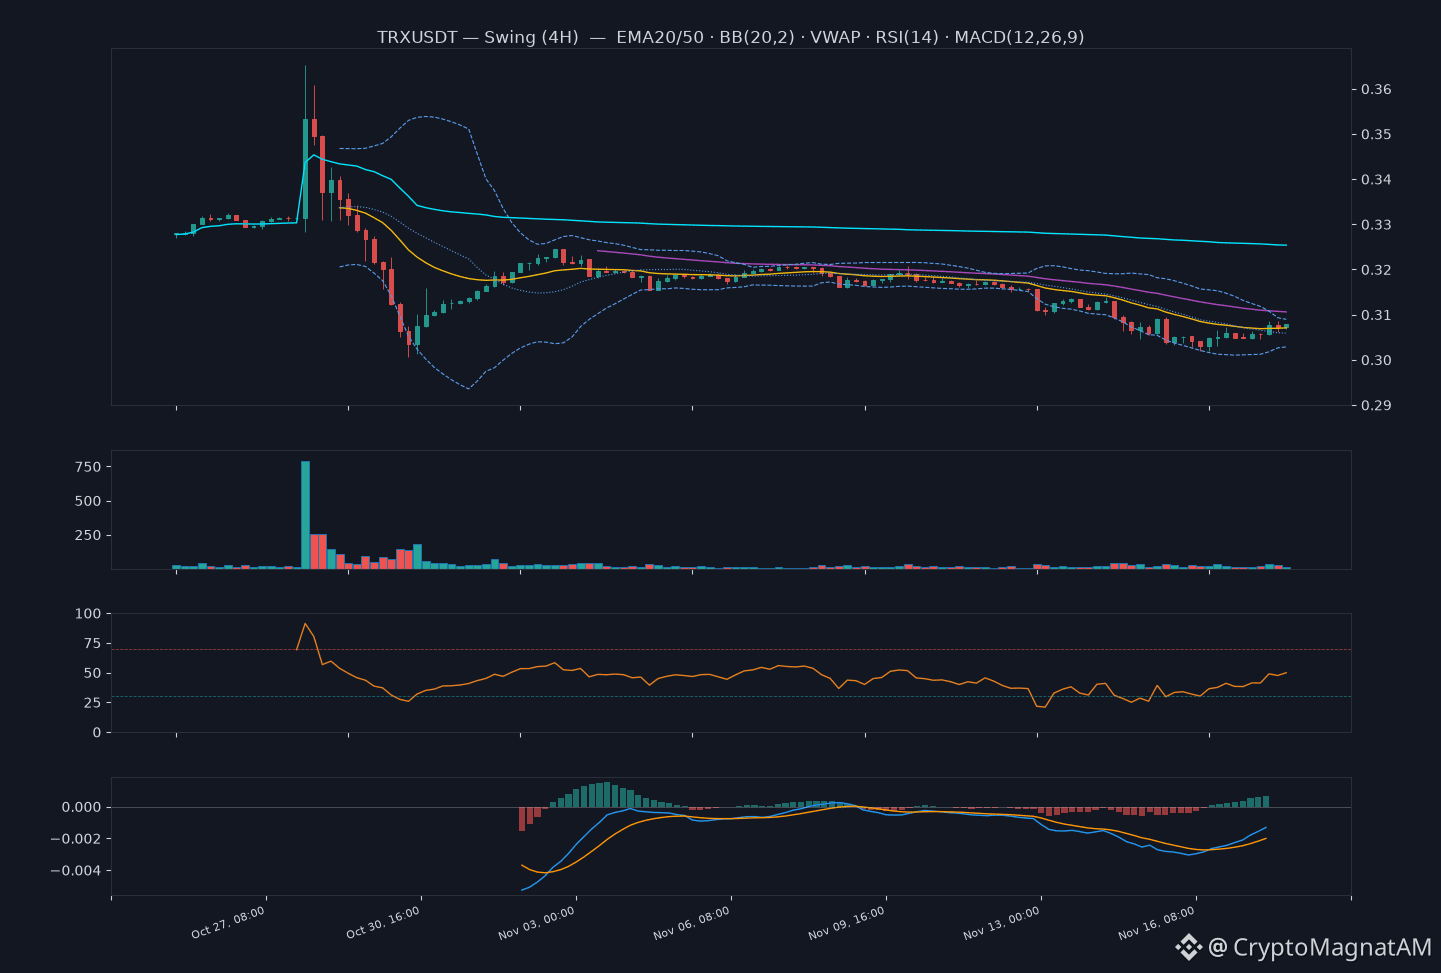
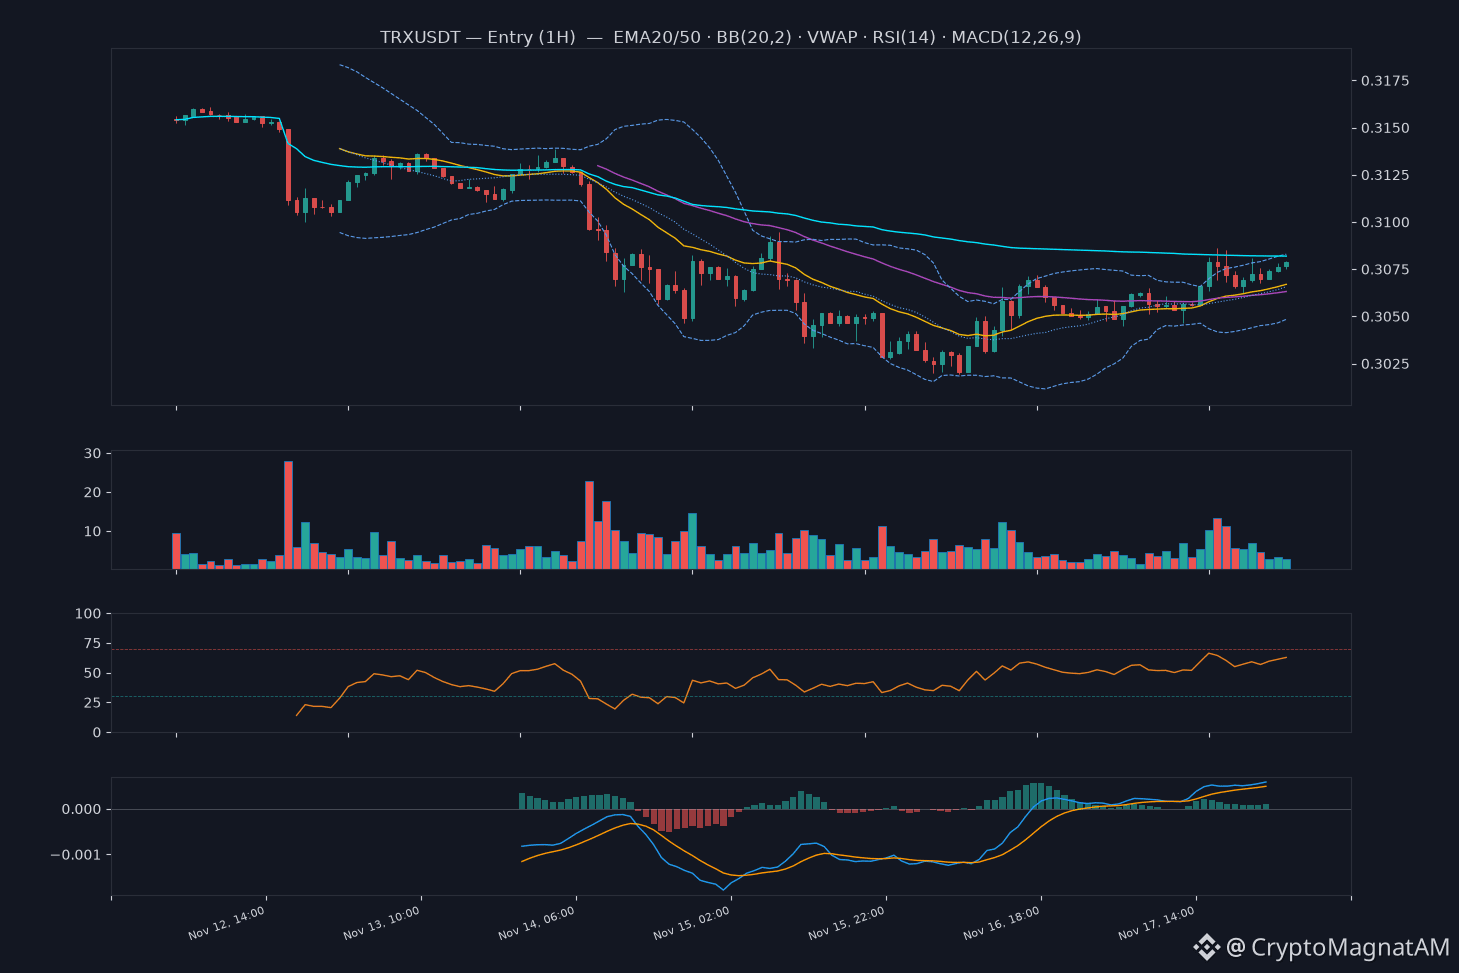
🧠 The 4h and 1d trend lower below falling EMA50s, and the 1h bounce off the 5-touch 1h:S:1 is stalling just under 1h:R:1 and anchored VWAP, with a fading MACD histogram and falling volume. The stop sits above 1h:R:1 at about 1.9 ATR. TP1 fronts 1h:S:1 at about 2.6 ATR, and the runners sit at the 1d:S:1 zone and near the 0.3019 swing low.
📊 1D / 4H / 1H charts attached.
#trx #crypto #signals
🔴 $TRX — SHORT
📍 Entry 0.30787
🛑 Stop 0.30964 (-0.57%)
🎯 TP1 0.306331 (+0.50%)
⚖️ R:R 0.87 · continuation
🧠 The 4h and 1d trend lower below falling EMA50s, and the 1h bounce off the 5-touch 1h:S:1 is stalling just under 1h:R:1 and anchored VWAP, with a fading MACD histogram and falling volume. The stop sits above 1h:R:1 at about 1.9 ATR. TP1 fronts 1h:S:1 at about 2.6 ATR, and the runners sit at the 1d:S:1 zone and near the 0.3019 swing low.
📊 1D / 4H / 1H charts attached.
#trx #crypto #signals
📍 Entry 0.30787
🛑 Stop 0.30964 (-0.57%)
🎯 TP1 0.306331 (+0.50%)
⚖️ R:R 0.87 · continuation
🧠 The 4h and 1d trend lower below falling EMA50s, and the 1h bounce off the 5-touch 1h:S:1 is stalling just under 1h:R:1 and anchored VWAP, with a fading MACD histogram and falling volume. The stop sits above 1h:R:1 at about 1.9 ATR. TP1 fronts 1h:S:1 at about 2.6 ATR, and the runners sit at the 1d:S:1 zone and near the 0.3019 swing low.
📊 1D / 4H / 1H charts attached.
#trx #crypto #signals
49

·
--
See translation
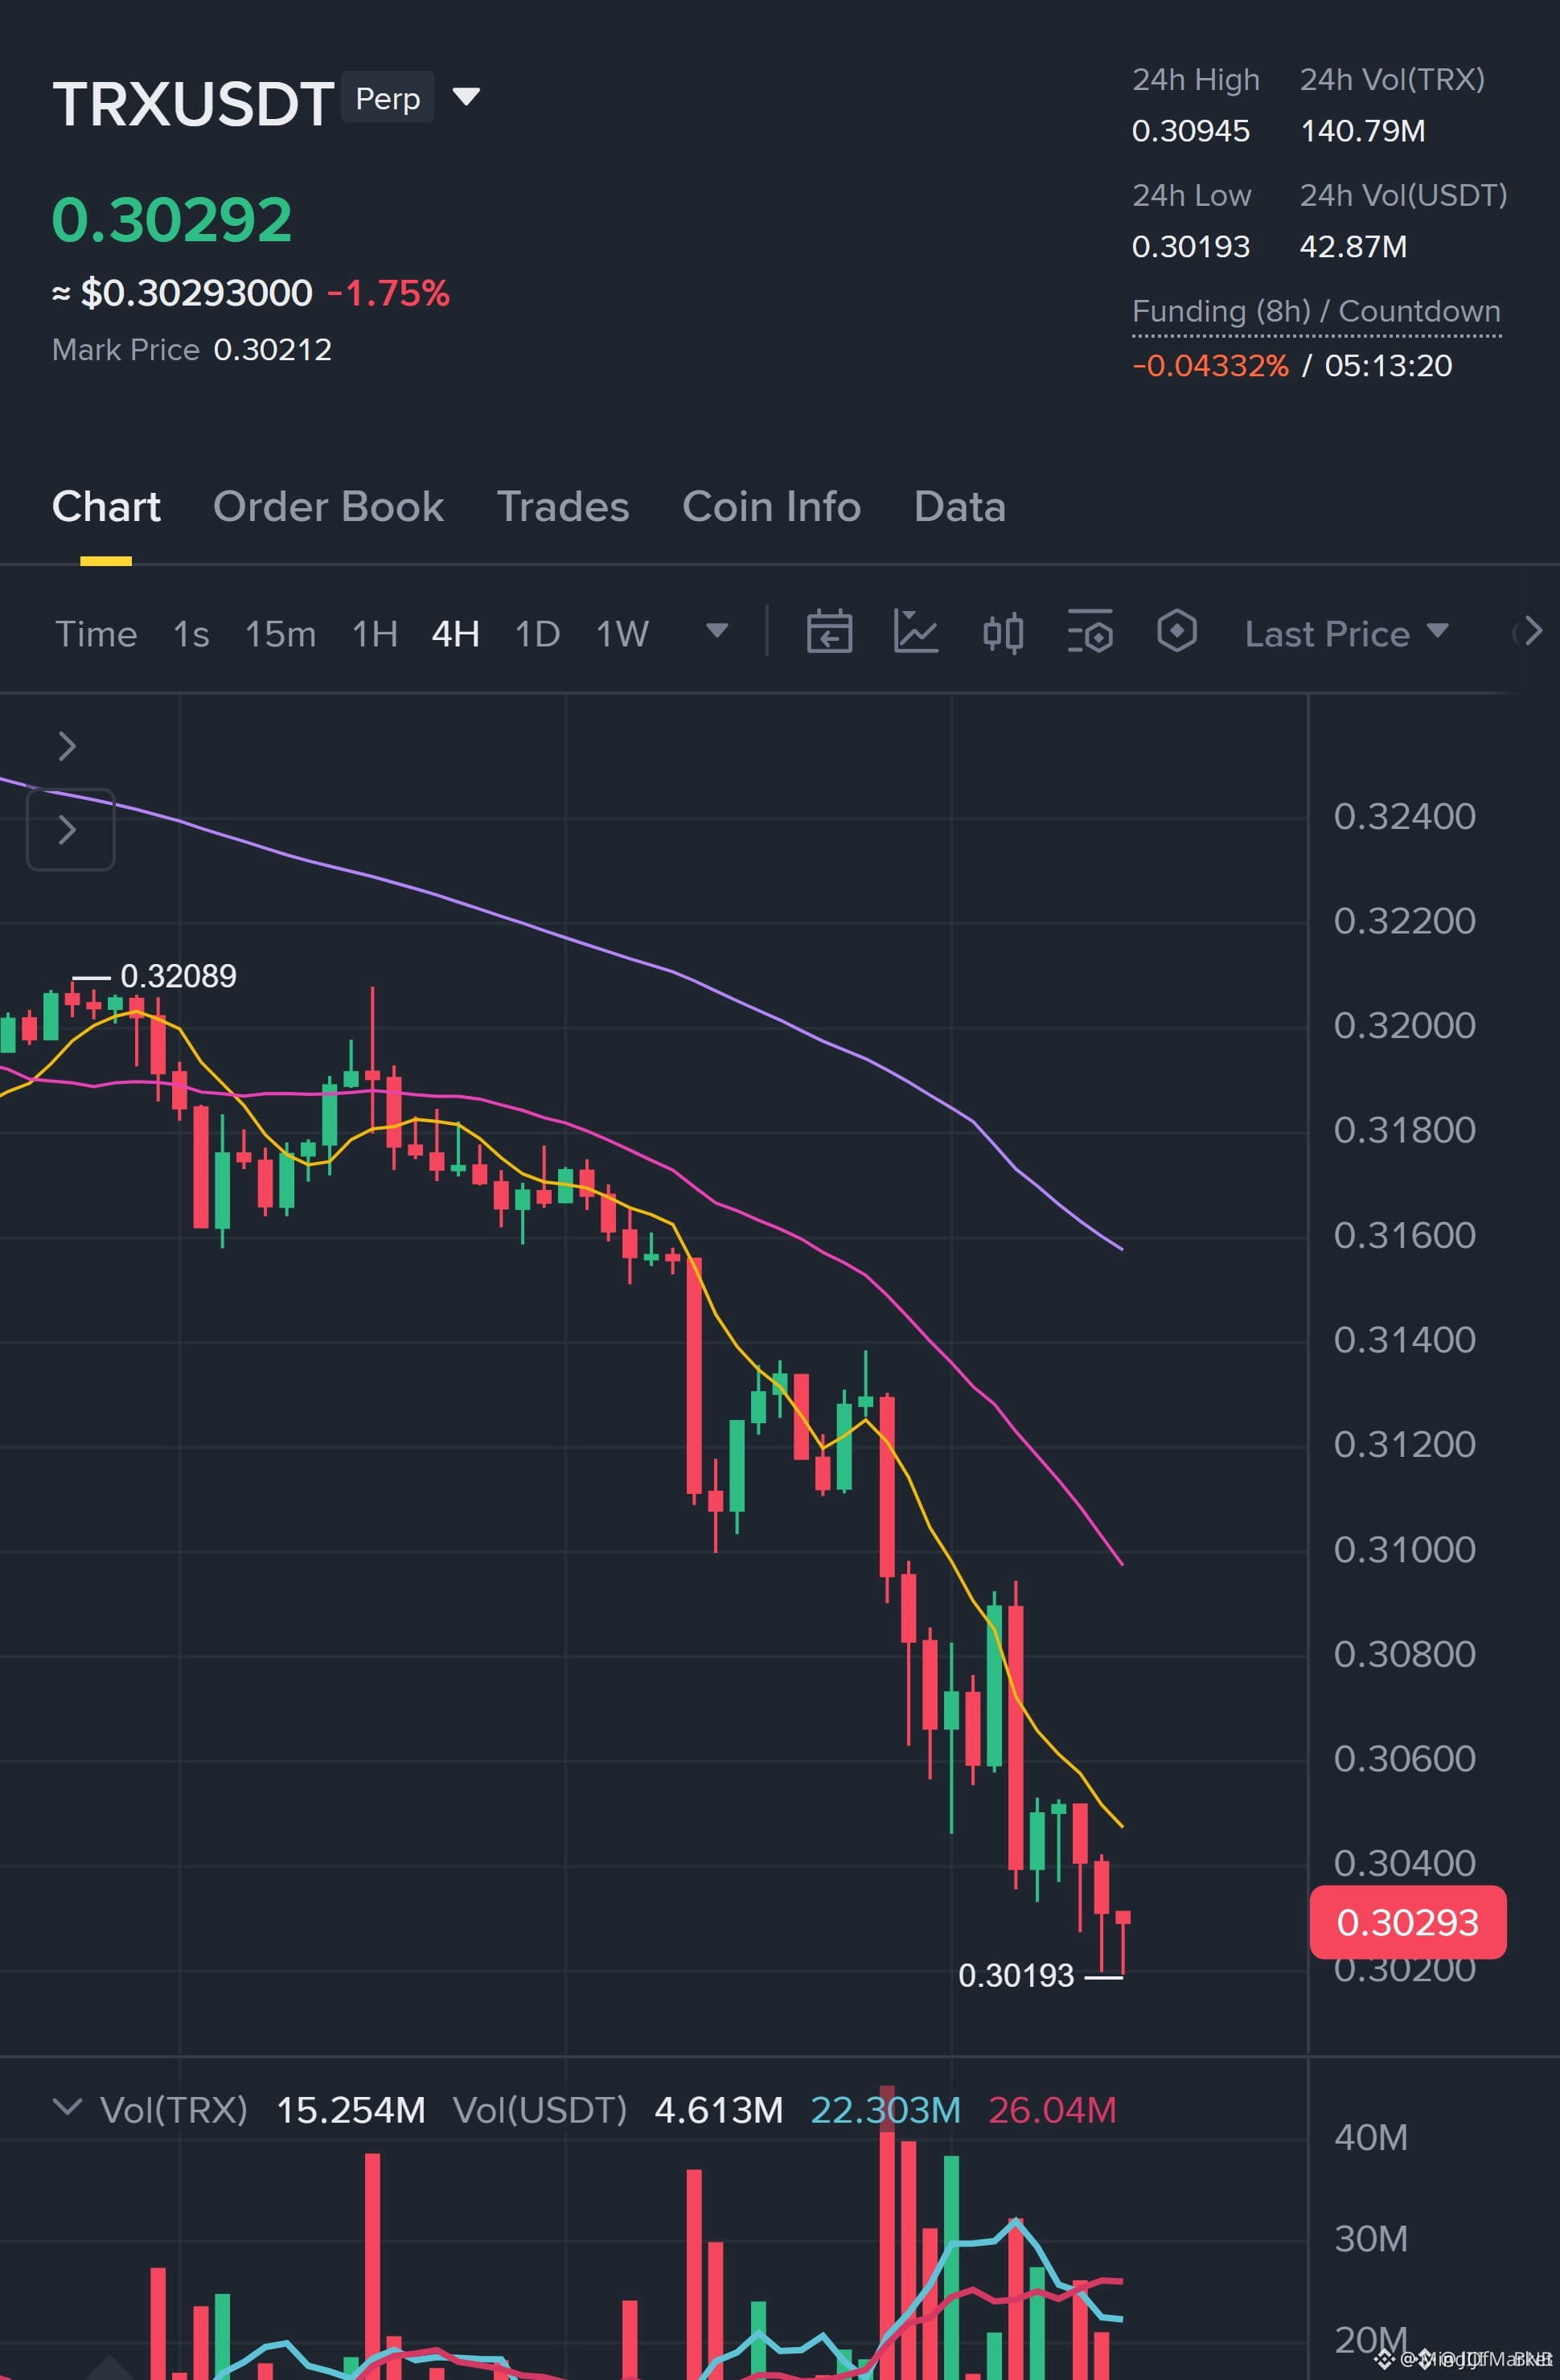
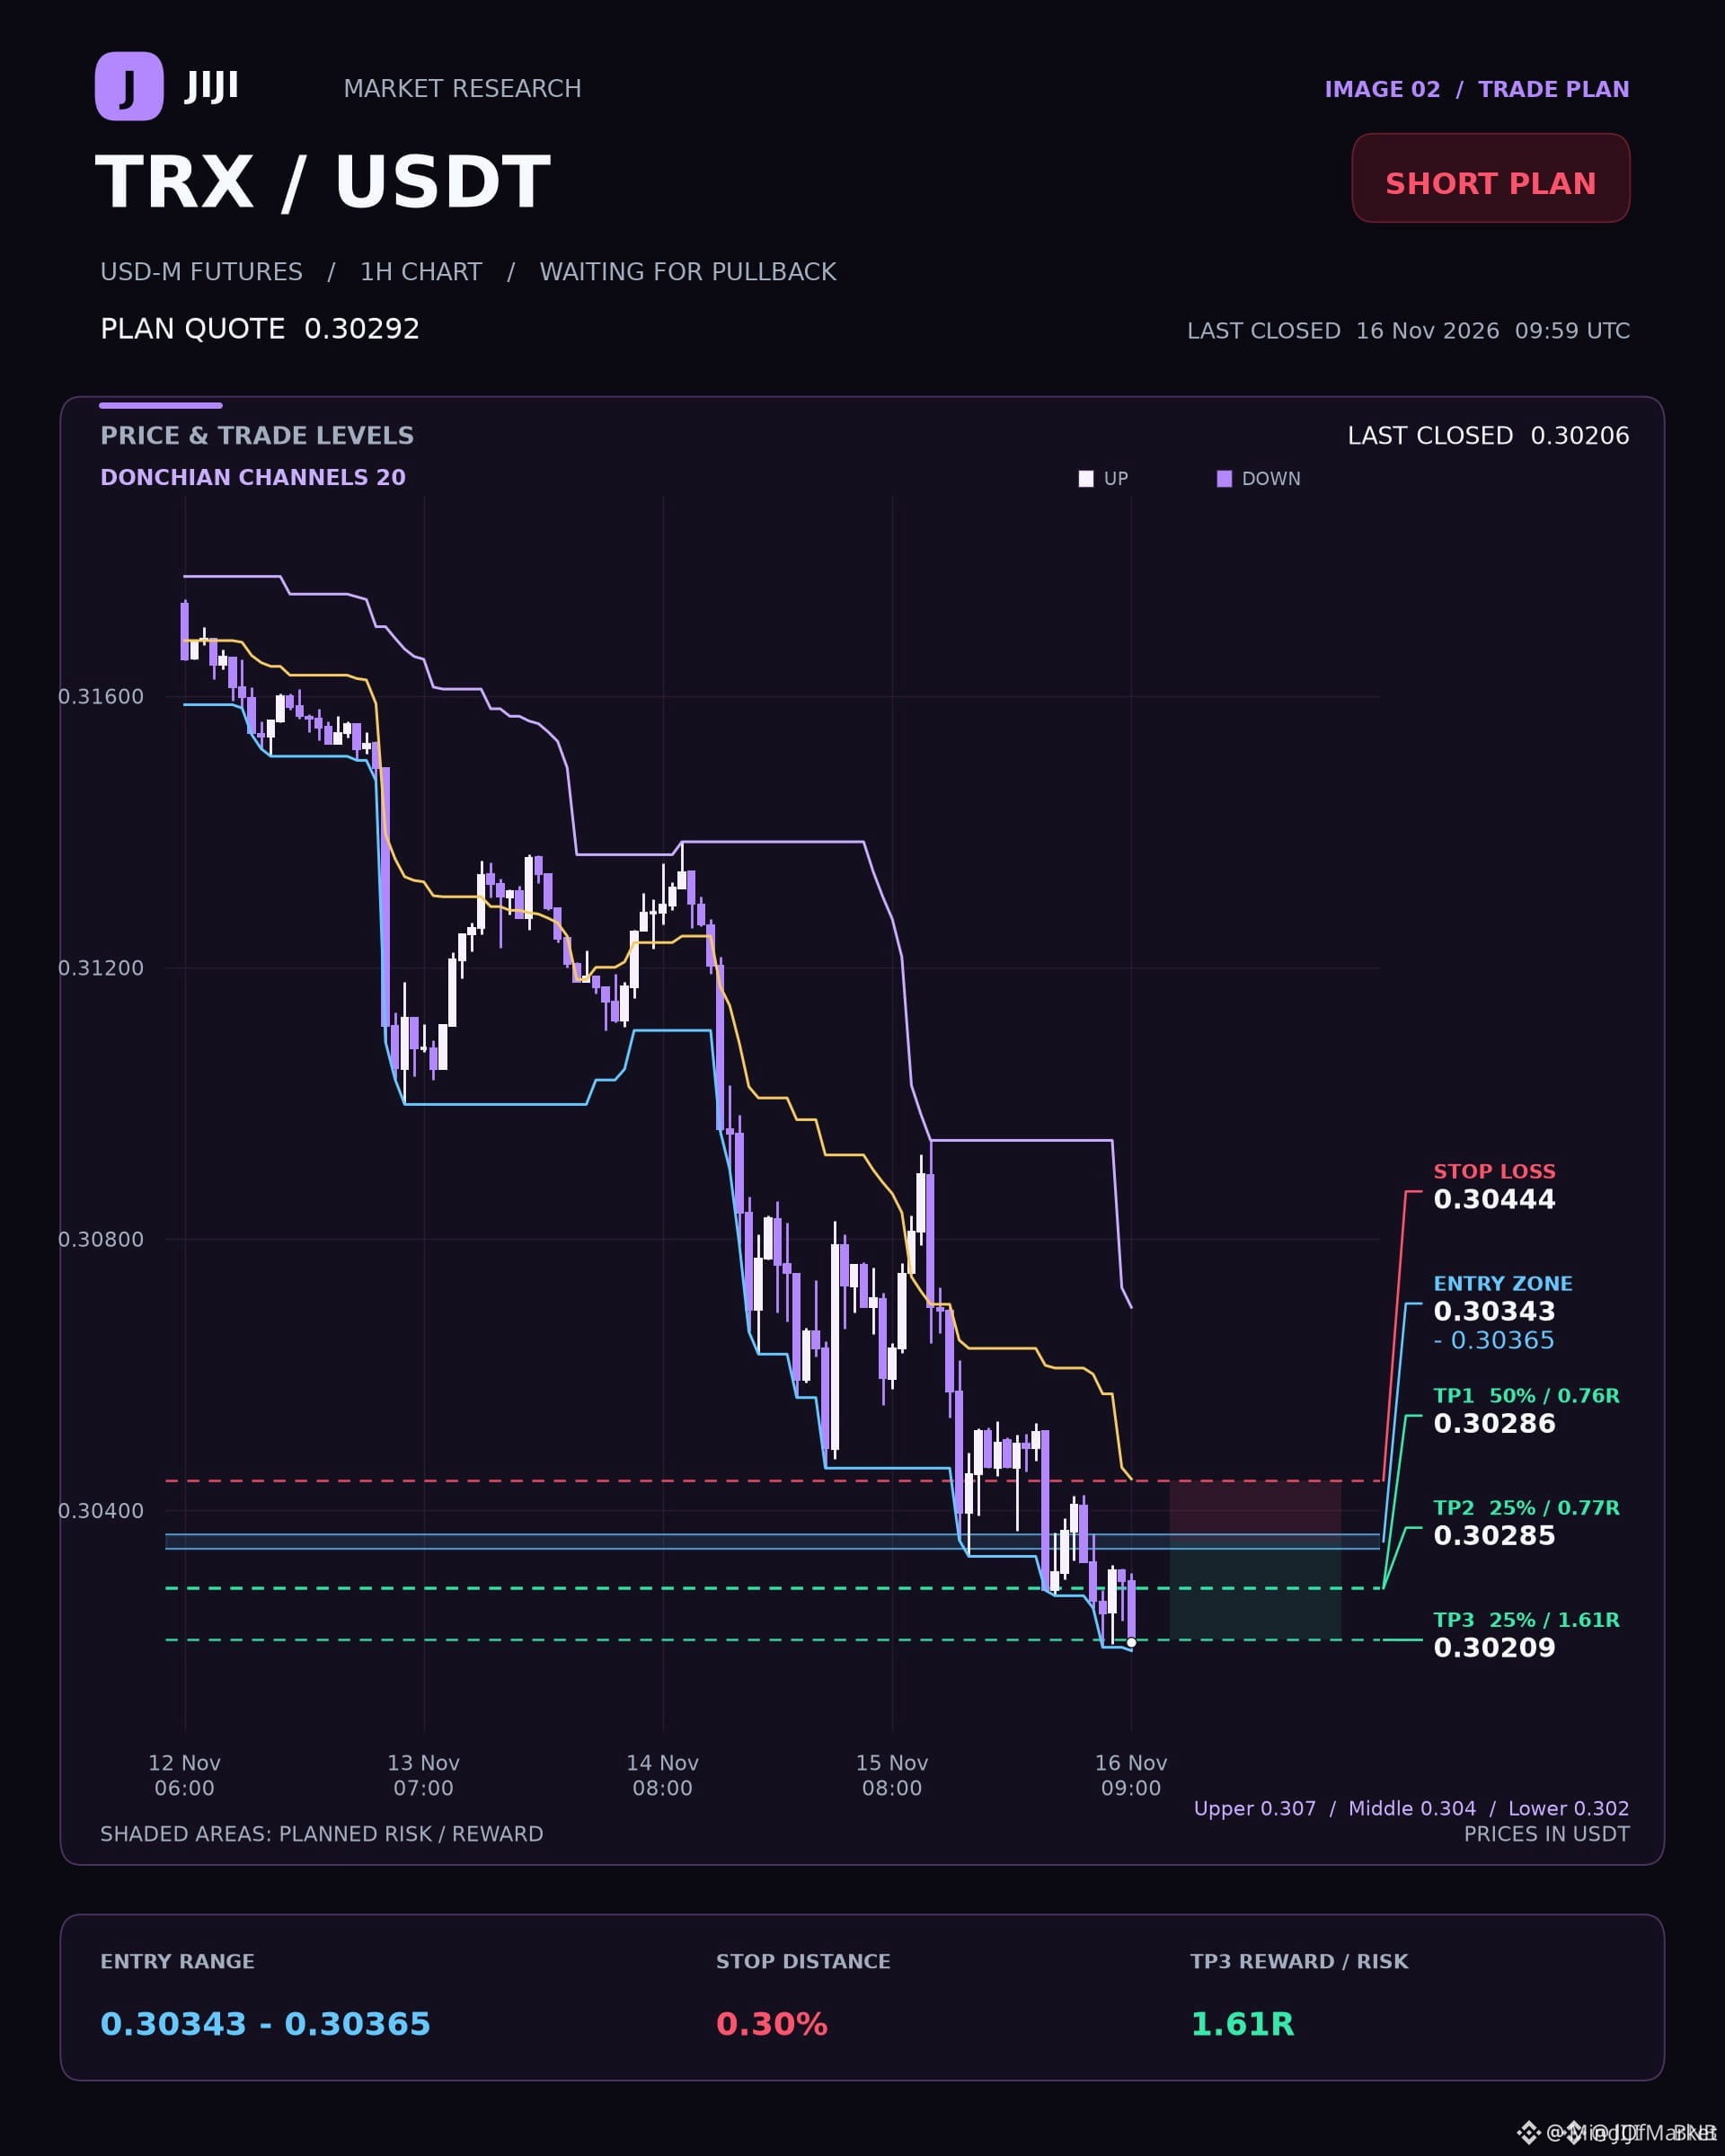
📉 $TRX SHORT SETUP LOADING AS PRICE APPROACHES PREMIUM INEFFICIENCY ZONES ⚠️
Entry: 0.30343 – 0.30365 ⚡
Target: 0.30286 🎯
Stop Loss: 0.30444 🛑
Order flow indicates smart money absorption as price tests the local premium imbalance following a swift impulse away from the EMA50 baseline. 📊 We are patiently tracking lower timeframe confirmation inside the liquidity band before committing capital to the downside continuation. 🔍
Risk parameters are tightly defined above the structural ATR floor to protect against pre-continuation volatility bounces. 💡 Are you waiting for a confirmed 15-minute candle close inside the zone or scaling in early? 👇
⚠️ Not financial advice. Always manage your risk. 🛡️
🏷️ #TRX #ShortSetup #SmartMoney #Crypto
📉 🦈
📉 $TRX SHORT SETUP LOADING AS PRICE APPROACHES PREMIUM INEFFICIENCY ZONES ⚠️
Entry: 0.30343 – 0.30365 ⚡
Target: 0.30286 🎯
Stop Loss: 0.30444 🛑
Order flow indicates smart money absorption as price tests the local premium imbalance following a swift impulse away from the EMA50 baseline. 📊 We are patiently tracking lower timeframe confirmation inside the liquidity band before committing capital to the downside continuation. 🔍
Risk parameters are tightly defined above the structural ATR floor to protect against pre-continuation volatility bounces. 💡 Are you waiting for a confirmed 15-minute candle close inside the zone or scaling in early? 👇
⚠️ Not financial advice. Always manage your risk. 🛡️
🏷️ #TRX #ShortSetup #SmartMoney #Crypto
📉 🦈
Entry: 0.30343 – 0.30365 ⚡
Target: 0.30286 🎯
Stop Loss: 0.30444 🛑
Order flow indicates smart money absorption as price tests the local premium imbalance following a swift impulse away from the EMA50 baseline. 📊 We are patiently tracking lower timeframe confirmation inside the liquidity band before committing capital to the downside continuation. 🔍
Risk parameters are tightly defined above the structural ATR floor to protect against pre-continuation volatility bounces. 💡 Are you waiting for a confirmed 15-minute candle close inside the zone or scaling in early? 👇
⚠️ Not financial advice. Always manage your risk. 🛡️
🏷️ #TRX #ShortSetup #SmartMoney #Crypto
📉 🦈
5
See translation
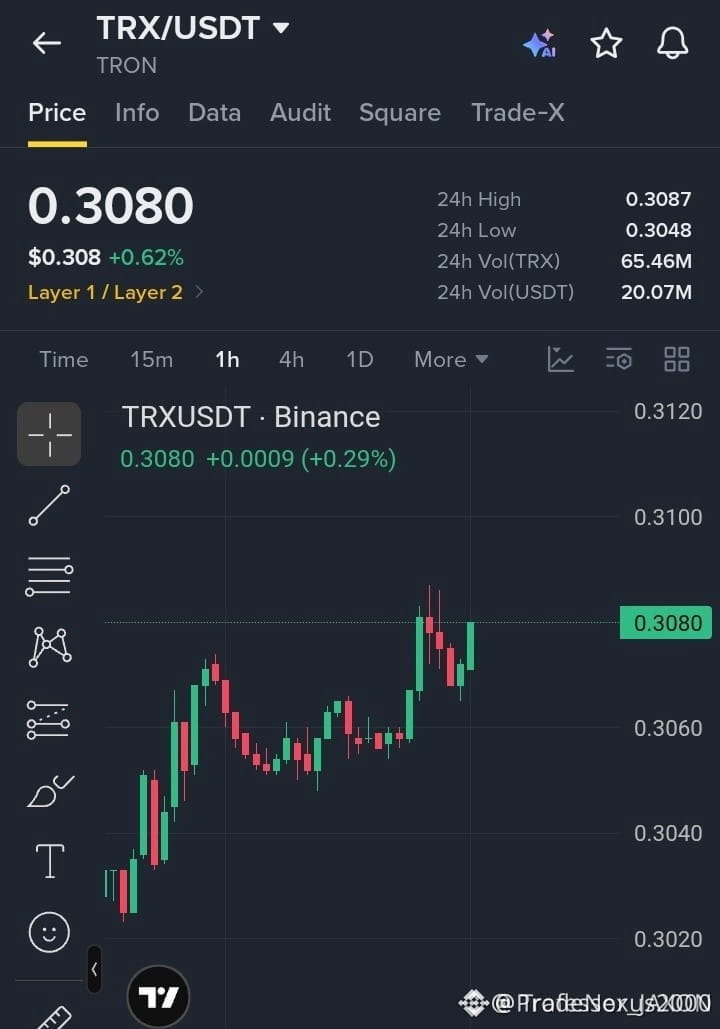
🦈 $TRX BREAKING CONSOLIDATION AS SMART MONEY ABSORBS SUPPLY NEAR RESISTANCE ⚡
Entry: 0.3070 - 0.3080 ⚡
Target: 0.3115 🚀
Stop Loss: 0.3060 ⚠️
Price action on the 1H timeframe is carving a clean institutional markup phase after breaching the upper boundary of the recent accumulation range. Buyers are aggressively pressing toward the 0.3087 liquidity pool, signaling strong intent to expand the impulsive leg higher. 📊
Maintaining structural defense above the 0.3070 pivot keeps the bullish order flow fully intact for a rotation toward higher inefficiencies. 💡
💬 Are you positioning for the breakout continuation here or waiting for a shallow retest of the range high? 👇
⚠️ Not financial advice. Always manage your risk. 🛡️
🏷️ #TRX #LongSetup #SmartMoney #Crypto
🦈 📈
🦈 $TRX BREAKING CONSOLIDATION AS SMART MONEY ABSORBS SUPPLY NEAR RESISTANCE ⚡
Entry: 0.3070 - 0.3080 ⚡
Target: 0.3115 🚀
Stop Loss: 0.3060 ⚠️
Price action on the 1H timeframe is carving a clean institutional markup phase after breaching the upper boundary of the recent accumulation range. Buyers are aggressively pressing toward the 0.3087 liquidity pool, signaling strong intent to expand the impulsive leg higher. 📊
Maintaining structural defense above the 0.3070 pivot keeps the bullish order flow fully intact for a rotation toward higher inefficiencies. 💡
💬 Are you positioning for the breakout continuation here or waiting for a shallow retest of the range high? 👇
⚠️ Not financial advice. Always manage your risk. 🛡️
🏷️ #TRX #LongSetup #SmartMoney #Crypto
🦈 📈
Entry: 0.3070 - 0.3080 ⚡
Target: 0.3115 🚀
Stop Loss: 0.3060 ⚠️
Price action on the 1H timeframe is carving a clean institutional markup phase after breaching the upper boundary of the recent accumulation range. Buyers are aggressively pressing toward the 0.3087 liquidity pool, signaling strong intent to expand the impulsive leg higher. 📊
Maintaining structural defense above the 0.3070 pivot keeps the bullish order flow fully intact for a rotation toward higher inefficiencies. 💡
💬 Are you positioning for the breakout continuation here or waiting for a shallow retest of the range high? 👇
⚠️ Not financial advice. Always manage your risk. 🛡️
🏷️ #TRX #LongSetup #SmartMoney #Crypto
🦈 📈
12

·
--
See translation
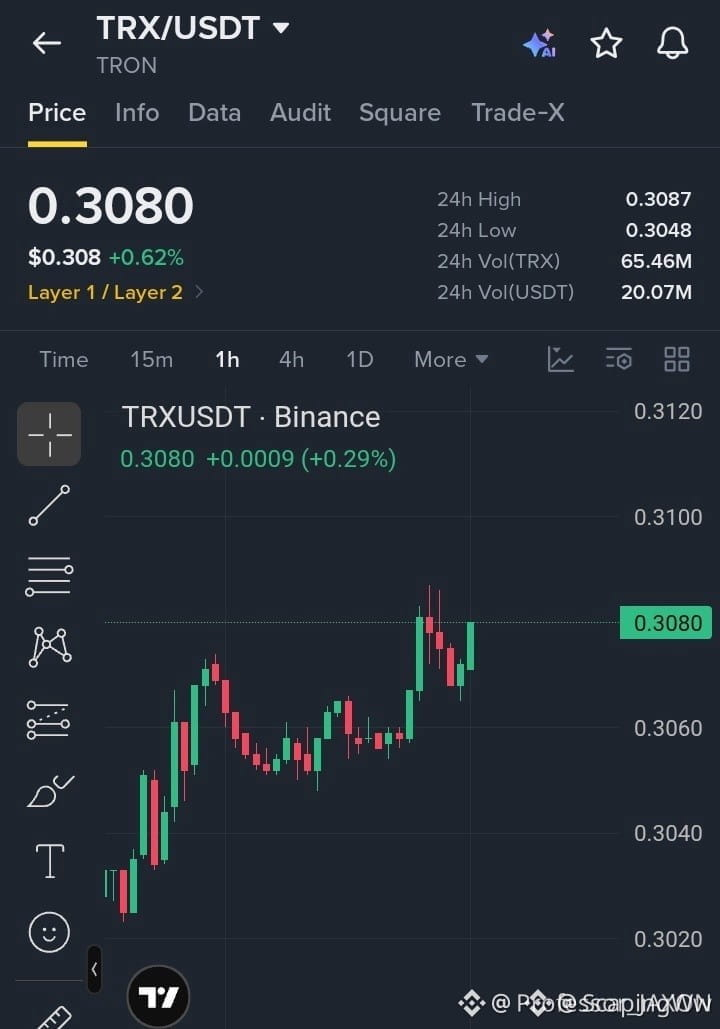
🚀 $TRX BULLS SHATTER CONSOLIDATION RANGE TO UNLOCK FRESH UPSIDE MOMENTUM! 💥
Entry: 0.3070–0.3080 ⚡
Target: 0.3115 🚀
Stop Loss: 0.3060 ⚠️
Price action on the hourly timeframe just broke the shackles of its recent consolidation zone, leaving sellers scrambling to cover. Buyers are firmly in the driver seat as volume expands, pressing directly toward the key 0.3087 overhead barrier. 📊
As long as price defends the 0.3070 floor with conviction, this structure favors a continuation push toward higher resistance tiers. ⚡
💬 Are you jumping on this breakout early or waiting for a deeper retest to lock in your fill? 👇
⚠️ Not financial advice. Always manage your risk. 🛡️
🏷️ #TRX #Breakout #Crypto #Trading #LongSetup
🔥 💎
🚀 $TRX BULLS SHATTER CONSOLIDATION RANGE TO UNLOCK FRESH UPSIDE MOMENTUM! 💥
Entry: 0.3070–0.3080 ⚡
Target: 0.3115 🚀
Stop Loss: 0.3060 ⚠️
Price action on the hourly timeframe just broke the shackles of its recent consolidation zone, leaving sellers scrambling to cover. Buyers are firmly in the driver seat as volume expands, pressing directly toward the key 0.3087 overhead barrier. 📊
As long as price defends the 0.3070 floor with conviction, this structure favors a continuation push toward higher resistance tiers. ⚡
💬 Are you jumping on this breakout early or waiting for a deeper retest to lock in your fill? 👇
⚠️ Not financial advice. Always manage your risk. 🛡️
🏷️ #TRX #Breakout #Crypto #Trading #LongSetup
🔥 💎
Entry: 0.3070–0.3080 ⚡
Target: 0.3115 🚀
Stop Loss: 0.3060 ⚠️
Price action on the hourly timeframe just broke the shackles of its recent consolidation zone, leaving sellers scrambling to cover. Buyers are firmly in the driver seat as volume expands, pressing directly toward the key 0.3087 overhead barrier. 📊
As long as price defends the 0.3070 floor with conviction, this structure favors a continuation push toward higher resistance tiers. ⚡
💬 Are you jumping on this breakout early or waiting for a deeper retest to lock in your fill? 👇
⚠️ Not financial advice. Always manage your risk. 🛡️
🏷️ #TRX #Breakout #Crypto #Trading #LongSetup
🔥 💎
19
Log in to explore more content
Join global crypto users on Binance Square
⚡️ Get latest and useful information about crypto.
💬 Trusted by the world’s largest crypto exchange.
👍 Discover real insights from verified creators.
Email / Phone number
Trending Topics
1
#NvidiaBeatsEstimatesWith$130BQ4Outlook
11,654 views
161 Discussing
2
#AnthropicIPOPriceCouldExceed$80
17,247 views
143 Discussing
3
#CanNvidia’sDataCenterGrowthContinue?
52,962 views
719 Discussing
4
#CanadaAndUSLaunchOperationNiagaraAgainstApprovalPhishing
2,359 views
31 Discussing
5
#BankOfEnglandUnveilsClearingHousePathwayCoveringDLTFirms
1,924 views
46 Discussing
6
#DBSAndCirclePartnerToExpandAsianInstitutionsUSDCAccess
3,273 views
54 Discussing
7
#LedgerHardwareImplantReportsExtendToDubai
20,849 views
294 Discussing
8
#NvidiaBoardNotConsideringHuang’sReturnasCEO
214,458 views
1,547 Discussing
9
#KOSPIFalls2.59%ToLowestCloseSinceFebruary
65,089 views
738 Discussing
10
#AnthropicClearedToListOnNasdaqAsANT
56,975 views
606 Discussing