
#sar
sar
11,648 views
55 Discussing
Hot
Latest

·
--
See translation
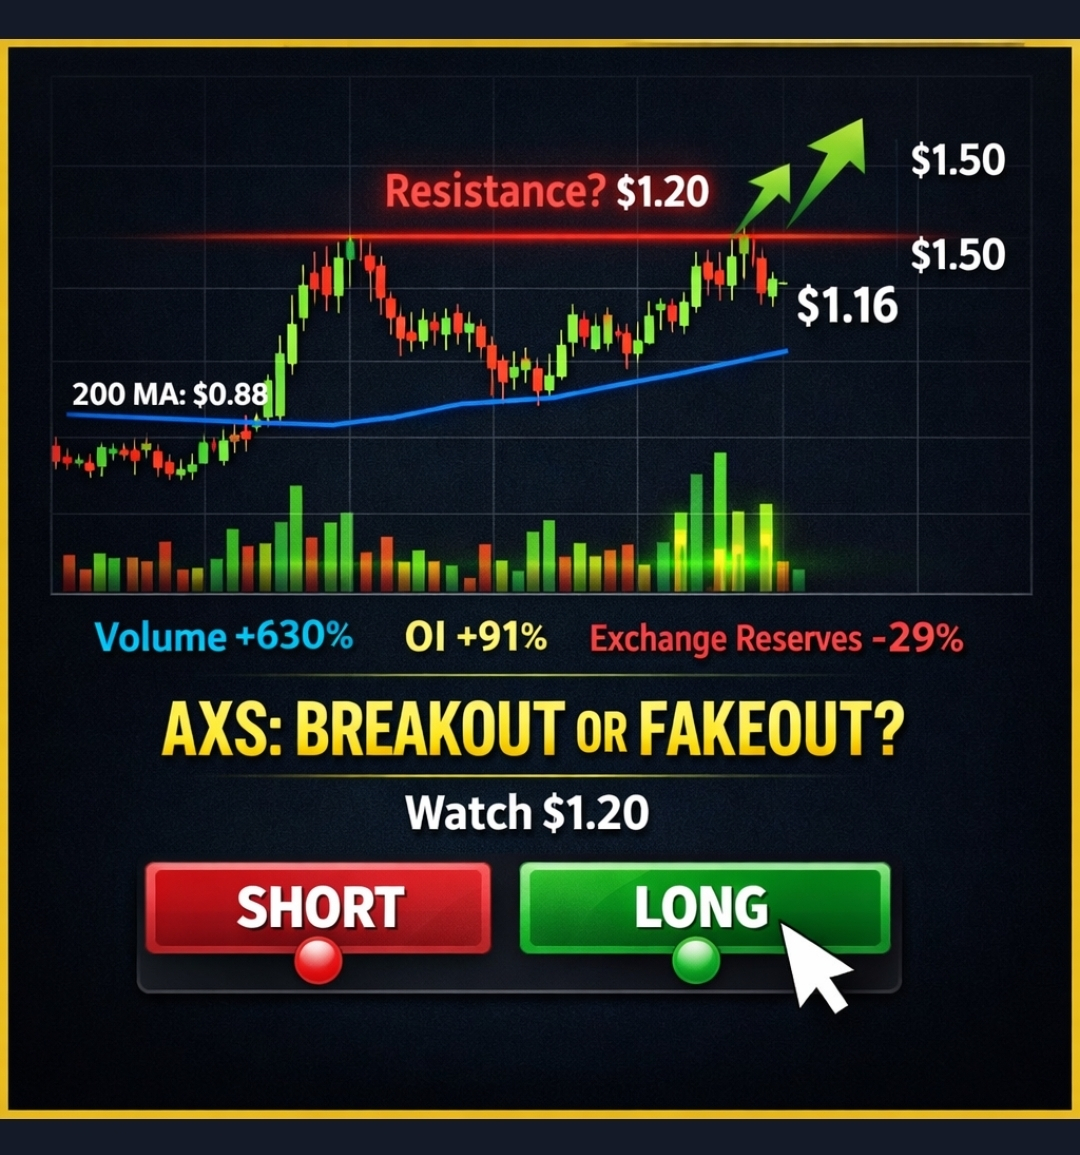
$AXS : The data just flashed something BIG.
{future}(AXSUSDT)
While most #traders are sleeping, #AXS just recorded one of its strongest daily performances in weeks :
📈 +23.13% in 24h
💰 $127.5M** volume (+630%)
📊 **$38.6M Open Interest (+91%)
🏦 Exchange reserves DOWN 29% — whales are accumulating, not selling
Price broke above the descending channel, with #MACD and Parabolic #SAR both flipping bullish .
But here's the real question :
Is this a breakout or a fakeout before a dump ?
My trade setup :
🔼 LONG on pullback
📍 Entry : $1.09 - $1.13
🎯 TP1 : $1.20 | TP2 : $1.31 | TP3 : $1.50
🛑 SL : $0.98
Why ? Volume + OI rising together = new positions entering, not just shorts covering . And exchange reserves dropping means less selling pressure ahead.
But I want to hear YOUR take.
👇 Drop 🔴 SHORT or 🟢 LONG below.
Let's see who's really watching the tape. 🫡 »*
$AXS : The data just flashed something BIG.
While most #traders are sleeping, #AXS just recorded one of its strongest daily performances in weeks :
📈 +23.13% in 24h
💰 $127.5M** volume (+630%)
📊 **$38.6M Open Interest (+91%)
🏦 Exchange reserves DOWN 29% — whales are accumulating, not selling
Price broke above the descending channel, with #MACD and Parabolic #SAR both flipping bullish .
But here's the real question :
Is this a breakout or a fakeout before a dump ?
My trade setup :
🔼 LONG on pullback
📍 Entry : $1.09 - $1.13
🎯 TP1 : $1.20 | TP2 : $1.31 | TP3 : $1.50
🛑 SL : $0.98
Why ? Volume + OI rising together = new positions entering, not just shorts covering . And exchange reserves dropping means less selling pressure ahead.
But I want to hear YOUR take.
👇 Drop 🔴 SHORT or 🟢 LONG below.
Let's see who's really watching the tape. 🫡 »*
While most #traders are sleeping, #AXS just recorded one of its strongest daily performances in weeks :
📈 +23.13% in 24h
💰 $127.5M** volume (+630%)
📊 **$38.6M Open Interest (+91%)
🏦 Exchange reserves DOWN 29% — whales are accumulating, not selling
Price broke above the descending channel, with #MACD and Parabolic #SAR both flipping bullish .
But here's the real question :
Is this a breakout or a fakeout before a dump ?
My trade setup :
🔼 LONG on pullback
📍 Entry : $1.09 - $1.13
🎯 TP1 : $1.20 | TP2 : $1.31 | TP3 : $1.50
🛑 SL : $0.98
Why ? Volume + OI rising together = new positions entering, not just shorts covering . And exchange reserves dropping means less selling pressure ahead.
But I want to hear YOUR take.
👇 Drop 🔴 SHORT or 🟢 LONG below.
Let's see who's really watching the tape. 🫡 »*
91

See translation
🌍 GLOBAL MARKET RATES – 1 NOVEMBER 2026
📊 GOLD & SILVER
🥇 Gold (24K): Rs. 409,736 / Tola
🥈 Silver: Rs. 5,352–5,388 / Tola
🌎 International Gold: $3,875 / Ounce
🌎 International Silver: $49.12 / Ounce
💱 CURRENCY RATES – PKR
🇺🇸 USD: Rs. 280.00
🇬🇧 GBP: Rs. 375.50
🇸🇦 SAR: Rs. 74.40
🇦🇪 AED: Rs. 76.35
🇪🇺 EUR: Rs. 314.13
🇨🇦 CAD: Rs. 204.93
🇦🇺 AUD: Rs. 200.83
🇰🇼 KWD: Rs. 895.76
🇨🇳 CNY: Rs. 38.90
📢 Follow for daily market updates!
#Gold
#Silver
#USD
#GBP
#SAR
#Crypto
#Bitcoin
#BTC
#Binance
#Forex
#GlobalMarket
#MarketUpdate
🌍 GLOBAL MARKET RATES – 1 NOVEMBER 2026
📊 GOLD & SILVER
🥇 Gold (24K): Rs. 409,736 / Tola
🥈 Silver: Rs. 5,352–5,388 / Tola
🌎 International Gold: $3,875 / Ounce
🌎 International Silver: $49.12 / Ounce
💱 CURRENCY RATES – PKR
🇺🇸 USD: Rs. 280.00
🇬🇧 GBP: Rs. 375.50
🇸🇦 SAR: Rs. 74.40
🇦🇪 AED: Rs. 76.35
🇪🇺 EUR: Rs. 314.13
🇨🇦 CAD: Rs. 204.93
🇦🇺 AUD: Rs. 200.83
🇰🇼 KWD: Rs. 895.76
🇨🇳 CNY: Rs. 38.90
📢 Follow for daily market updates!
#Gold
#Silver
#USD
#GBP
#SAR
#Crypto
#Bitcoin
#BTC
#Binance
#Forex
#GlobalMarket
#MarketUpdate
📊 GOLD & SILVER
🥇 Gold (24K): Rs. 409,736 / Tola
🥈 Silver: Rs. 5,352–5,388 / Tola
🌎 International Gold: $3,875 / Ounce
🌎 International Silver: $49.12 / Ounce
💱 CURRENCY RATES – PKR
🇺🇸 USD: Rs. 280.00
🇬🇧 GBP: Rs. 375.50
🇸🇦 SAR: Rs. 74.40
🇦🇪 AED: Rs. 76.35
🇪🇺 EUR: Rs. 314.13
🇨🇦 CAD: Rs. 204.93
🇦🇺 AUD: Rs. 200.83
🇰🇼 KWD: Rs. 895.76
🇨🇳 CNY: Rs. 38.90
📢 Follow for daily market updates!
#Gold
#Silver
#USD
#GBP
#SAR
#Crypto
#Bitcoin
#BTC
#Binance
#Forex
#GlobalMarket
#MarketUpdate
295


Article
Quick Update BTCUSDT#BTC #USDT #YER
#SAR
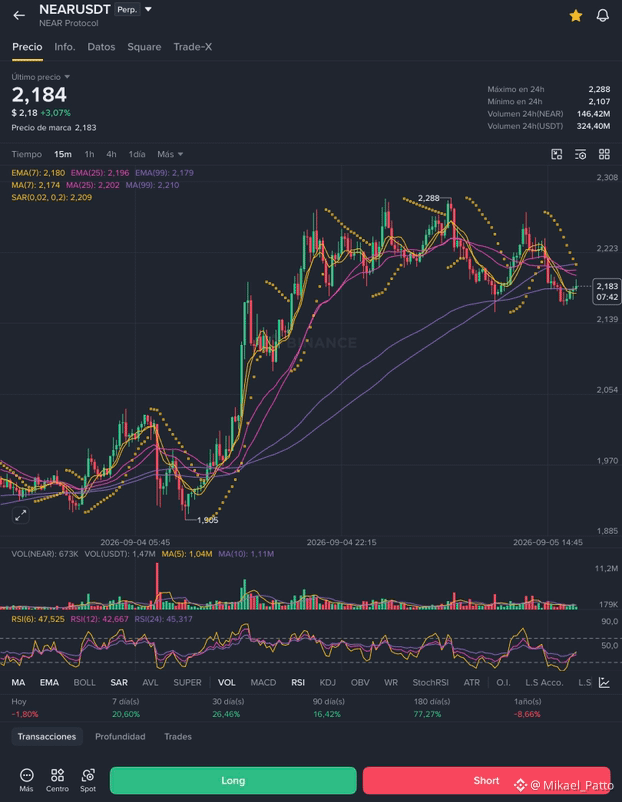
Check out the difference 👆🏻 Chart analysis from yesterday in the cover image
---
*Quick update - BTCUSDT*
The picture is from yesterday's candlestick at 3 PM Yemen time 📍
The price is still trapped between the ceiling and the floor we've identified.
6 candlesticks, 4 hours, no clear break = accumulation/confusion
The 3 PM candlestick today is the key 👇
Close below the level = bearish trend targeting the next support.
Quick Update BTCUSDT
#BTC #USDT #YER
#SAR
Check out the difference 👆🏻 Chart analysis from yesterday in the cover image
---
*Quick update - BTCUSDT*
The picture is from yesterday's candlestick at 3 PM Yemen time 📍
The price is still trapped between the ceiling and the floor we've identified.
6 candlesticks, 4 hours, no clear break = accumulation/confusion
The 3 PM candlestick today is the key 👇
Close below the level = bearish trend targeting the next support.
#SAR
Check out the difference 👆🏻 Chart analysis from yesterday in the cover image
---
*Quick update - BTCUSDT*
The picture is from yesterday's candlestick at 3 PM Yemen time 📍
The price is still trapped between the ceiling and the floor we've identified.
6 candlesticks, 4 hours, no clear break = accumulation/confusion
The 3 PM candlestick today is the key 👇
Close below the level = bearish trend targeting the next support.
1
184

·
--
Bearish
See translation
If you are longing $DRIFT right now thinking this minor relief is a "reversal," you are completely misreading a basic institutional distribution model. Prove me wrong in the replies. 📉👇
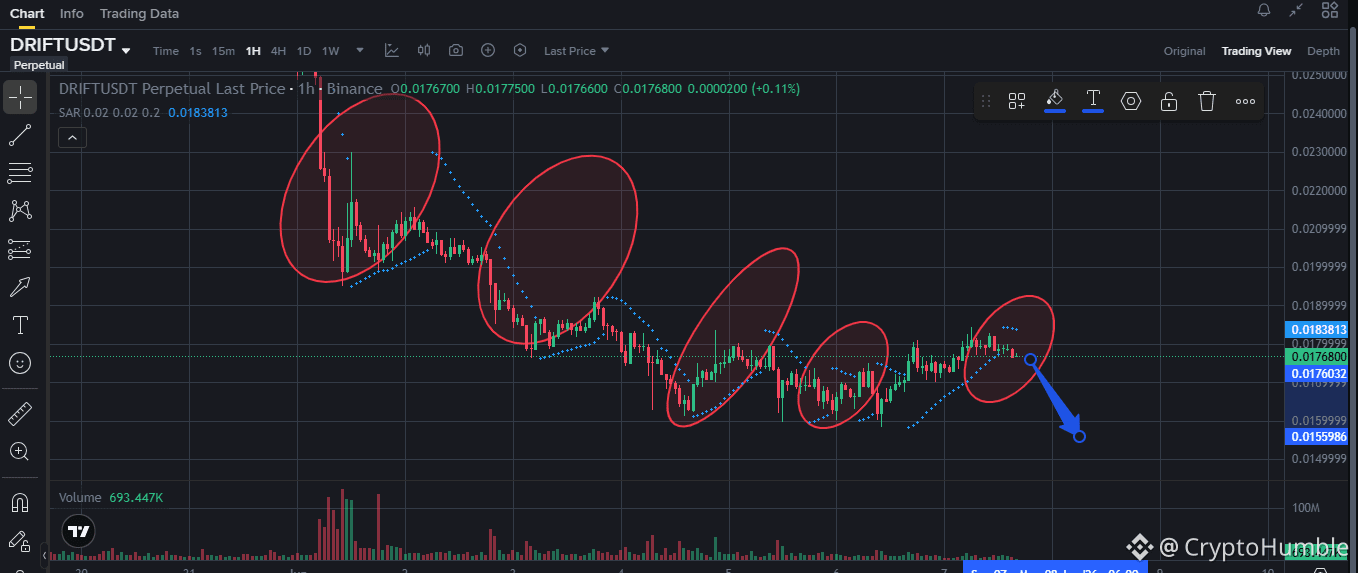
By each #SAR 1hr of drift break, it go to sweep the low side liquidity, by mean low i mean lower low .... see the charts
Take a hard look at the 1H chart on image. The structural footprints tell the entire story:
🚨 The Lower High Engine: Every single bounce (marked in red) is a trap designed to gather liquidity before market makers slam the price into a fresh lower low.
💥 Volume Exhaustion: Look at the bottom of the chart—buying volume is completely flatlining on these mini wicks. No real money is buying this up.
🎯 The Absolute Target: The price has cleanly rejected the local $0.018 resistance shelf and is being programmatically pushed toward the next major liquidation pocket at $0.0155.
Bidding this trend without a major structural change of character is pure gambling.
Are you seriously trying to catch this knife at $0.017, or are you sitting in stables waiting for the $0.0155 floor to hit first? Drop your biases below. 📊
If you are longing $DRIFT right now thinking this minor relief is a "reversal," you are completely misreading a basic institutional distribution model. Prove me wrong in the replies. 📉👇
By each #SAR 1hr of drift break, it go to sweep the low side liquidity, by mean low i mean lower low .... see the charts
Take a hard look at the 1H chart on image. The structural footprints tell the entire story:
🚨 The Lower High Engine: Every single bounce (marked in red) is a trap designed to gather liquidity before market makers slam the price into a fresh lower low.
💥 Volume Exhaustion: Look at the bottom of the chart—buying volume is completely flatlining on these mini wicks. No real money is buying this up.
🎯 The Absolute Target: The price has cleanly rejected the local $0.018 resistance shelf and is being programmatically pushed toward the next major liquidation pocket at $0.0155.
Bidding this trend without a major structural change of character is pure gambling.
Are you seriously trying to catch this knife at $0.017, or are you sitting in stables waiting for the $0.0155 floor to hit first? Drop your biases below. 📊
By each #SAR 1hr of drift break, it go to sweep the low side liquidity, by mean low i mean lower low .... see the charts
Take a hard look at the 1H chart on image. The structural footprints tell the entire story:
🚨 The Lower High Engine: Every single bounce (marked in red) is a trap designed to gather liquidity before market makers slam the price into a fresh lower low.
💥 Volume Exhaustion: Look at the bottom of the chart—buying volume is completely flatlining on these mini wicks. No real money is buying this up.
🎯 The Absolute Target: The price has cleanly rejected the local $0.018 resistance shelf and is being programmatically pushed toward the next major liquidation pocket at $0.0155.
Bidding this trend without a major structural change of character is pure gambling.
Are you seriously trying to catch this knife at $0.017, or are you sitting in stables waiting for the $0.0155 floor to hit first? Drop your biases below. 📊
2
1
489

·
--
Bullish
See translation
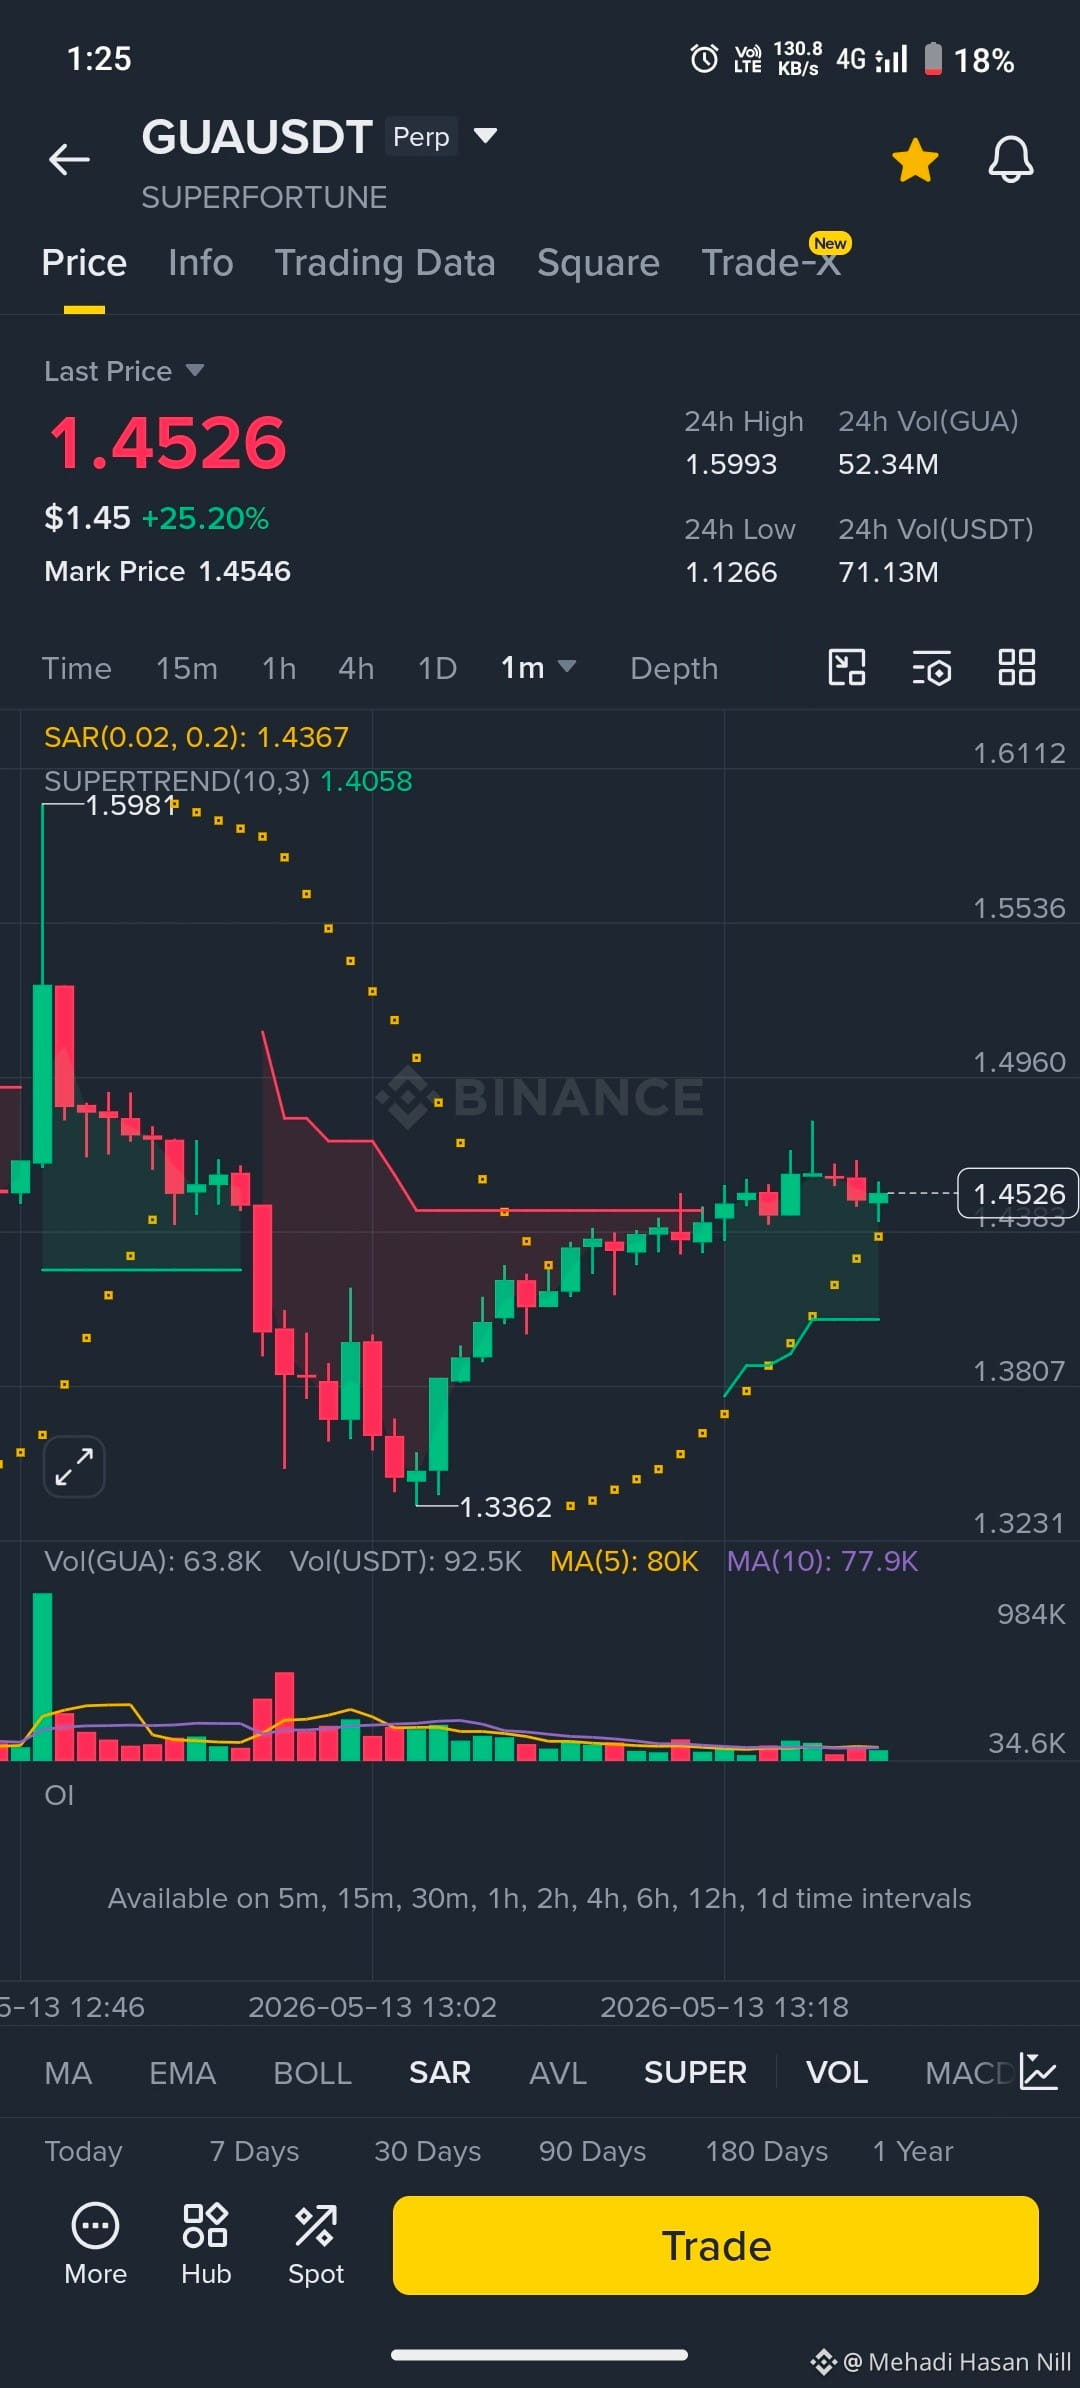
#SAR
In a sideways market, SAR gives many false signals.
For example:
A little up → buy signal
A little down → sell signal
And vice versa
So trading just by looking at SAR is risky.
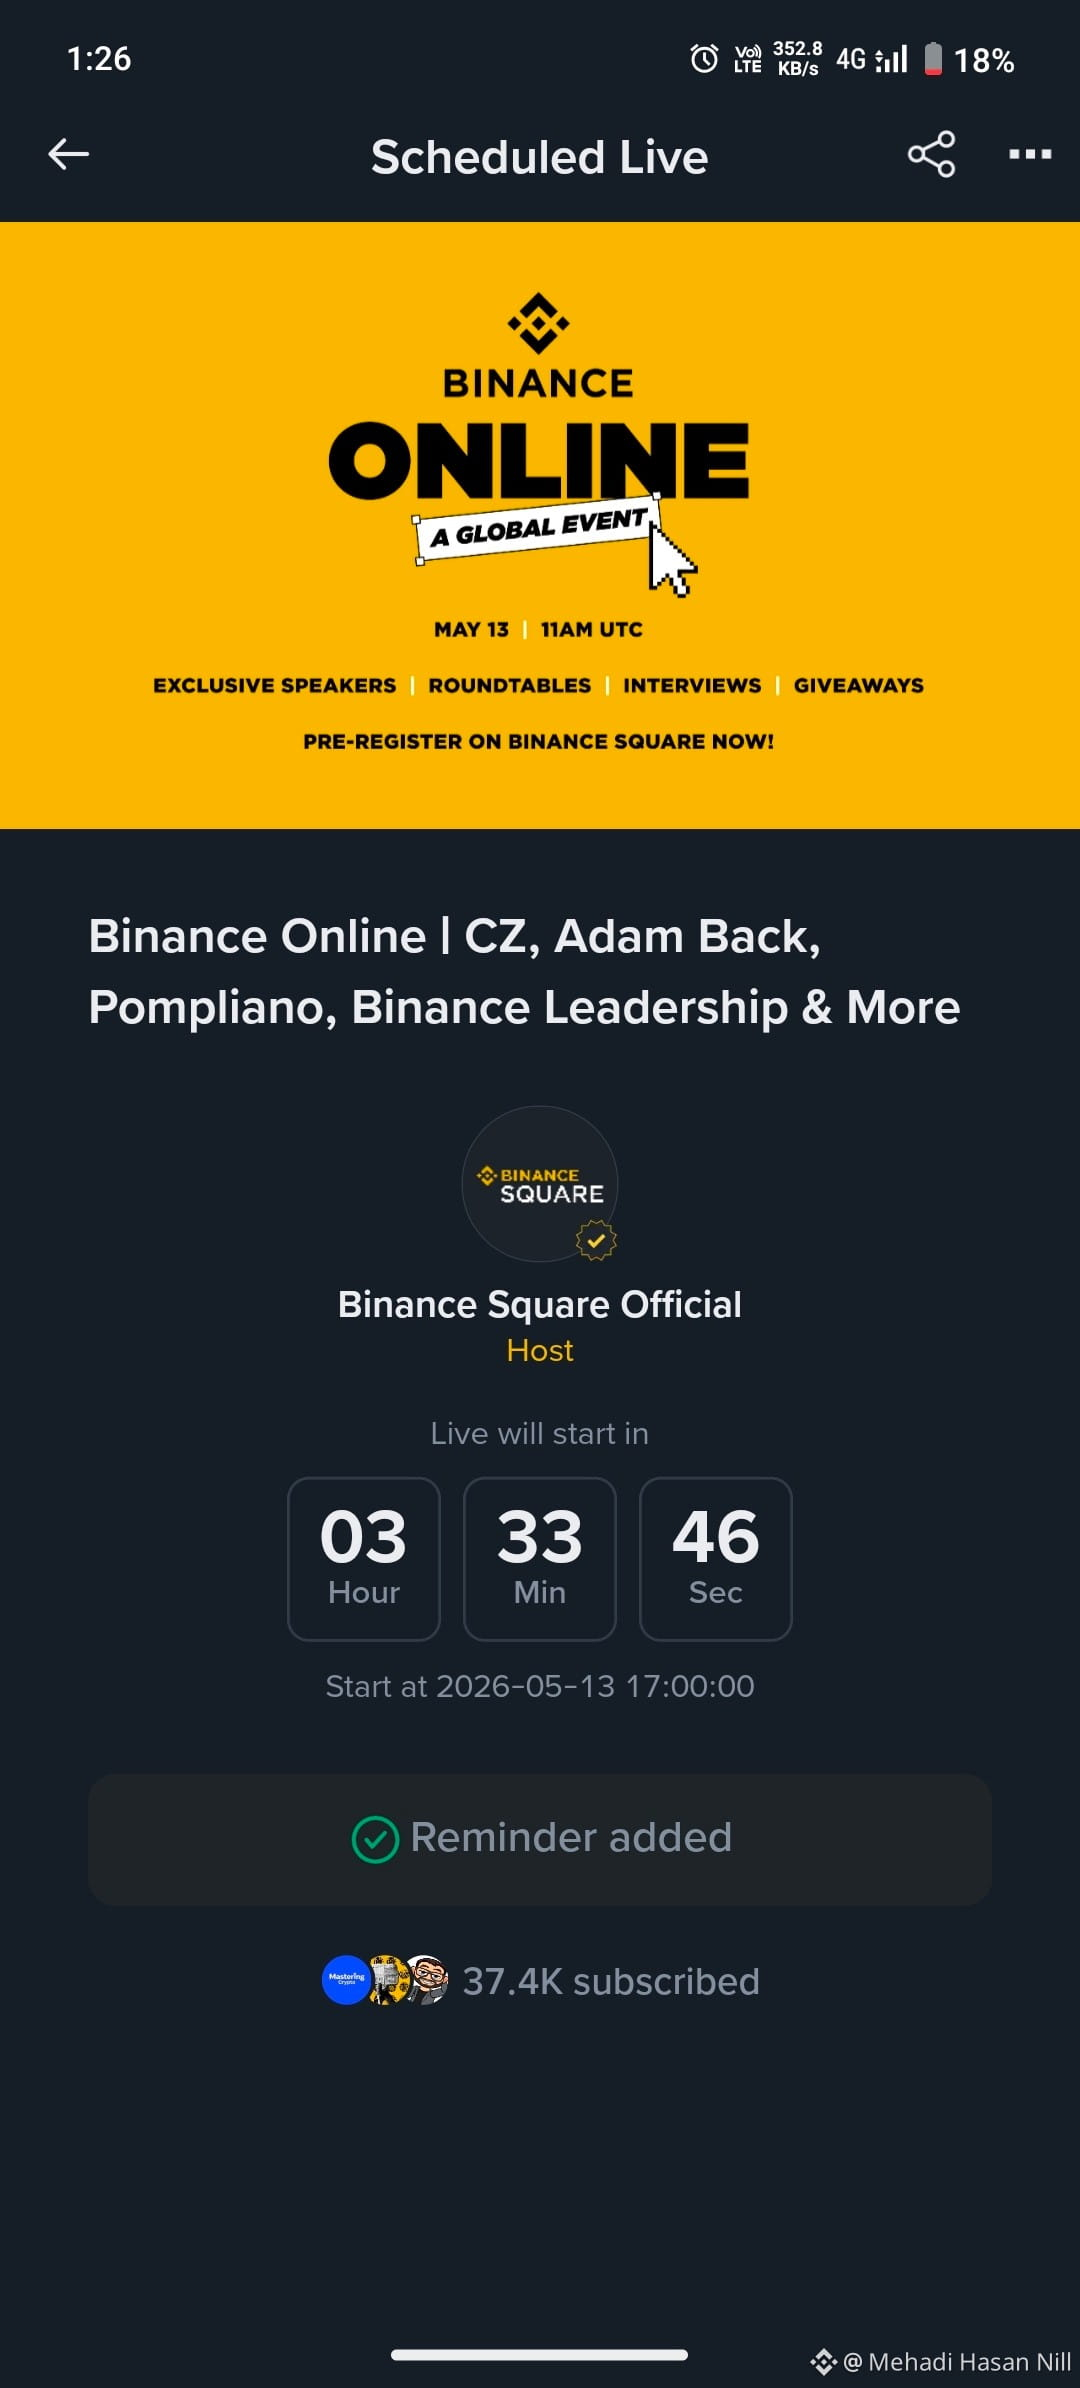
#dyor $GUA #BinanceOnline
#SAR
In a sideways market, SAR gives many false signals.
For example:
A little up → buy signal
A little down → sell signal
And vice versa
So trading just by looking at SAR is risky.
#dyor $GUA #BinanceOnline
In a sideways market, SAR gives many false signals.
For example:
A little up → buy signal
A little down → sell signal
And vice versa
So trading just by looking at SAR is risky.
#dyor $GUA #BinanceOnline
167

·
--
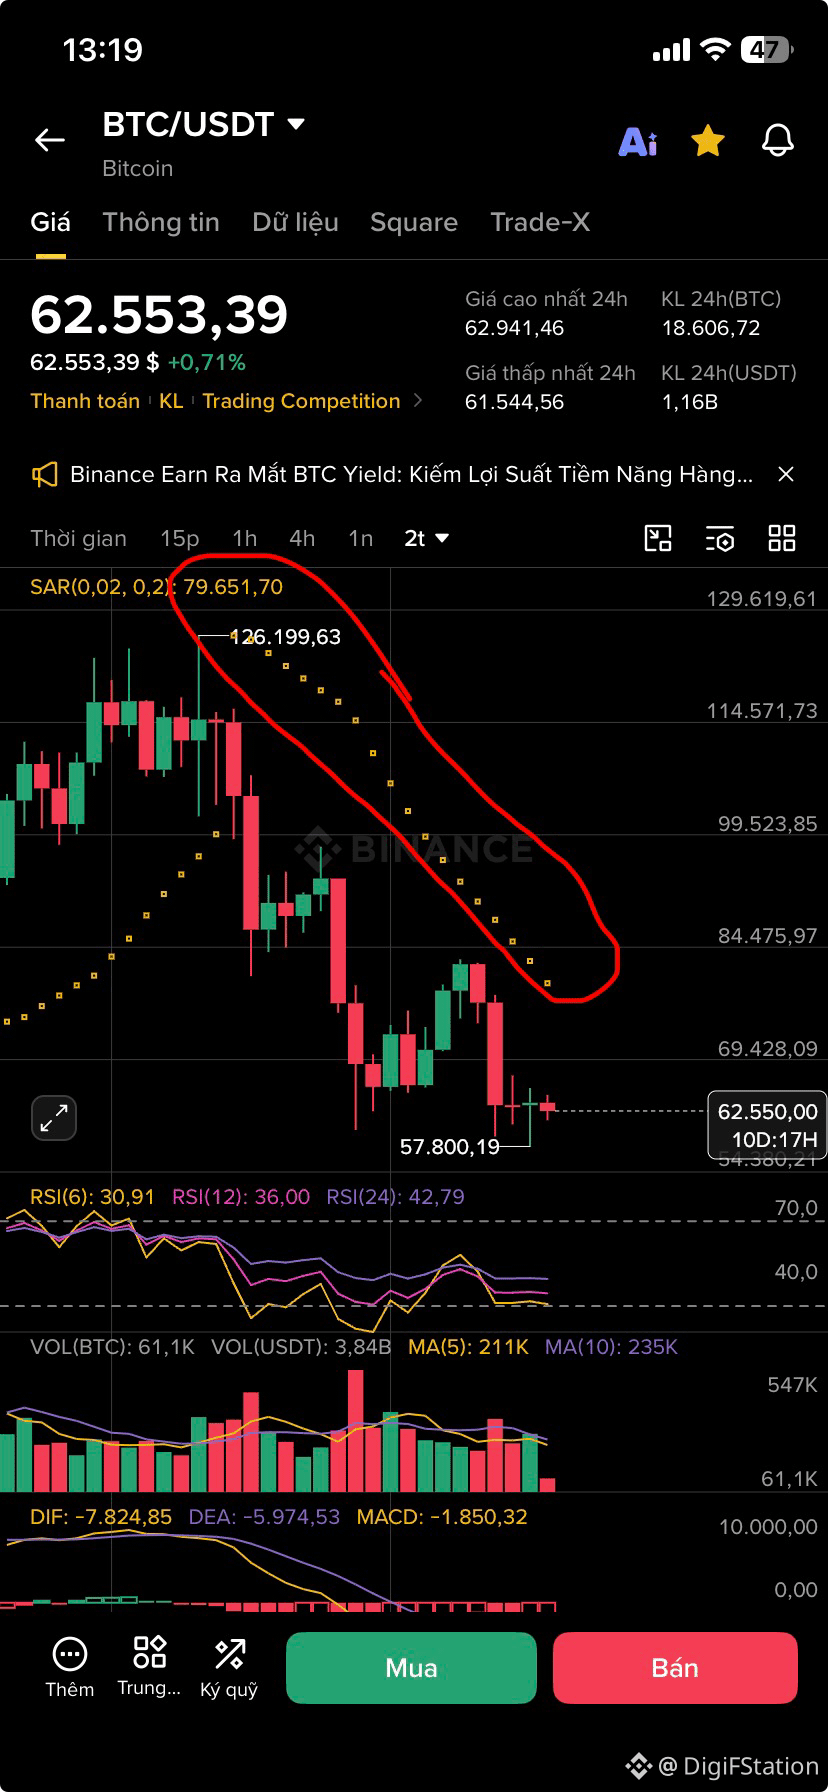
Do not include the decimal point #SAR của 2T that is running
$BTC
No more than 8 dots, otherwise we’ll run out of the bear cycle 🐻
Do not include the decimal point #SAR của 2T that is running
$BTC
No more than 8 dots, otherwise we’ll run out of the bear cycle 🐻
$BTC
No more than 8 dots, otherwise we’ll run out of the bear cycle 🐻
1
233

·
--
Bearish
See translation
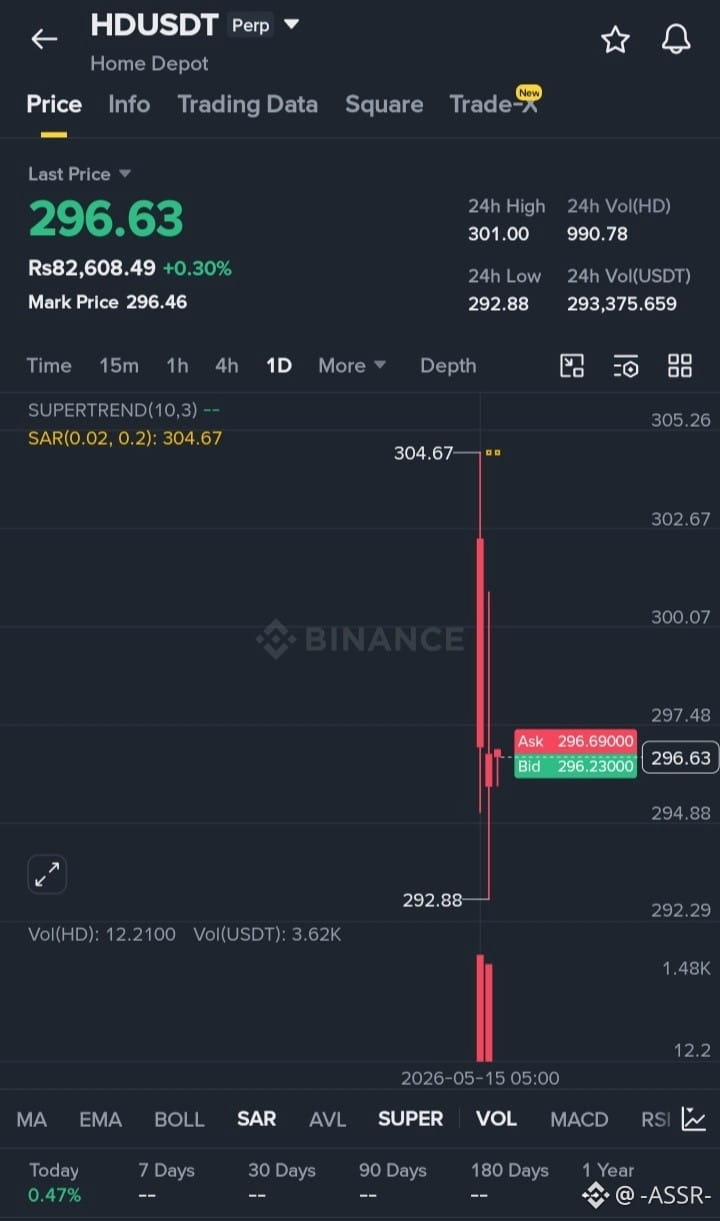
#HDUSDT is currently under strong selling pressure, and the sharp bearish candle clearly shows that sellers are dominating the market. After such a heavy drop, an immediate bullish reversal becomes difficult because buyers usually need time to rebuild confidence and create strong support.
Right now, the smart strategy is patience. Entering a long position too early can be risky because price may still search for a lower support zone before any recovery begins. The #SAR indicator remains above the current price, which confirms that the market trend is still bearish, while the strong red volume spike shows heavy selling activity.
For a real bullish comeback, traders should wait for confirmation such as sideways consolidation, a strong support hold, or a clear reversal pattern like a Double Bottom or Bullish Engulfing candle. Until then, risk management is the most important weapon.
In this market, discipline beats emotion — waiting for the right setup creates bigger profits than chasing uncertain entries.
{future}(HDUSDT)
#HDUSDT is currently under strong selling pressure, and the sharp bearish candle clearly shows that sellers are dominating the market. After such a heavy drop, an immediate bullish reversal becomes difficult because buyers usually need time to rebuild confidence and create strong support.
Right now, the smart strategy is patience. Entering a long position too early can be risky because price may still search for a lower support zone before any recovery begins. The #SAR indicator remains above the current price, which confirms that the market trend is still bearish, while the strong red volume spike shows heavy selling activity.
For a real bullish comeback, traders should wait for confirmation such as sideways consolidation, a strong support hold, or a clear reversal pattern like a Double Bottom or Bullish Engulfing candle. Until then, risk management is the most important weapon.
In this market, discipline beats emotion — waiting for the right setup creates bigger profits than chasing uncertain entries.
Right now, the smart strategy is patience. Entering a long position too early can be risky because price may still search for a lower support zone before any recovery begins. The #SAR indicator remains above the current price, which confirms that the market trend is still bearish, while the strong red volume spike shows heavy selling activity.
For a real bullish comeback, traders should wait for confirmation such as sideways consolidation, a strong support hold, or a clear reversal pattern like a Double Bottom or Bullish Engulfing candle. Until then, risk management is the most important weapon.
In this market, discipline beats emotion — waiting for the right setup creates bigger profits than chasing uncertain entries.
2
185


·
--
See translation
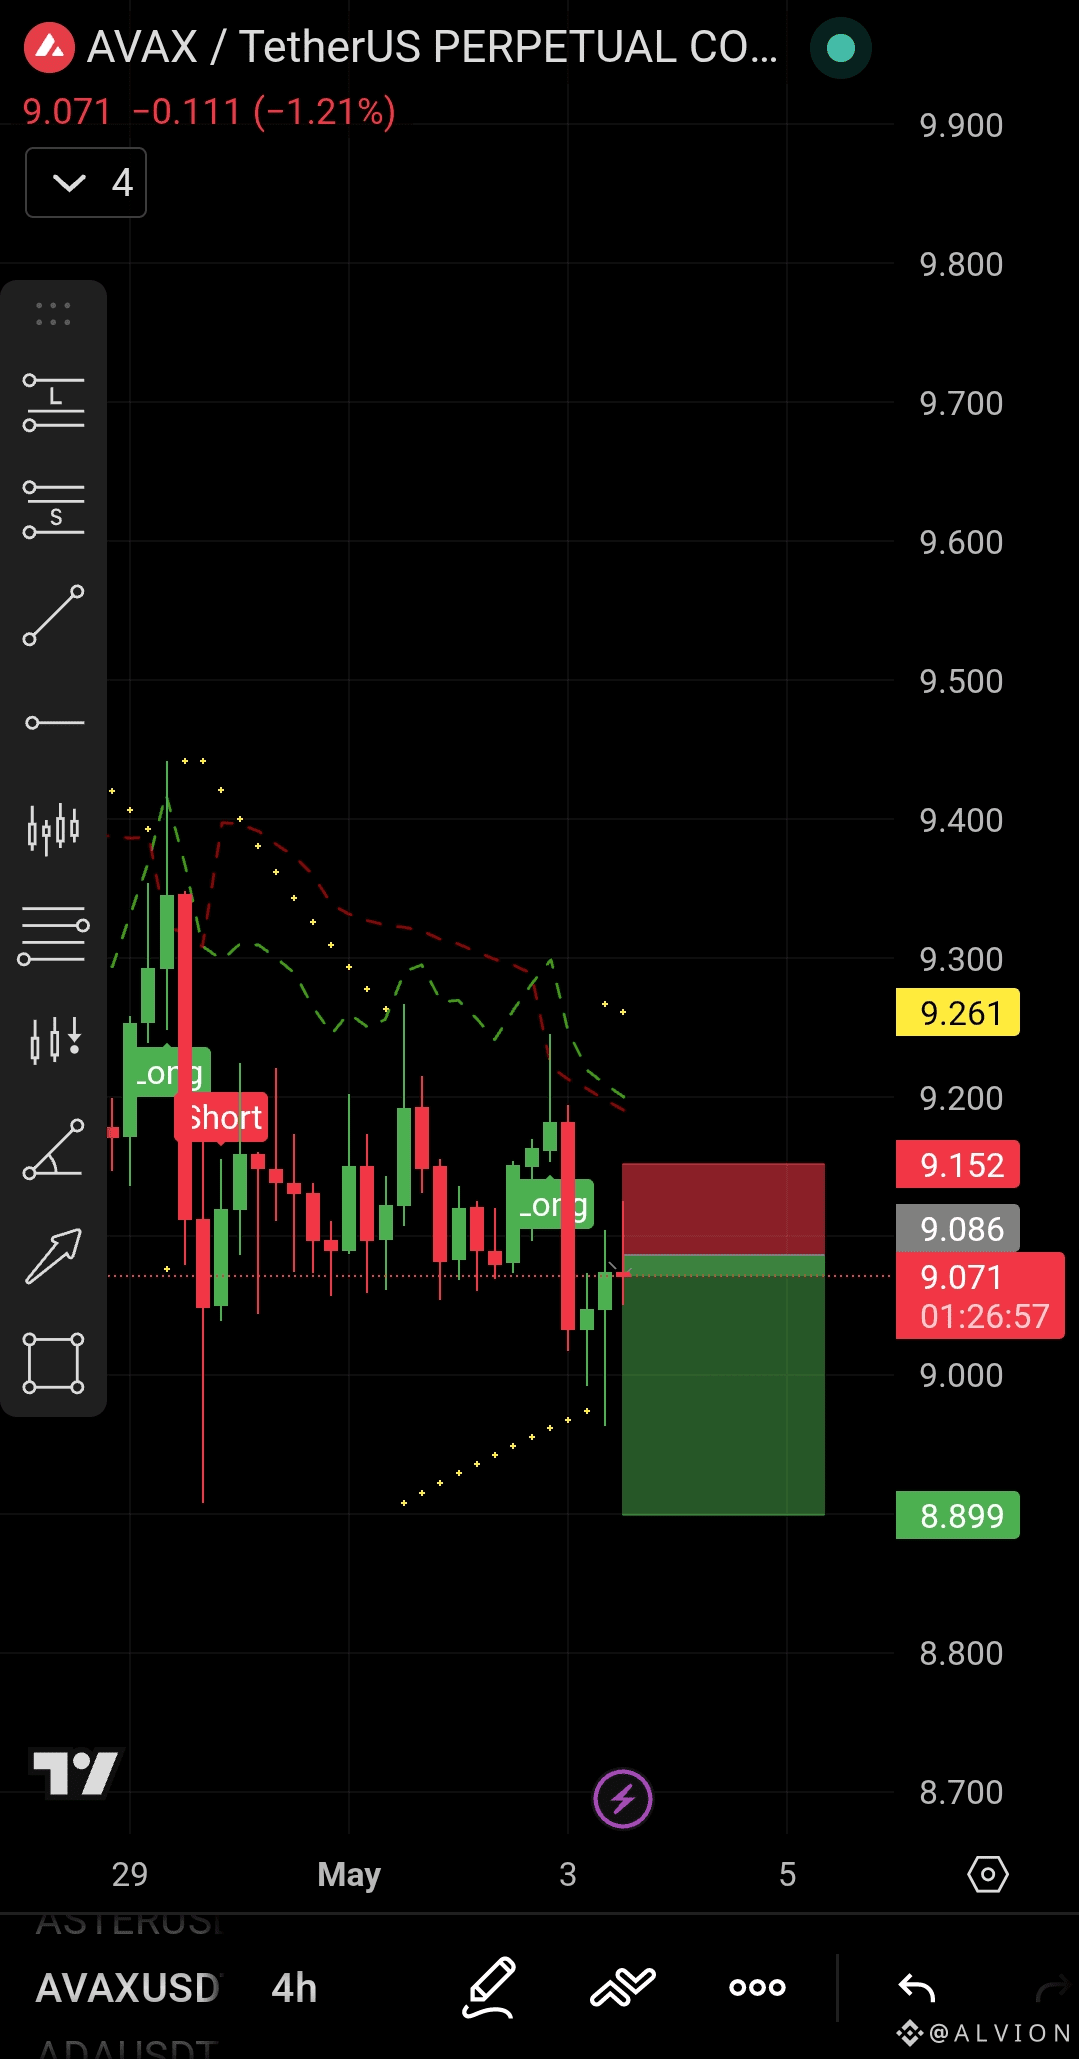
$AVAX just got rejected hard from 9.40 and the Parabolic #SAR flipped bearish 🔴 both signals are screaming short right now
{future}(AVAXUSDT)
Price is sitting at 9.071 and the structure is weak so this is your window my dear friends ✨💯
📍 Entry: 9.086
🛑 Stop Loss: 9.261
🎯 TP1: 9.000
🎯 TP2: 8.950
🎯 TP3: 8.899
Risk is tight and the reward is clean. Jump in fast or miss the move...!!!
#BlackRockUrgesOCCToDropTokenizedReserveCapIdea #U.S.SenatorsBarredfromTradingonPredictionMarkets #MetaandStripeReenterStablecoinPayments
$AVAX just got rejected hard from 9.40 and the Parabolic #SAR flipped bearish 🔴 both signals are screaming short right now
Price is sitting at 9.071 and the structure is weak so this is your window my dear friends ✨💯
📍 Entry: 9.086
🛑 Stop Loss: 9.261
🎯 TP1: 9.000
🎯 TP2: 8.950
🎯 TP3: 8.899
Risk is tight and the reward is clean. Jump in fast or miss the move...!!!
#BlackRockUrgesOCCToDropTokenizedReserveCapIdea #U.S.SenatorsBarredfromTradingonPredictionMarkets #MetaandStripeReenterStablecoinPayments
Price is sitting at 9.071 and the structure is weak so this is your window my dear friends ✨💯
📍 Entry: 9.086
🛑 Stop Loss: 9.261
🎯 TP1: 9.000
🎯 TP2: 8.950
🎯 TP3: 8.899
Risk is tight and the reward is clean. Jump in fast or miss the move...!!!
#BlackRockUrgesOCCToDropTokenizedReserveCapIdea #U.S.SenatorsBarredfromTradingonPredictionMarkets #MetaandStripeReenterStablecoinPayments
2
663
Log in to explore more content
Join global crypto users on Binance Square
⚡️ Get latest and useful information about crypto.
💬 Trusted by the world’s largest crypto exchange.
👍 Discover real insights from verified creators.
Email / Phone number
Trending Topics
1
#JobsReportRaisesHikeOdds
534,961 views
3,427 Discussing
2
#CPITestsDecemberRateOutlook
160,570 views
1,187 Discussing
3
#US Data Center Rules May Constrain AI Expansion
74,766 views
229 Discussing
4
#ARKPlans14ThematicETFsCoveringAIAndTokenizedMarkets
4,477 views
69 Discussing
5
#WillAnthropicListOnTime
162,192 views
1,409 Discussing
6
#WillUS-IranTensionsBoostSafe-HavenDemand?
74,705 views
547 Discussing
7
#BitcoinETFsSee$412MNetOutflows
16,211 views
77 Discussing
8
#HKSFCPlansToRestrictCryptoAndExchangeTerms
63,419 views
576 Discussing
9
#TradFiForBeginners
95,180 views
1,027 Discussing
10
#FinCENAndFedWithdraw$250CryptoTransferProposal
10,541 views
17 Discussing