
#jst
jst
418,152 views
4,844 Discussing
Hot
Latest

·
--
See translation
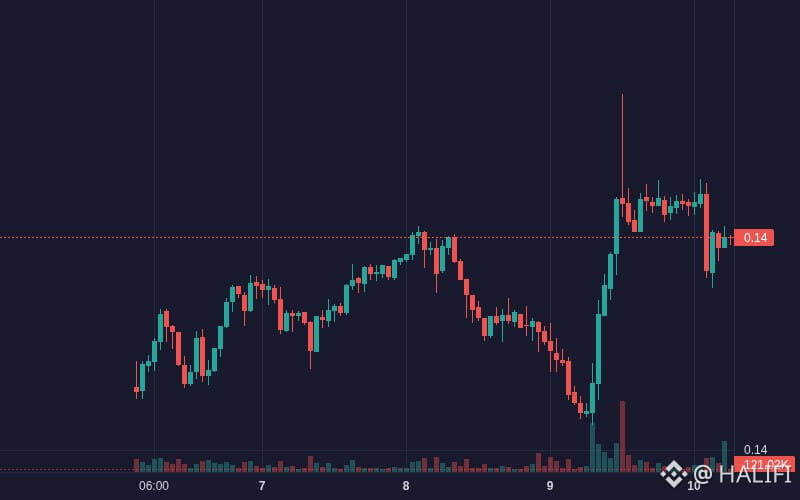
$JST JST is showing bullish movement: 2.56% (Crypto).
Volume: 3.80M | Last: $0.144420
Key signals: high trader activity.
Bias Daily: BULLISH 🟢 | Weekly: BULLISH 🟢
JST climbed 2.4% over 24 hours driven by staking yield incentives before encountering technical cooling near $0.145.
**Staking incentive rollout (High)**: CEX wallet introduced TRON Carnival Season 3 featuring up to 30.56% APY for JST deposits → ignited sustained buying demand
- **Spot capital influx (High)**: Substantial net positive hourly inflows peaked above $368K, driving JST from $0.1408 to a high of $0.1452
- **Bullish trend continuation (Medium)**: Short-term EMA 7 crossed firmly above EMA 25 and EMA 99, cementing an intraday structural uptrend
#JST #BinanceSquare #AIChipSlumpNasdaq #NVIDIA #Crypto
$JST JST is showing bullish movement: 2.56% (Crypto).
Volume: 3.80M | Last: $0.144420
Key signals: high trader activity.
Bias Daily: BULLISH 🟢 | Weekly: BULLISH 🟢
JST climbed 2.4% over 24 hours driven by staking yield incentives before encountering technical cooling near $0.145.
**Staking incentive rollout (High)**: CEX wallet introduced TRON Carnival Season 3 featuring up to 30.56% APY for JST deposits → ignited sustained buying demand
- **Spot capital influx (High)**: Substantial net positive hourly inflows peaked above $368K, driving JST from $0.1408 to a high of $0.1452
- **Bullish trend continuation (Medium)**: Short-term EMA 7 crossed firmly above EMA 25 and EMA 99, cementing an intraday structural uptrend
#JST #BinanceSquare #AIChipSlumpNasdaq #NVIDIA #Crypto
Volume: 3.80M | Last: $0.144420
Key signals: high trader activity.
Bias Daily: BULLISH 🟢 | Weekly: BULLISH 🟢
JST climbed 2.4% over 24 hours driven by staking yield incentives before encountering technical cooling near $0.145.
**Staking incentive rollout (High)**: CEX wallet introduced TRON Carnival Season 3 featuring up to 30.56% APY for JST deposits → ignited sustained buying demand
- **Spot capital influx (High)**: Substantial net positive hourly inflows peaked above $368K, driving JST from $0.1408 to a high of $0.1452
- **Bullish trend continuation (Medium)**: Short-term EMA 7 crossed firmly above EMA 25 and EMA 99, cementing an intraday structural uptrend
#JST #BinanceSquare #AIChipSlumpNasdaq #NVIDIA #Crypto
3


See translation
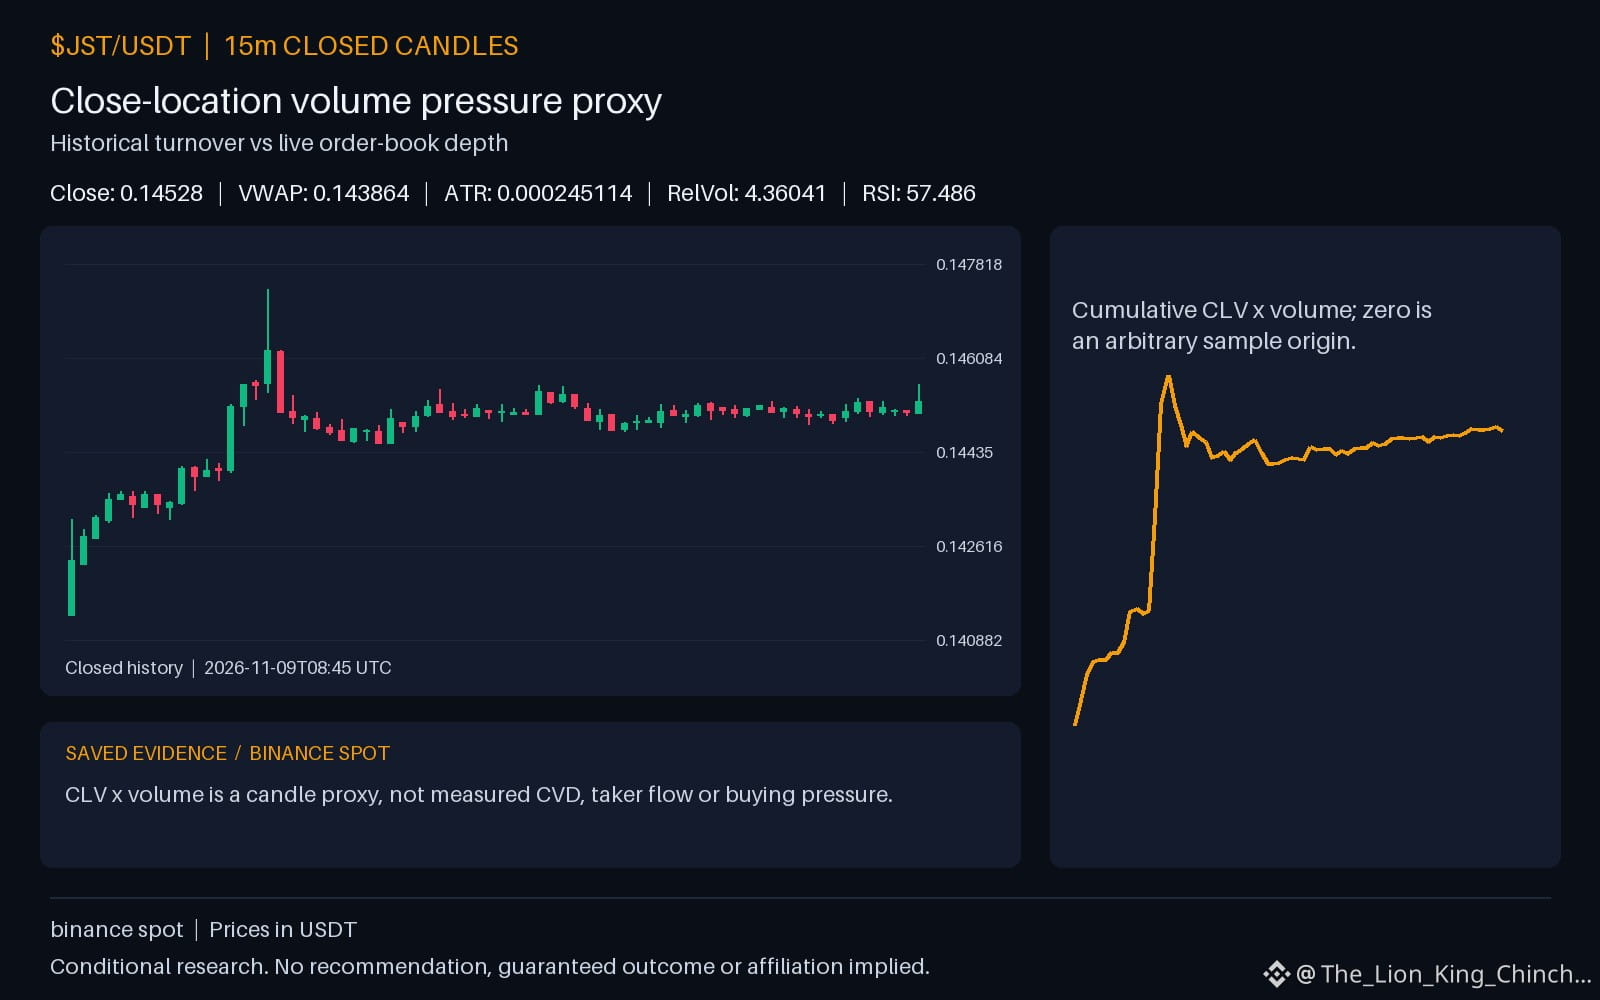
$JST: Depth vs Turnover
Historical turnover versus live order-book depth
Many traders assume daily volume equals immediate liquidity. This is a common misconception. Volume counts filled orders over a period. Live depth shows resting limit orders waiting at various prices. A high historical volume does not guarantee that the order book remains thick during a fast move. This is a hypothetical mechanism, not an assertion about actual traders or this asset.
Evidence and an alternative
The recorded quote volume for $JST is 3.32671e+06. Relative volume is 4.36041. Price is 0.14528. The hourly direction is up. Volume is above baseline. However, historical totals can mislead. If a large portion of that daily turnover occurred in a quiet session, the live book may be thin now. A fast move might encounter wider spreads if resting orders are sparse. This is a thought experiment, not a current fact. We cannot infer motives, stop clusters, or absorption from these numbers alone.
A practical self-check
To reassess this interpretation, compare the daily volume against the live bid-ask spread. If the spread widens significantly during a move, the effective liquidity is lower than the historical total suggests. Check the ATR, which is 0.000245114, to gauge recent volatility. If the price moves quickly relative to the spread, slippage risk increases. This self-check helps distinguish between high turnover and high immediate depth. Do not treat this as a trade instruction. The limits of this analysis are clear: we only have bound facts. No causation is claimed. The observation remains that volume is above baseline while price moves hourly.
Probabilistic market research, not a recommendation or guaranteed return.
What is the biggest difference you have experienced between a coin's advertised daily volume and its real-time spread during a fast move?
#JST #CryptoLearning
$JST : Depth vs Turnover
Historical turnover versus live order-book depth
Many traders assume daily volume equals immediate liquidity. This is a common misconception. Volume counts filled orders over a period. Live depth shows resting limit orders waiting at various prices. A high historical volume does not guarantee that the order book remains thick during a fast move. This is a hypothetical mechanism, not an assertion about actual traders or this asset.
Evidence and an alternative
The recorded quote volume for $JST is 3.32671e+06. Relative volume is 4.36041. Price is 0.14528. The hourly direction is up. Volume is above baseline. However, historical totals can mislead. If a large portion of that daily turnover occurred in a quiet session, the live book may be thin now. A fast move might encounter wider spreads if resting orders are sparse. This is a thought experiment, not a current fact. We cannot infer motives, stop clusters, or absorption from these numbers alone.
A practical self-check
To reassess this interpretation, compare the daily volume against the live bid-ask spread. If the spread widens significantly during a move, the effective liquidity is lower than the historical total suggests. Check the ATR, which is 0.000245114, to gauge recent volatility. If the price moves quickly relative to the spread, slippage risk increases. This self-check helps distinguish between high turnover and high immediate depth. Do not treat this as a trade instruction. The limits of this analysis are clear: we only have bound facts. No causation is claimed. The observation remains that volume is above baseline while price moves hourly.
Probabilistic market research, not a recommendation or guaranteed return.
What is the biggest difference you have experienced between a coin's advertised daily volume and its real-time spread during a fast move?
#JST #CryptoLearning
Historical turnover versus live order-book depth
Many traders assume daily volume equals immediate liquidity. This is a common misconception. Volume counts filled orders over a period. Live depth shows resting limit orders waiting at various prices. A high historical volume does not guarantee that the order book remains thick during a fast move. This is a hypothetical mechanism, not an assertion about actual traders or this asset.
Evidence and an alternative
The recorded quote volume for $JST is 3.32671e+06. Relative volume is 4.36041. Price is 0.14528. The hourly direction is up. Volume is above baseline. However, historical totals can mislead. If a large portion of that daily turnover occurred in a quiet session, the live book may be thin now. A fast move might encounter wider spreads if resting orders are sparse. This is a thought experiment, not a current fact. We cannot infer motives, stop clusters, or absorption from these numbers alone.
A practical self-check
To reassess this interpretation, compare the daily volume against the live bid-ask spread. If the spread widens significantly during a move, the effective liquidity is lower than the historical total suggests. Check the ATR, which is 0.000245114, to gauge recent volatility. If the price moves quickly relative to the spread, slippage risk increases. This self-check helps distinguish between high turnover and high immediate depth. Do not treat this as a trade instruction. The limits of this analysis are clear: we only have bound facts. No causation is claimed. The observation remains that volume is above baseline while price moves hourly.
Probabilistic market research, not a recommendation or guaranteed return.
What is the biggest difference you have experienced between a coin's advertised daily volume and its real-time spread during a fast move?
#JST #CryptoLearning
62
·
--
See translation
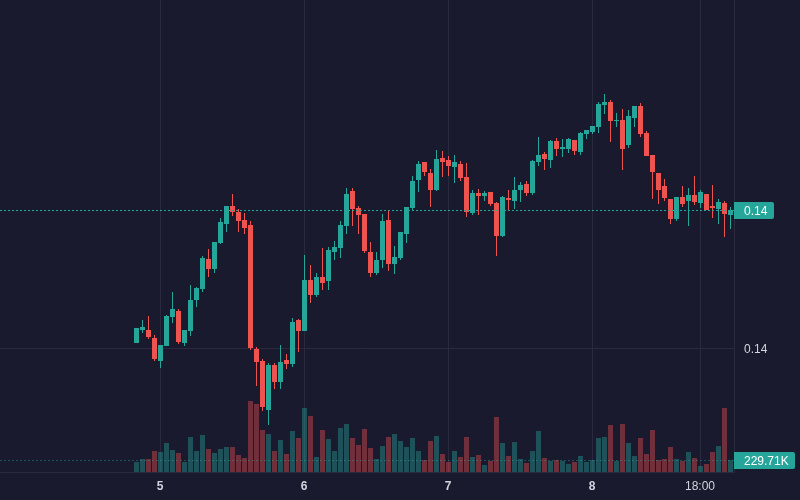
$JST JST is showing bearish movement: -1.02% (Crypto).
Volume: 1.66M | Last: $0.142500
Worth monitoring.
Bias Daily: BULLISH 🟢 | Weekly: BULLISH 🟢
JST slipped 0.87% over 24h as profit-taking and consistent net capital outflows triggered technical breakdowns.
**Sustained capital outflows (High)**: Persistent net order flow outflows, including large-order dumping exceeding -$65K in single hours → forced price down from $0.1444 to $0.1426
- **Bearish momentum shift (High)**: MACD executed a bearish crossover into negative histogram territory → technical selling accelerated
- **Failed resistance breakout (Medium)**: Price rejected near Bollinger Upper Band ($0.1447) as RSI-6 dropped from overbought (82) into oversold territory
#JST #JobsReportRaisesHikeOdds #BinanceSquare #CPITestsDecemberRateOutlook #Crypto
$JST JST is showing bearish movement: -1.02% (Crypto).
Volume: 1.66M | Last: $0.142500
Worth monitoring.
Bias Daily: BULLISH 🟢 | Weekly: BULLISH 🟢
JST slipped 0.87% over 24h as profit-taking and consistent net capital outflows triggered technical breakdowns.
**Sustained capital outflows (High)**: Persistent net order flow outflows, including large-order dumping exceeding -$65K in single hours → forced price down from $0.1444 to $0.1426
- **Bearish momentum shift (High)**: MACD executed a bearish crossover into negative histogram territory → technical selling accelerated
- **Failed resistance breakout (Medium)**: Price rejected near Bollinger Upper Band ($0.1447) as RSI-6 dropped from overbought (82) into oversold territory
#JST #JobsReportRaisesHikeOdds #BinanceSquare #CPITestsDecemberRateOutlook #Crypto
Volume: 1.66M | Last: $0.142500
Worth monitoring.
Bias Daily: BULLISH 🟢 | Weekly: BULLISH 🟢
JST slipped 0.87% over 24h as profit-taking and consistent net capital outflows triggered technical breakdowns.
**Sustained capital outflows (High)**: Persistent net order flow outflows, including large-order dumping exceeding -$65K in single hours → forced price down from $0.1444 to $0.1426
- **Bearish momentum shift (High)**: MACD executed a bearish crossover into negative histogram territory → technical selling accelerated
- **Failed resistance breakout (Medium)**: Price rejected near Bollinger Upper Band ($0.1447) as RSI-6 dropped from overbought (82) into oversold territory
#JST #JobsReportRaisesHikeOdds #BinanceSquare #CPITestsDecemberRateOutlook #Crypto
9

·
--
See translation
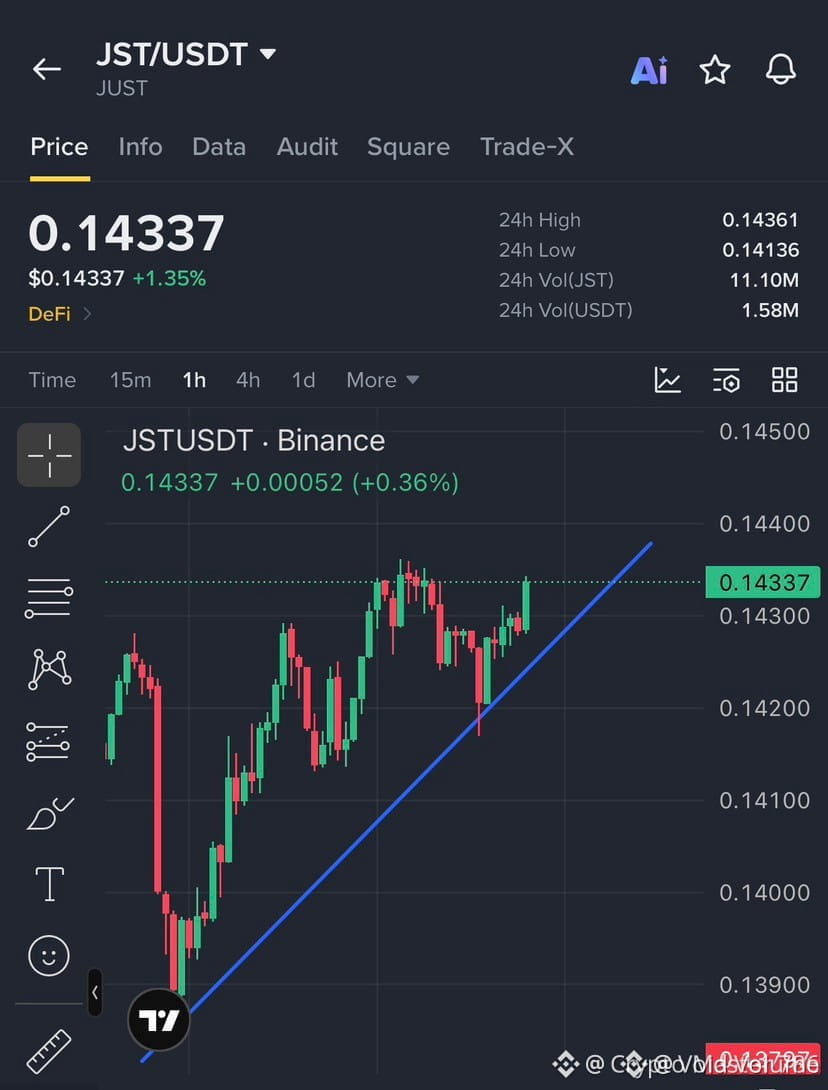
🦈 $JST DEFENDS CRITICAL LIQUIDITY BASE AS SMART MONEY BUILDS FOR THE BREAKOUT ⚡
Entry: $0.1430 – $0.1434 ⚡
Target: $0.1438 / $0.1443 / $0.1450 🚀
Stop Loss: $0.1418 ⚠️
Institutional order flow is firmly respecting the $0.1420 demand shelf, absorbing retail supply while sellers exhaust their liquidity. 📊 A decisive structural push above the $0.1436 threshold will invalidate overhead resistance and unlock higher time frame inefficiencies. ⚡
Patience is key as price coils tightly within this accumulation phase before the next directional impulse. 💡 Are you positioned for the sweep into the upper targets, or waiting for a deeper retest? 👇
⚠️ Not financial advice. Always manage your risk. 🛡️
🏷️ #JST #SmartMoney #Breakout #Crypto
🦈 💎
🦈 $JST DEFENDS CRITICAL LIQUIDITY BASE AS SMART MONEY BUILDS FOR THE BREAKOUT ⚡
Entry: $0.1430 – $0.1434 ⚡
Target: $0.1438 / $0.1443 / $0.1450 🚀
Stop Loss: $0.1418 ⚠️
Institutional order flow is firmly respecting the $0.1420 demand shelf, absorbing retail supply while sellers exhaust their liquidity. 📊 A decisive structural push above the $0.1436 threshold will invalidate overhead resistance and unlock higher time frame inefficiencies. ⚡
Patience is key as price coils tightly within this accumulation phase before the next directional impulse. 💡 Are you positioned for the sweep into the upper targets, or waiting for a deeper retest? 👇
⚠️ Not financial advice. Always manage your risk. 🛡️
🏷️ #JST #SmartMoney #Breakout #Crypto
🦈 💎
Entry: $0.1430 – $0.1434 ⚡
Target: $0.1438 / $0.1443 / $0.1450 🚀
Stop Loss: $0.1418 ⚠️
Institutional order flow is firmly respecting the $0.1420 demand shelf, absorbing retail supply while sellers exhaust their liquidity. 📊 A decisive structural push above the $0.1436 threshold will invalidate overhead resistance and unlock higher time frame inefficiencies. ⚡
Patience is key as price coils tightly within this accumulation phase before the next directional impulse. 💡 Are you positioned for the sweep into the upper targets, or waiting for a deeper retest? 👇
⚠️ Not financial advice. Always manage your risk. 🛡️
🏷️ #JST #SmartMoney #Breakout #Crypto
🦈 💎
2

·
--
See translation
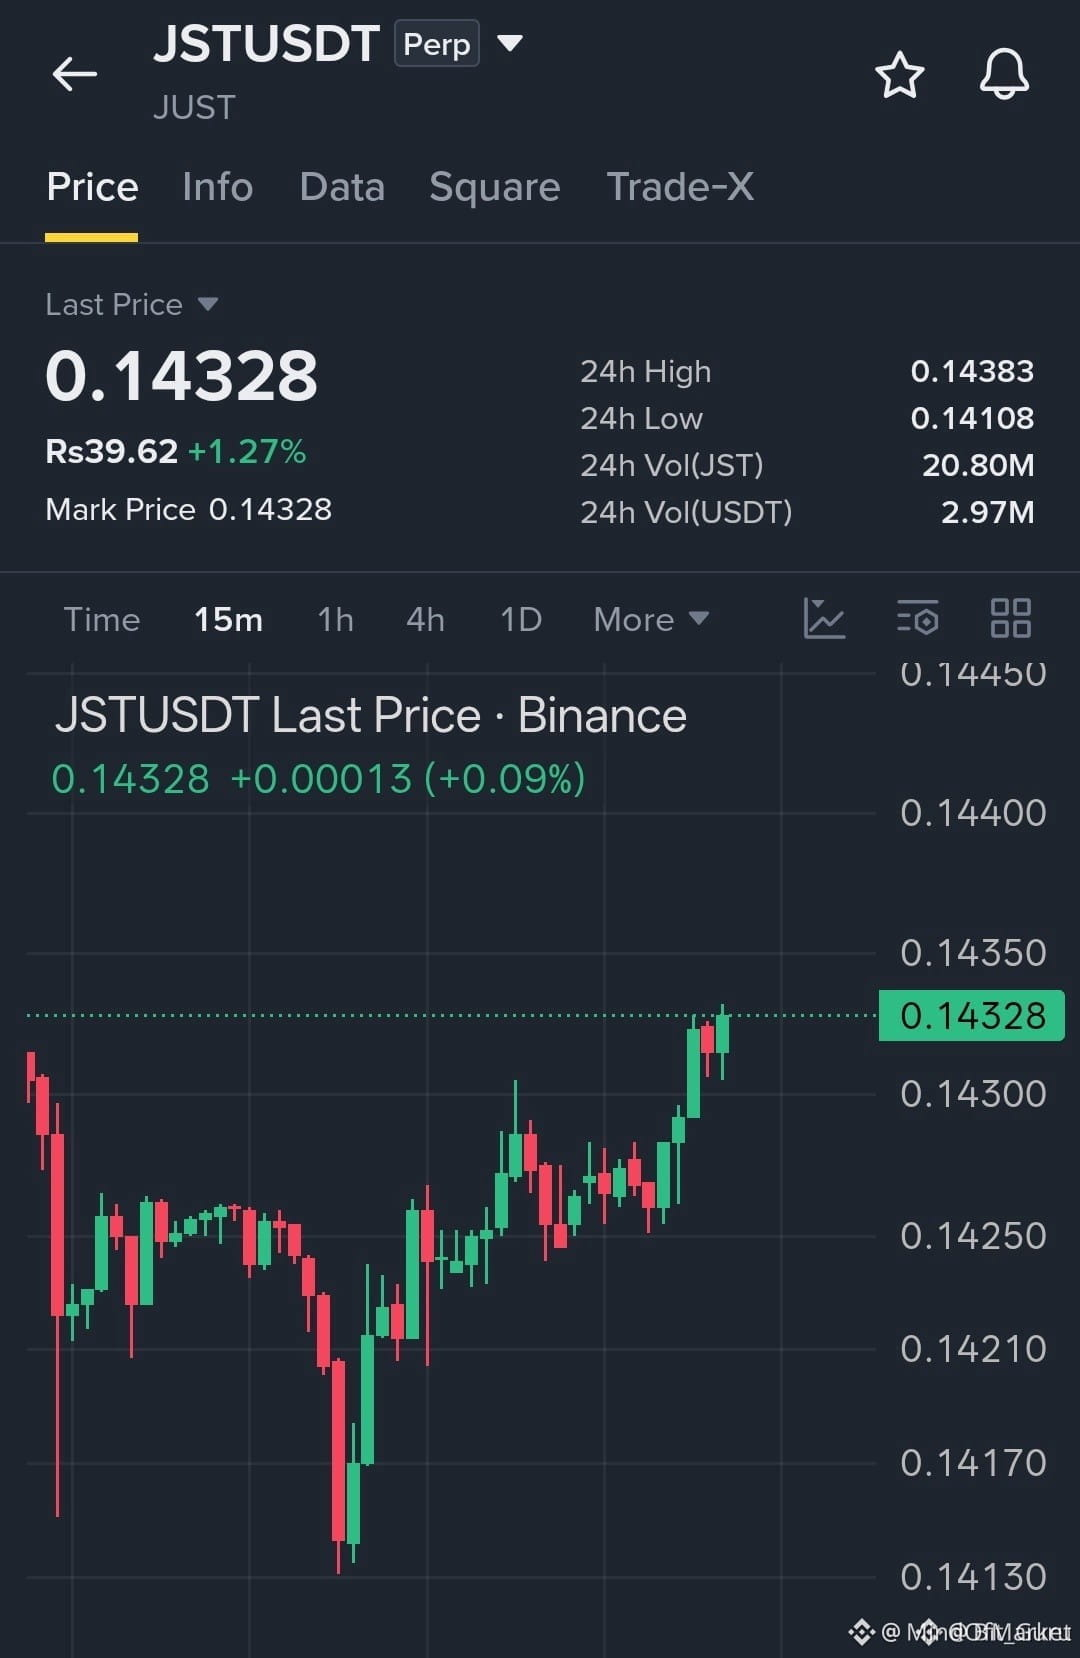
🚨 $JST COMPRESSING BELOW 0.14350 BEFORE EXPANSION
Entry: 0.14300-0.14325 ⚡
Target: 0.14500 🚀
Stop Loss: 0.14250 ⚠️
The lower timeframe structure reveals aggressive institutional accumulation as buyers step in to absorb supply on the fifteen-minute chart. Price action is coiling tightly against the resistance threshold, signaling that a volatility expansion is imminent.
When this immediate supply wall gives way, expect an aggressive sweep toward higher liquidity pools as momentum traders pile into the breakout.
🤔 Are you positioning ahead of the breakout or waiting for confirmation above resistance?
⚠️ Not financial advice. Always manage your risk. 🛡️
🏷️ #JST #Breakout #Crypto #LongSetup
🔥
🚨 $JST COMPRESSING BELOW 0.14350 BEFORE EXPANSION
Entry: 0.14300-0.14325 ⚡
Target: 0.14500 🚀
Stop Loss: 0.14250 ⚠️
The lower timeframe structure reveals aggressive institutional accumulation as buyers step in to absorb supply on the fifteen-minute chart. Price action is coiling tightly against the resistance threshold, signaling that a volatility expansion is imminent.
When this immediate supply wall gives way, expect an aggressive sweep toward higher liquidity pools as momentum traders pile into the breakout.
🤔 Are you positioning ahead of the breakout or waiting for confirmation above resistance?
⚠️ Not financial advice. Always manage your risk. 🛡️
🏷️ #JST #Breakout #Crypto #LongSetup
🔥
Entry: 0.14300-0.14325 ⚡
Target: 0.14500 🚀
Stop Loss: 0.14250 ⚠️
The lower timeframe structure reveals aggressive institutional accumulation as buyers step in to absorb supply on the fifteen-minute chart. Price action is coiling tightly against the resistance threshold, signaling that a volatility expansion is imminent.
When this immediate supply wall gives way, expect an aggressive sweep toward higher liquidity pools as momentum traders pile into the breakout.
🤔 Are you positioning ahead of the breakout or waiting for confirmation above resistance?
⚠️ Not financial advice. Always manage your risk. 🛡️
🏷️ #JST #Breakout #Crypto #LongSetup
🔥
1

See translation
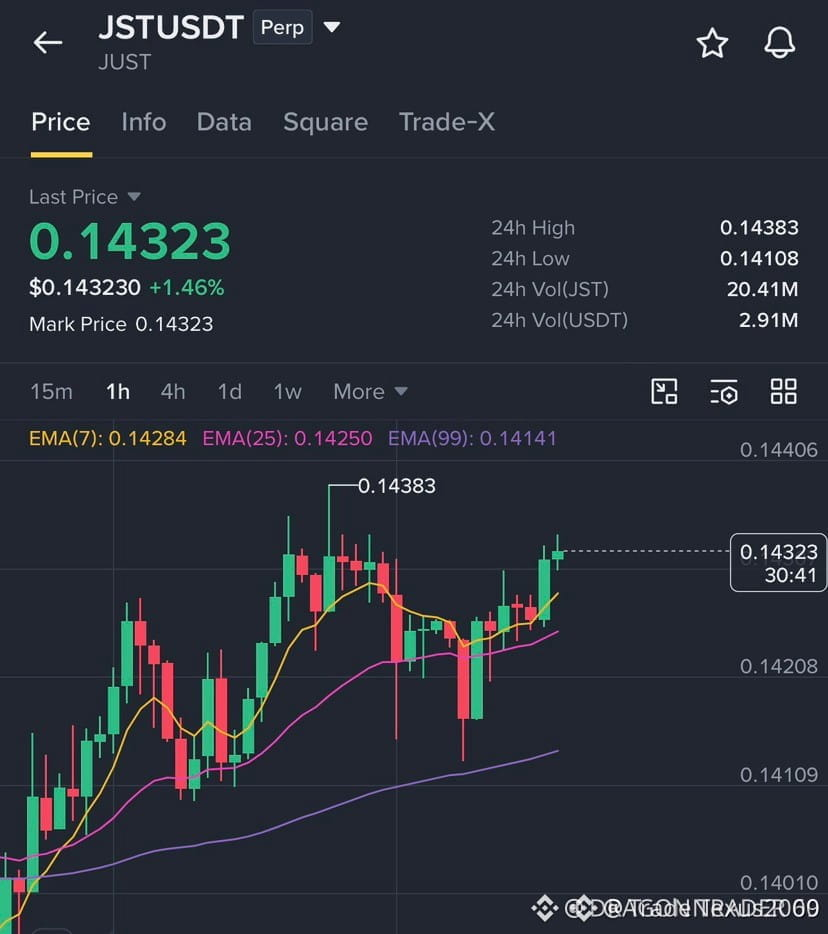
🦈 $JST DEFENDING INSTITUTIONAL SUPPORT WHILE SMART MONEY PREPARES FOR THE BREAKOUT ⚡
Entry: $0.1425 – $0.1433 ⚡
Target: $0.1450 🚀
Stop Loss: $0.1418 ⚠️
The order flow around the 0.1420 structural floor shows aggressive institutional absorption, completely neutralizing late seller pressure and preserving the higher-timeframe equilibrium. 📊
As resting liquidity accumulates above the 0.1436 threshold, expect an impulsive expansion phase once sellers trapped below that resistance are forced to cover. ⚡
Are you positioning within the accumulation zone now, or waiting for the clean breakout confirmation? 🤔
⚠️ Not financial advice. Always manage your risk. 🛡️
🏷️ #JST #SmartMoney #OrderBlock #Crypto
🦈 💎
🦈 $JST DEFENDING INSTITUTIONAL SUPPORT WHILE SMART MONEY PREPARES FOR THE BREAKOUT ⚡
Entry: $0.1425 – $0.1433 ⚡
Target: $0.1450 🚀
Stop Loss: $0.1418 ⚠️
The order flow around the 0.1420 structural floor shows aggressive institutional absorption, completely neutralizing late seller pressure and preserving the higher-timeframe equilibrium. 📊
As resting liquidity accumulates above the 0.1436 threshold, expect an impulsive expansion phase once sellers trapped below that resistance are forced to cover. ⚡
Are you positioning within the accumulation zone now, or waiting for the clean breakout confirmation? 🤔
⚠️ Not financial advice. Always manage your risk. 🛡️
🏷️ #JST #SmartMoney #OrderBlock #Crypto
🦈 💎
Entry: $0.1425 – $0.1433 ⚡
Target: $0.1450 🚀
Stop Loss: $0.1418 ⚠️
The order flow around the 0.1420 structural floor shows aggressive institutional absorption, completely neutralizing late seller pressure and preserving the higher-timeframe equilibrium. 📊
As resting liquidity accumulates above the 0.1436 threshold, expect an impulsive expansion phase once sellers trapped below that resistance are forced to cover. ⚡
Are you positioning within the accumulation zone now, or waiting for the clean breakout confirmation? 🤔
⚠️ Not financial advice. Always manage your risk. 🛡️
🏷️ #JST #SmartMoney #OrderBlock #Crypto
🦈 💎
·
--
See translation
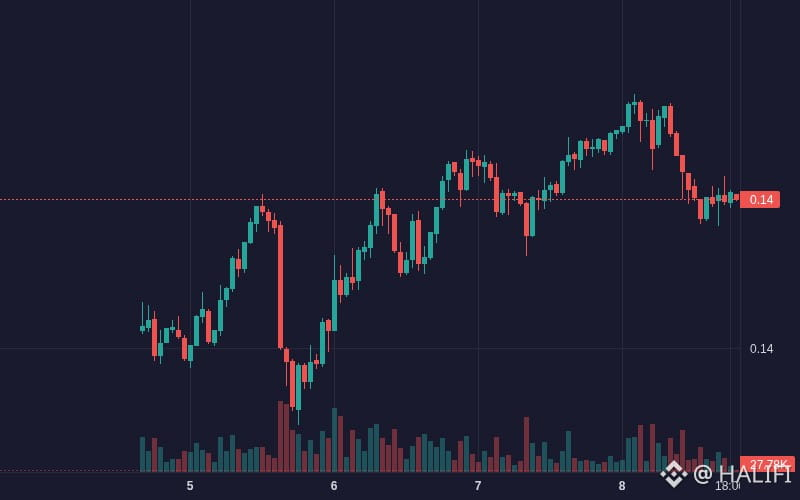
$JST JST is showing bearish movement: -0.59% (Crypto).
Volume: 1.41M | Last: $0.142730
Worth monitoring.
Bias Daily: BULLISH 🟢 | Weekly: BULLISH 🟢
JST slipped 0.67% over 24 hours to $0.14268 after early gains faded on persistent net capital outflows.
**Capital outflows (High)**: Repeated large net outflows totaling over -$350K between hours 14–22 → drove price down from $0.1444 to $0.1423
- **Bearish momentum shift (High)**: MACD histogram turned negative (-0.00019) with 6-period RSI dropping to oversold levels (~18.2) → accelerated intraday selloff
- **Ecosystem tailwinds (Medium)**: Protocol metrics and TVL expansion across TRON DeFi continue to provide fundamental floor near $0.142
#JST #JobsReportRaisesHikeOdds #BinanceSquare #CPITestsDecemberRateOutlook #Crypto
$JST JST is showing bearish movement: -0.59% (Crypto).
Volume: 1.41M | Last: $0.142730
Worth monitoring.
Bias Daily: BULLISH 🟢 | Weekly: BULLISH 🟢
JST slipped 0.67% over 24 hours to $0.14268 after early gains faded on persistent net capital outflows.
**Capital outflows (High)**: Repeated large net outflows totaling over -$350K between hours 14–22 → drove price down from $0.1444 to $0.1423
- **Bearish momentum shift (High)**: MACD histogram turned negative (-0.00019) with 6-period RSI dropping to oversold levels (~18.2) → accelerated intraday selloff
- **Ecosystem tailwinds (Medium)**: Protocol metrics and TVL expansion across TRON DeFi continue to provide fundamental floor near $0.142
#JST #JobsReportRaisesHikeOdds #BinanceSquare #CPITestsDecemberRateOutlook #Crypto
Volume: 1.41M | Last: $0.142730
Worth monitoring.
Bias Daily: BULLISH 🟢 | Weekly: BULLISH 🟢
JST slipped 0.67% over 24 hours to $0.14268 after early gains faded on persistent net capital outflows.
**Capital outflows (High)**: Repeated large net outflows totaling over -$350K between hours 14–22 → drove price down from $0.1444 to $0.1423
- **Bearish momentum shift (High)**: MACD histogram turned negative (-0.00019) with 6-period RSI dropping to oversold levels (~18.2) → accelerated intraday selloff
- **Ecosystem tailwinds (Medium)**: Protocol metrics and TVL expansion across TRON DeFi continue to provide fundamental floor near $0.142
#JST #JobsReportRaisesHikeOdds #BinanceSquare #CPITestsDecemberRateOutlook #Crypto
7

·
--
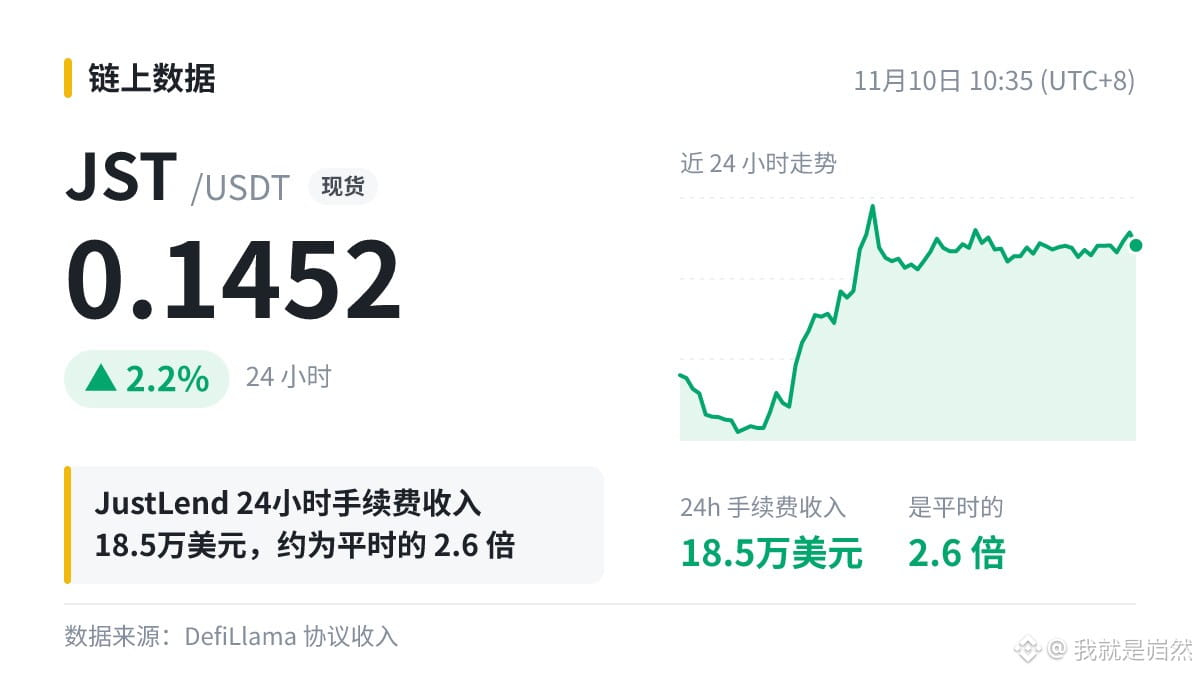
Came across something amusing. On this day, JustLend's fee revenue reached $185,000.
When I see figures like this, I care about the trend; I don't scrutinize the exact decimal places too much. The corresponding token is $JST . A project generating revenue doesn't necessarily mean token holders get a share—it depends on the token's design.
#JST
Came across something amusing. On this day, JustLend's fee revenue reached $185,000.
When I see figures like this, I care about the trend; I don't scrutinize the exact decimal places too much. The corresponding token is $JST . A project generating revenue doesn't necessarily mean token holders get a share—it depends on the token's design.
#JST
When I see figures like this, I care about the trend; I don't scrutinize the exact decimal places too much. The corresponding token is $JST . A project generating revenue doesn't necessarily mean token holders get a share—it depends on the token's design.
#JST
195

·
--
Bullish
Do you really know how to diversify?
Do you know which coins to buy while $BTC destroys accounts?
Learn to invest, not just buy👇
{spot}(BTCUSDT)
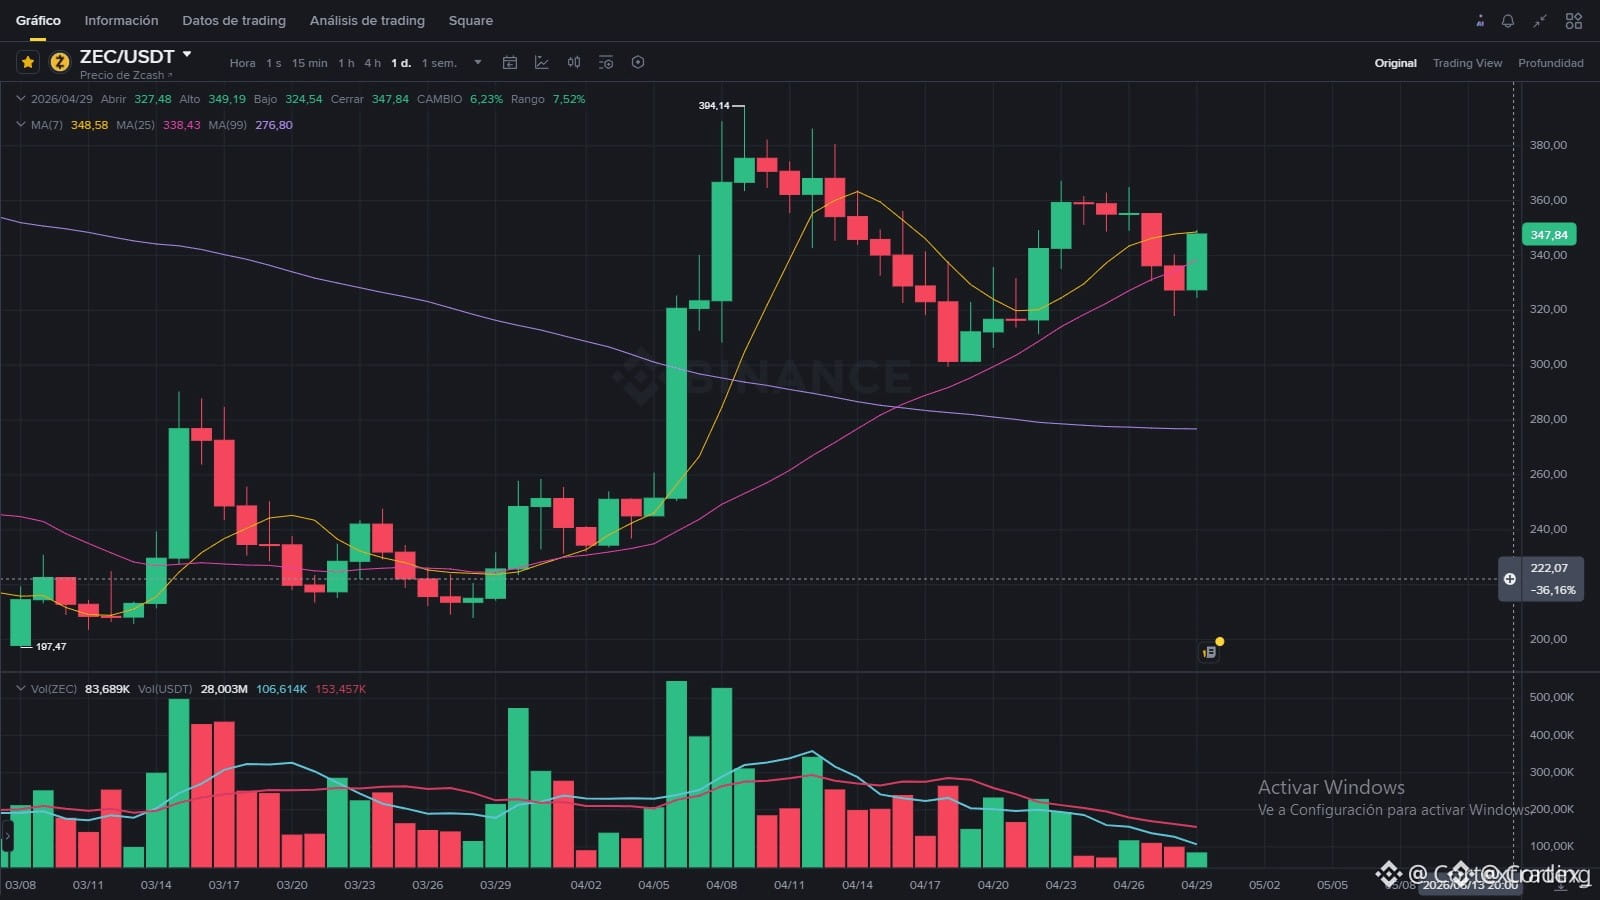
For those who think I've only been talking about $ZEC for two days
Well, no—I've been talking about it since 2025 because of its project.
{spot}(ZECUSDT)
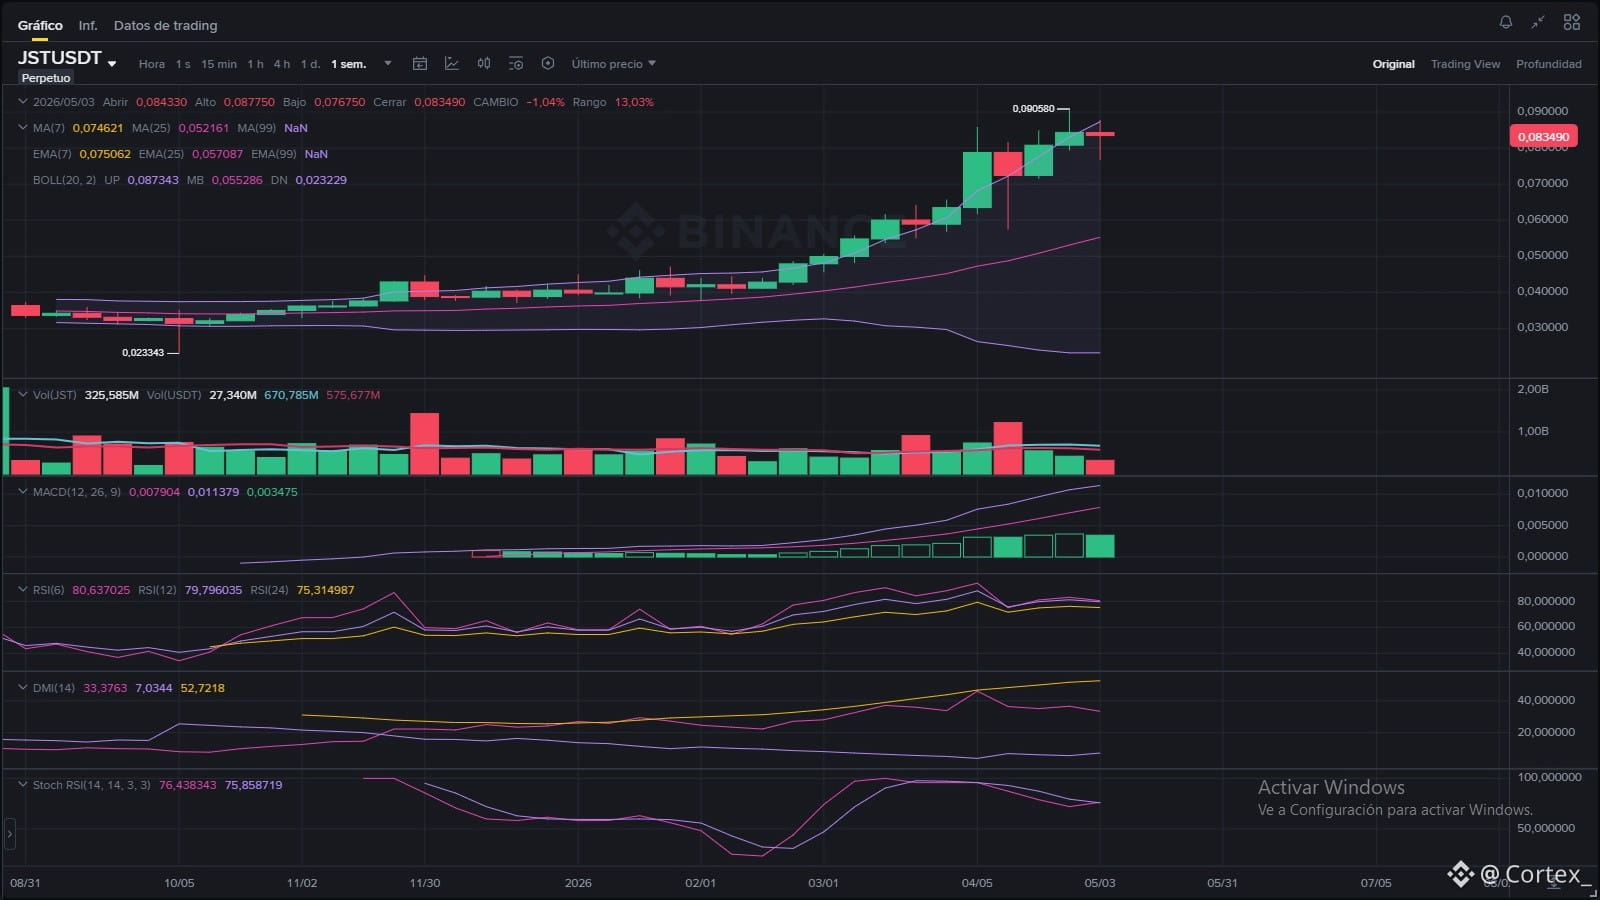
Or even one of the best projections I've made: the one for #jst , which I recommended you buy amid the uncertainty around the price of #BTC . Look at the chart today ✍️💵
{spot}(JSTUSDT)
But why do I recommend these kinds of coins? Isn't it good to buy #solana or #ETH ? Is it all a lie?
Well, yes and no.
It's always good to buy those coins and have them in your portfolio. The problem isn't the coins themselves, but the fact that their dependence on BTC makes them move practically in lockstep with #BTC .
Let me put it this way.
If your spot purchases today are at considerable losses, it's probably because BTC dragged them into the abyss. That happens because of its dominance, driven by the capital flowing into it. So did you really diversify your capital? The theoretical answer is yes, but in practice, NO.
If you buy Solana, ETH, or XRP, you're directly waiting for BTC to make a move. So what's the solution?
Investing in other equally solid projects or established coins is what will really give you genuine diversification. Also, if one part of your portfolio is in the red, then by buying strategically, the other coins will probably be in the green.
JST and TRX are coins that don't move with BTC because they share a project and are practically like a bank, as well as being long-term deflationary systems.
ZEC and XMR are privacy coins that attract capital during turbulent market conditions.
Or even $PAXG itself, which is a safe-haven asset by nature.
It's not about buying the #FOMO of AI or whatever; it's about thinking like an investor, not a consumer.
That's the difference.
Do you really know how to diversify?
Do you know which coins to buy while $BTC destroys accounts?
Learn to invest, not just buy👇
For those who think I've only been talking about $ZEC for two days
Well, no—I've been talking about it since 2025 because of its project.
Or even one of the best projections I've made: the one for #jst , which I recommended you buy amid the uncertainty around the price of #BTC . Look at the chart today ✍️💵
But why do I recommend these kinds of coins? Isn't it good to buy #solana or #ETH ? Is it all a lie?
Well, yes and no.
It's always good to buy those coins and have them in your portfolio. The problem isn't the coins themselves, but the fact that their dependence on BTC makes them move practically in lockstep with #BTC .
Let me put it this way.
If your spot purchases today are at considerable losses, it's probably because BTC dragged them into the abyss. That happens because of its dominance, driven by the capital flowing into it. So did you really diversify your capital? The theoretical answer is yes, but in practice, NO.
If you buy Solana, ETH, or XRP, you're directly waiting for BTC to make a move. So what's the solution?
Investing in other equally solid projects or established coins is what will really give you genuine diversification. Also, if one part of your portfolio is in the red, then by buying strategically, the other coins will probably be in the green.
JST and TRX are coins that don't move with BTC because they share a project and are practically like a bank, as well as being long-term deflationary systems.
ZEC and XMR are privacy coins that attract capital during turbulent market conditions.
Or even $PAXG itself, which is a safe-haven asset by nature.
It's not about buying the #FOMO of AI or whatever; it's about thinking like an investor, not a consumer.
That's the difference.
Do you know which coins to buy while $BTC destroys accounts?
Learn to invest, not just buy👇
For those who think I've only been talking about $ZEC for two days
Well, no—I've been talking about it since 2025 because of its project.
Or even one of the best projections I've made: the one for #jst , which I recommended you buy amid the uncertainty around the price of #BTC . Look at the chart today ✍️💵
But why do I recommend these kinds of coins? Isn't it good to buy #solana or #ETH ? Is it all a lie?
Well, yes and no.
It's always good to buy those coins and have them in your portfolio. The problem isn't the coins themselves, but the fact that their dependence on BTC makes them move practically in lockstep with #BTC .
Let me put it this way.
If your spot purchases today are at considerable losses, it's probably because BTC dragged them into the abyss. That happens because of its dominance, driven by the capital flowing into it. So did you really diversify your capital? The theoretical answer is yes, but in practice, NO.
If you buy Solana, ETH, or XRP, you're directly waiting for BTC to make a move. So what's the solution?
Investing in other equally solid projects or established coins is what will really give you genuine diversification. Also, if one part of your portfolio is in the red, then by buying strategically, the other coins will probably be in the green.
JST and TRX are coins that don't move with BTC because they share a project and are practically like a bank, as well as being long-term deflationary systems.
ZEC and XMR are privacy coins that attract capital during turbulent market conditions.
Or even $PAXG itself, which is a safe-haven asset by nature.
It's not about buying the #FOMO of AI or whatever; it's about thinking like an investor, not a consumer.
That's the difference.


Cortex_
·
--
BullishTHE COINS I RECOMMENDED TO EVERYONE 2 MONTHS AGO ARE EXPLODING 😉🤷♂️
IT WASN'T A COINCIDENCE; IT WAS EXPONENTIAL GROWTH I SAW COMING, AND THESE 3 ARE THE ONES I RECOMMENDED THE MOST 🚀
AND BY 2026, THEY COULD PERFORM EVEN BETTER 🔥✍
First off, it was clearly $ZEC . When it was in the $340 - $300 range, I was telling everyone that the accumulation happening was out of the ordinary; more and more capital was flowing in, helping it break away from the dominance of #BTC . Moreover, technically, things were looking even better, showing us a rebound that left even me stunned, which was at $181. From there, #zec was quietly accumulating more and more, and right in the $280 - $320 range, I advised everyone to trade ZEC because it was looking spectacular. If you ask me where I think it could go, it's probably above $800 - $900, but first, we need to see how it behaves around $600.
CLICK HERE TO TRADE IT 👇👇👇👇👇
The other coin is a beauty; I told more than one person to buy it on spot, which was $JST . This coin has a feature on the network that simply makes it magnificent: it burns tokens to prevent inflation. Since it was at $0.036, I recommended buying it on spot, and just look at how it's doing 😍
CLICK HERE TO TRADE IT 👇👇👇👇
And finally, the promise for 2026 ✍ is $KITE . I've been recommending this coin for a long time since it got listed (which I never do), but the reason I recommended it was simple: the surge of #IA 🔥.
Since it was at $0.0105, I was recommending people buy it, and just look at it now 😡
IT WASN'T A COINCIDENCE; IT WAS EXPONENTIAL GROWTH I SAW COMING, AND THESE 3 ARE THE ONES I RECOMMENDED THE MOST 🚀
AND BY 2026, THEY COULD PERFORM EVEN BETTER 🔥✍
First off, it was clearly $ZEC . When it was in the $340 - $300 range, I was telling everyone that the accumulation happening was out of the ordinary; more and more capital was flowing in, helping it break away from the dominance of #BTC . Moreover, technically, things were looking even better, showing us a rebound that left even me stunned, which was at $181. From there, #zec was quietly accumulating more and more, and right in the $280 - $320 range, I advised everyone to trade ZEC because it was looking spectacular. If you ask me where I think it could go, it's probably above $800 - $900, but first, we need to see how it behaves around $600.
CLICK HERE TO TRADE IT 👇👇👇👇👇
The other coin is a beauty; I told more than one person to buy it on spot, which was $JST . This coin has a feature on the network that simply makes it magnificent: it burns tokens to prevent inflation. Since it was at $0.036, I recommended buying it on spot, and just look at how it's doing 😍
CLICK HERE TO TRADE IT 👇👇👇👇
And finally, the promise for 2026 ✍ is $KITE . I've been recommending this coin for a long time since it got listed (which I never do), but the reason I recommended it was simple: the surge of #IA 🔥.
Since it was at $0.0105, I was recommending people buy it, and just look at it now 😡
Piombo :
me equivoqué , compré $JCT 🤦🏼♂️🤦🏼♂️🤦🏼♂️
1
3
940

See translation
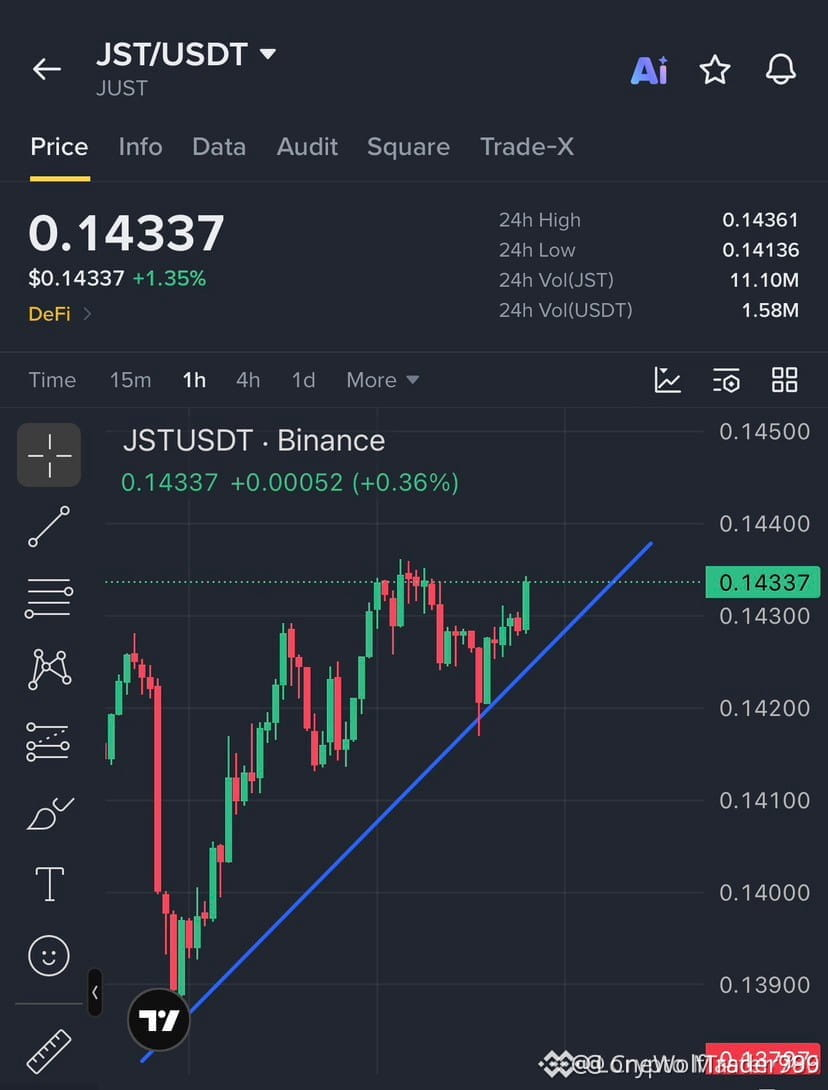
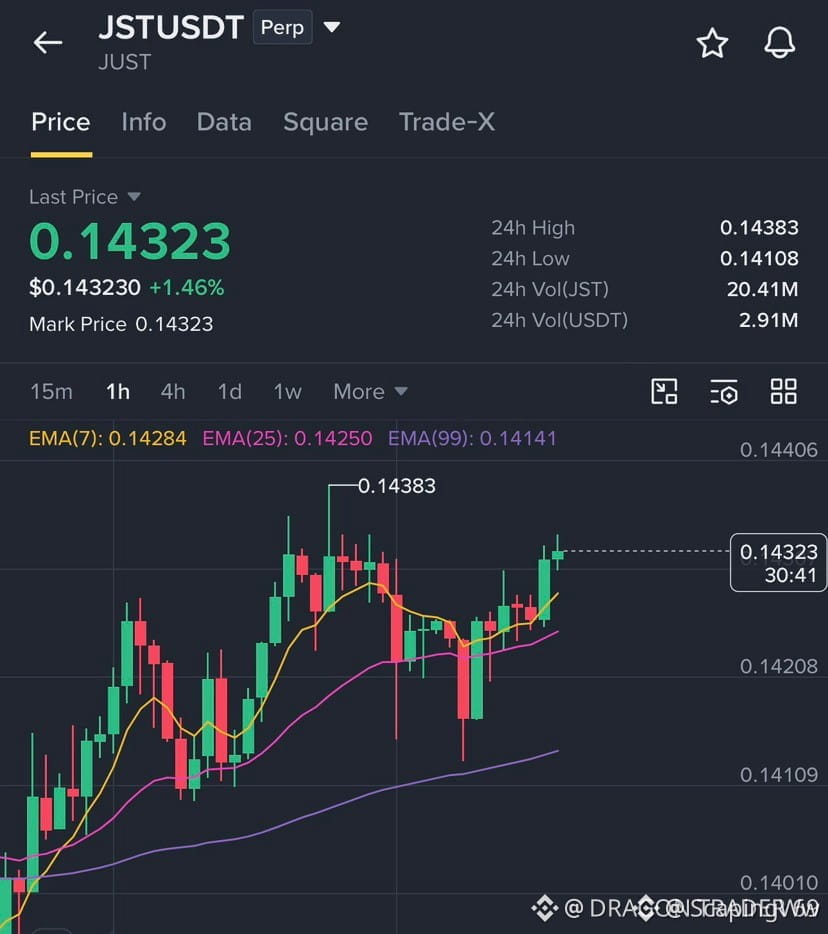
⚡ $JST BULLS DEFEND SUPPORT AS LIQUIDITY BUILDS FOR A CLEAN BREAKOUT! 🚀
Entry: $0.1430 – $0.1434 ⚡
Target: $0.1438, $0.1443, $0.1450 🚀
Stop Loss: $0.1418 ⚠️
Buyers are standing their ground like an immovable wall right above the $0.1420 liquidity zone, refusing to let sellers dictate terms. 🌊 That stubborn defense is pressing price right against the $0.1436 resistance ceiling, setting up a classic spring-loaded compression. 📊
When order flow consolidates this tightly beneath a key pivot, momentum traders usually step in fast to front-run the expansion. ⚡ Are you locking in entries here or waiting for confirmation above the high? 👇
⚠️ Not financial advice. Always manage your risk. 🛡️
🏷️ #JST #LongSetup #Crypto #Breakout
🔥 💎
⚡ $JST BULLS DEFEND SUPPORT AS LIQUIDITY BUILDS FOR A CLEAN BREAKOUT! 🚀
Entry: $0.1430 – $0.1434 ⚡
Target: $0.1438, $0.1443, $0.1450 🚀
Stop Loss: $0.1418 ⚠️
Buyers are standing their ground like an immovable wall right above the $0.1420 liquidity zone, refusing to let sellers dictate terms. 🌊 That stubborn defense is pressing price right against the $0.1436 resistance ceiling, setting up a classic spring-loaded compression. 📊
When order flow consolidates this tightly beneath a key pivot, momentum traders usually step in fast to front-run the expansion. ⚡ Are you locking in entries here or waiting for confirmation above the high? 👇
⚠️ Not financial advice. Always manage your risk. 🛡️
🏷️ #JST #LongSetup #Crypto #Breakout
🔥 💎
Entry: $0.1430 – $0.1434 ⚡
Target: $0.1438, $0.1443, $0.1450 🚀
Stop Loss: $0.1418 ⚠️
Buyers are standing their ground like an immovable wall right above the $0.1420 liquidity zone, refusing to let sellers dictate terms. 🌊 That stubborn defense is pressing price right against the $0.1436 resistance ceiling, setting up a classic spring-loaded compression. 📊
When order flow consolidates this tightly beneath a key pivot, momentum traders usually step in fast to front-run the expansion. ⚡ Are you locking in entries here or waiting for confirmation above the high? 👇
⚠️ Not financial advice. Always manage your risk. 🛡️
🏷️ #JST #LongSetup #Crypto #Breakout
🔥 💎

See translation
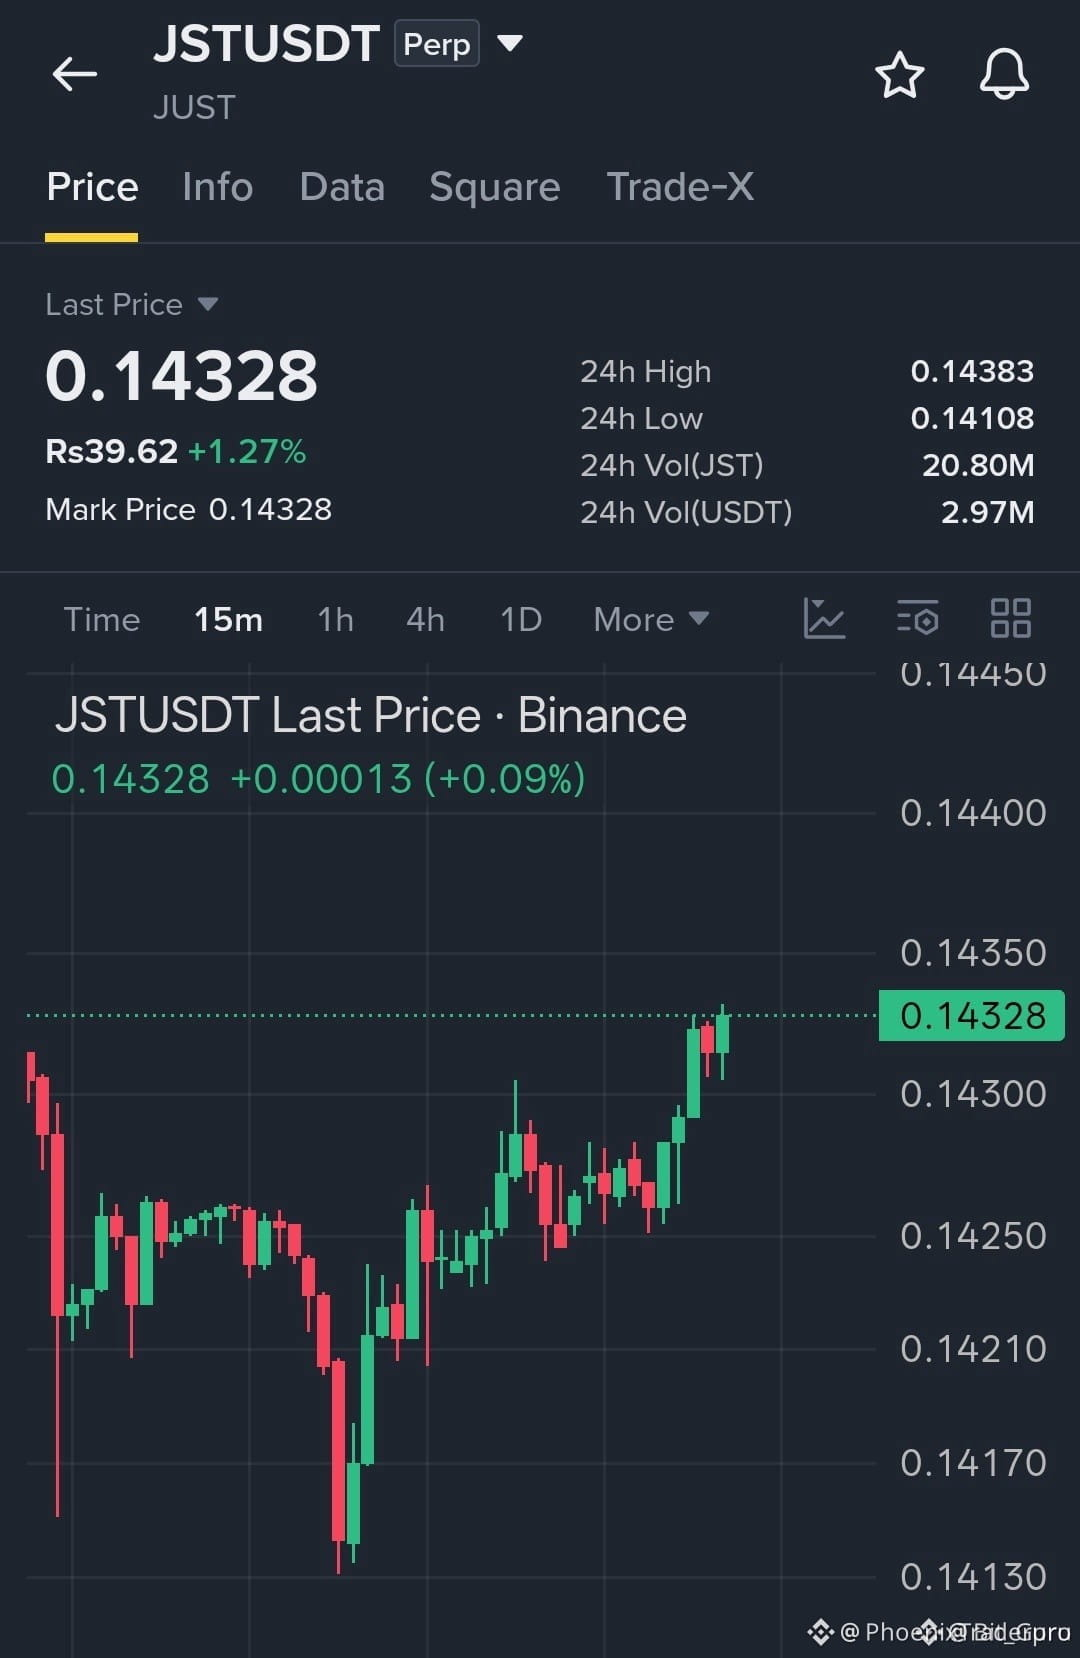
🚀 $JST BUILDS RELENTLESS MOMENTUM AS BUYERS TIGHTEN THE GRIP ON RESISTANCE! ⚡
Entry: 0.14300-0.14325 ⚡
Target: 0.14500 🚀
Stop Loss: 0.14250 ⚠️
The fifteen-minute chart is flashing clear signs of aggressive accumulation as bulls absorb every token offered near current levels. Price is coiling right below the primary pivot, setting the stage for a sharp volatility expansion once resistance yields. 📊
Momentum oscillators are curling upward cleanly, showing that buyers are refusing to let sellers dictate order flow. Managing risk tight against invalidation keeps the trade asymmetry heavily in our favor while this breakout attempt unfolds. ⚡
Are you locking in positions ahead of the breakout or waiting for confirmation above resistance? 👇
⚠️ Not financial advice. Always manage your risk. 🛡️
🏷️ #JST #LongSetup #Crypto #Breakout
🔥 💎
🚀 $JST BUILDS RELENTLESS MOMENTUM AS BUYERS TIGHTEN THE GRIP ON RESISTANCE! ⚡
Entry: 0.14300-0.14325 ⚡
Target: 0.14500 🚀
Stop Loss: 0.14250 ⚠️
The fifteen-minute chart is flashing clear signs of aggressive accumulation as bulls absorb every token offered near current levels. Price is coiling right below the primary pivot, setting the stage for a sharp volatility expansion once resistance yields. 📊
Momentum oscillators are curling upward cleanly, showing that buyers are refusing to let sellers dictate order flow. Managing risk tight against invalidation keeps the trade asymmetry heavily in our favor while this breakout attempt unfolds. ⚡
Are you locking in positions ahead of the breakout or waiting for confirmation above resistance? 👇
⚠️ Not financial advice. Always manage your risk. 🛡️
🏷️ #JST #LongSetup #Crypto #Breakout
🔥 💎
Entry: 0.14300-0.14325 ⚡
Target: 0.14500 🚀
Stop Loss: 0.14250 ⚠️
The fifteen-minute chart is flashing clear signs of aggressive accumulation as bulls absorb every token offered near current levels. Price is coiling right below the primary pivot, setting the stage for a sharp volatility expansion once resistance yields. 📊
Momentum oscillators are curling upward cleanly, showing that buyers are refusing to let sellers dictate order flow. Managing risk tight against invalidation keeps the trade asymmetry heavily in our favor while this breakout attempt unfolds. ⚡
Are you locking in positions ahead of the breakout or waiting for confirmation above resistance? 👇
⚠️ Not financial advice. Always manage your risk. 🛡️
🏷️ #JST #LongSetup #Crypto #Breakout
🔥 💎
1

·
--
See translation
⚡ BULLS DEFEND KEY DEMAND ON $JST WHILE SETTING UP FOR A CLEAN BREAKOUT! 🚀
Entry: $0.1425 – $0.1433 ⚡
Target: $0.1438 – $0.1450 🚀
Stop Loss: $0.1418 ⚠️
Sellers tried to crack the floor at $0.1420, but the bids absorbed every single drop like a sponge. This structural resilience shows buyers are quietly accumulating ahead of the $0.1436 resistance test. 📊
Once that overhead wall gives way, expect algorithmic momentum to kick into high gear toward the upper targets. Keep your eyes locked on volume expansion for confirmation. ⚡
💬 Are you front-running the breakout or waiting for a confirmed reclaim above resistance? 👇
⚠️ Not financial advice. Always manage your risk. 🛡️
🏷️ #JST #LongSetup #Breakout #Crypto
🔥 💎
⚡ BULLS DEFEND KEY DEMAND ON $JST WHILE SETTING UP FOR A CLEAN BREAKOUT! 🚀
Entry: $0.1425 – $0.1433 ⚡
Target: $0.1438 – $0.1450 🚀
Stop Loss: $0.1418 ⚠️
Sellers tried to crack the floor at $0.1420, but the bids absorbed every single drop like a sponge. This structural resilience shows buyers are quietly accumulating ahead of the $0.1436 resistance test. 📊
Once that overhead wall gives way, expect algorithmic momentum to kick into high gear toward the upper targets. Keep your eyes locked on volume expansion for confirmation. ⚡
💬 Are you front-running the breakout or waiting for a confirmed reclaim above resistance? 👇
⚠️ Not financial advice. Always manage your risk. 🛡️
🏷️ #JST #LongSetup #Breakout #Crypto
🔥 💎
Entry: $0.1425 – $0.1433 ⚡
Target: $0.1438 – $0.1450 🚀
Stop Loss: $0.1418 ⚠️
Sellers tried to crack the floor at $0.1420, but the bids absorbed every single drop like a sponge. This structural resilience shows buyers are quietly accumulating ahead of the $0.1436 resistance test. 📊
Once that overhead wall gives way, expect algorithmic momentum to kick into high gear toward the upper targets. Keep your eyes locked on volume expansion for confirmation. ⚡
💬 Are you front-running the breakout or waiting for a confirmed reclaim above resistance? 👇
⚠️ Not financial advice. Always manage your risk. 🛡️
🏷️ #JST #LongSetup #Breakout #Crypto
🔥 💎
3

·
--
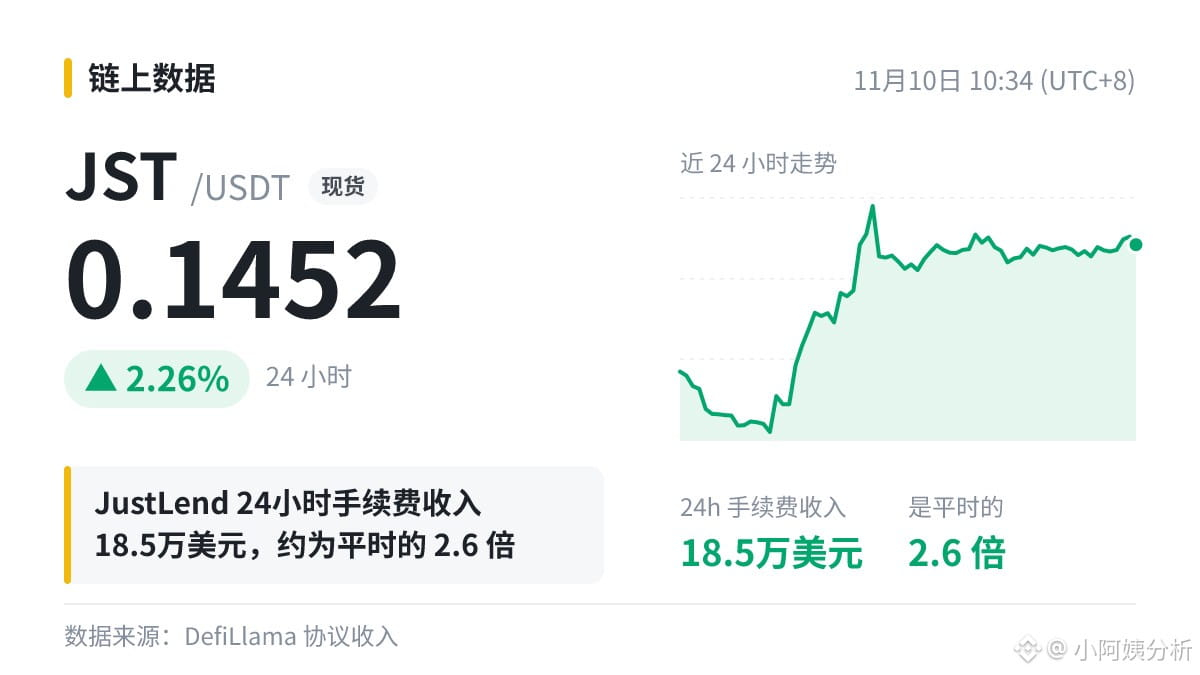
DeFi income alert: JustLend, associated with $JST , generated $185,000 in fee revenue over the past 24 hours—2.6 times its usual amount. The token is currently priced at 0.1452.
Stronger data and token price movements are not the same thing. A single data point doesn’t tell us much; it’s a sustained trend that deserves attention.
#JST
DeFi income alert: JustLend, associated with $JST , generated $185,000 in fee revenue over the past 24 hours—2.6 times its usual amount. The token is currently priced at 0.1452.
Stronger data and token price movements are not the same thing. A single data point doesn’t tell us much; it’s a sustained trend that deserves attention.
#JST
Stronger data and token price movements are not the same thing. A single data point doesn’t tell us much; it’s a sustained trend that deserves attention.
#JST
76
·
--
See translation
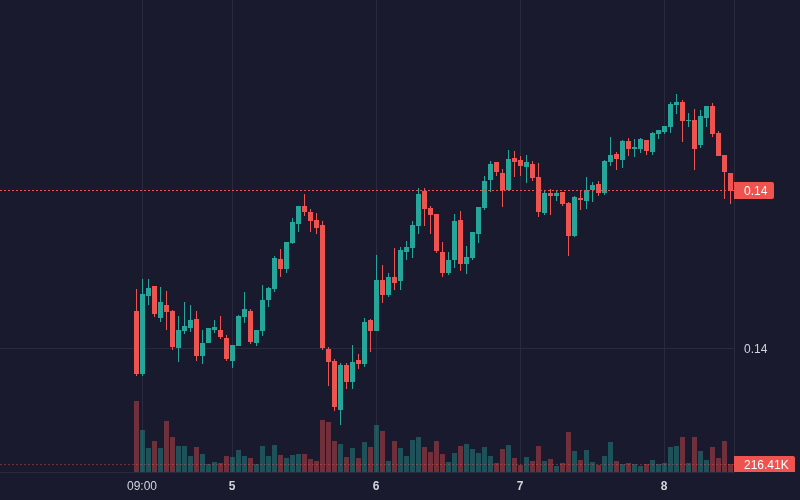
$JST JST is showing bearish movement: -0.15% (Crypto).
Volume: 1.50M | Last: $0.142800
Worth monitoring.
Bias Daily: BULLISH 🟢 | Weekly: BULLISH 🟢
JST rose 0.24% in 24h, retracing from $0.1444 highs as overbought technicals triggered late profit-taking.
**Tokenomics and buyback support (High)**: Fifth buyback-and-burn implementation featuring a $50M reserve floor bolstered supply reduction expectations.
- **Early capital inflows (Medium)**: Net inflows peaking above +$130K/h early in the session propelled prices from $0.1428 to a peak of $0.1444.
- **Governance consolidation (Low)**: Rebranding and restructuring JustLend DAO under JUST DAO clarified decision-making, improving community sentiment.
#JST #JobsReportRaisesHikeOdds #WillAnthropicListOnTime #CPITestsDecemberRateOutlook #Crypto
$JST JST is showing bearish movement: -0.15% (Crypto).
Volume: 1.50M | Last: $0.142800
Worth monitoring.
Bias Daily: BULLISH 🟢 | Weekly: BULLISH 🟢
JST rose 0.24% in 24h, retracing from $0.1444 highs as overbought technicals triggered late profit-taking.
**Tokenomics and buyback support (High)**: Fifth buyback-and-burn implementation featuring a $50M reserve floor bolstered supply reduction expectations.
- **Early capital inflows (Medium)**: Net inflows peaking above +$130K/h early in the session propelled prices from $0.1428 to a peak of $0.1444.
- **Governance consolidation (Low)**: Rebranding and restructuring JustLend DAO under JUST DAO clarified decision-making, improving community sentiment.
#JST #JobsReportRaisesHikeOdds #WillAnthropicListOnTime #CPITestsDecemberRateOutlook #Crypto
Volume: 1.50M | Last: $0.142800
Worth monitoring.
Bias Daily: BULLISH 🟢 | Weekly: BULLISH 🟢
JST rose 0.24% in 24h, retracing from $0.1444 highs as overbought technicals triggered late profit-taking.
**Tokenomics and buyback support (High)**: Fifth buyback-and-burn implementation featuring a $50M reserve floor bolstered supply reduction expectations.
- **Early capital inflows (Medium)**: Net inflows peaking above +$130K/h early in the session propelled prices from $0.1428 to a peak of $0.1444.
- **Governance consolidation (Low)**: Rebranding and restructuring JustLend DAO under JUST DAO clarified decision-making, improving community sentiment.
#JST #JobsReportRaisesHikeOdds #WillAnthropicListOnTime #CPITestsDecemberRateOutlook #Crypto
34

·
--
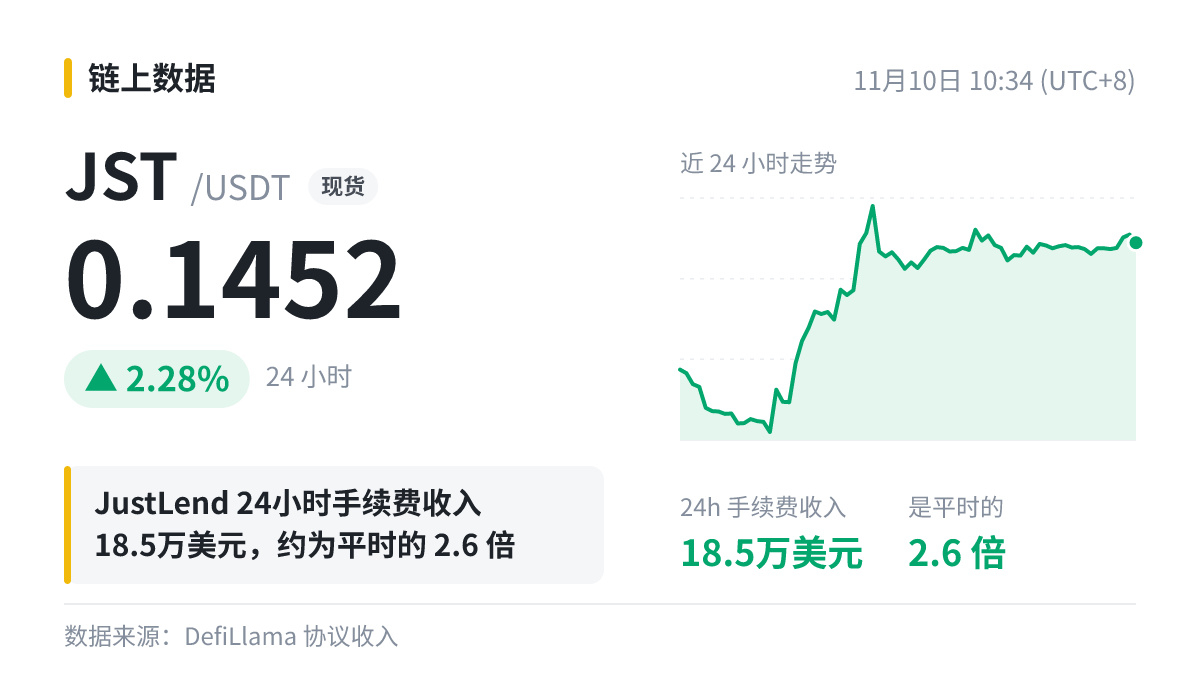
Sharing a little discovery with everyone: $JST JustLend (lending) has been very busy over the past day, with fee revenue reaching $185,000—2.6 times the usual amount.
When I first got into crypto, I only looked at whether prices were going up or down. Later, I picked up a habit: to see whether a protocol is actually being used, I first check whether it’s generating fees. This figure is impressive, but I’m more interested in whether it can stay at this level next week.
If you have a different take, let’s discuss it in the comments.
#JST
NFA—do your own research.
Sharing a little discovery with everyone: $JST JustLend (lending) has been very busy over the past day, with fee revenue reaching $185,000—2.6 times the usual amount.
When I first got into crypto, I only looked at whether prices were going up or down. Later, I picked up a habit: to see whether a protocol is actually being used, I first check whether it’s generating fees. This figure is impressive, but I’m more interested in whether it can stay at this level next week.
If you have a different take, let’s discuss it in the comments.
#JST
NFA—do your own research.
When I first got into crypto, I only looked at whether prices were going up or down. Later, I picked up a habit: to see whether a protocol is actually being used, I first check whether it’s generating fees. This figure is impressive, but I’m more interested in whether it can stay at this level next week.
If you have a different take, let’s discuss it in the comments.
#JST
NFA—do your own research.
44

·
--
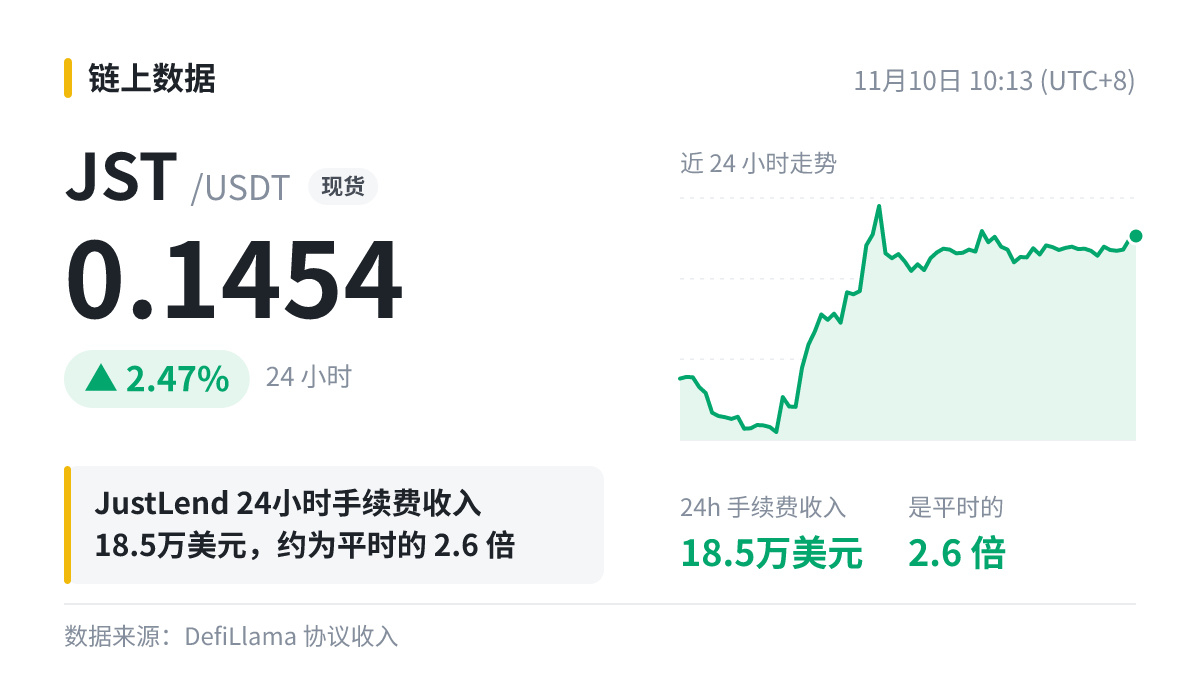
👀 $JST JustLend’s fee revenue for the day was $185,000, roughly equivalent to the total for about 2.6 average days.
Such a large spike often means trading activity surged over a short period. It could be driven by increased trading amid market volatility, or by a single large investor or one-off event. From a capital perspective, I’m more interested in whether these users stick around. Token: +2.47% over 24h.
A single signal can’t represent the market’s overall direction; what matters is whether it persists.
#JST
👀 $JST JustLend’s fee revenue for the day was $185,000, roughly equivalent to the total for about 2.6 average days.
Such a large spike often means trading activity surged over a short period. It could be driven by increased trading amid market volatility, or by a single large investor or one-off event. From a capital perspective, I’m more interested in whether these users stick around. Token: +2.47% over 24h.
A single signal can’t represent the market’s overall direction; what matters is whether it persists.
#JST
Such a large spike often means trading activity surged over a short period. It could be driven by increased trading amid market volatility, or by a single large investor or one-off event. From a capital perspective, I’m more interested in whether these users stick around. Token: +2.47% over 24h.
A single signal can’t represent the market’s overall direction; what matters is whether it persists.
#JST
27

·
--
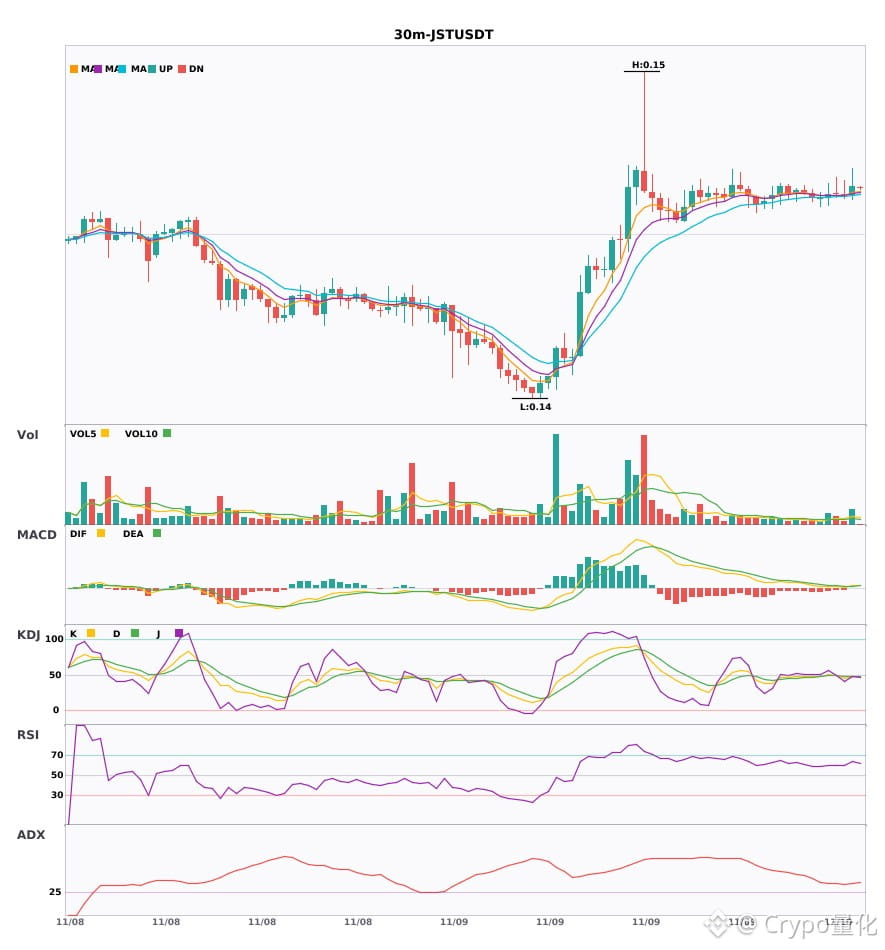
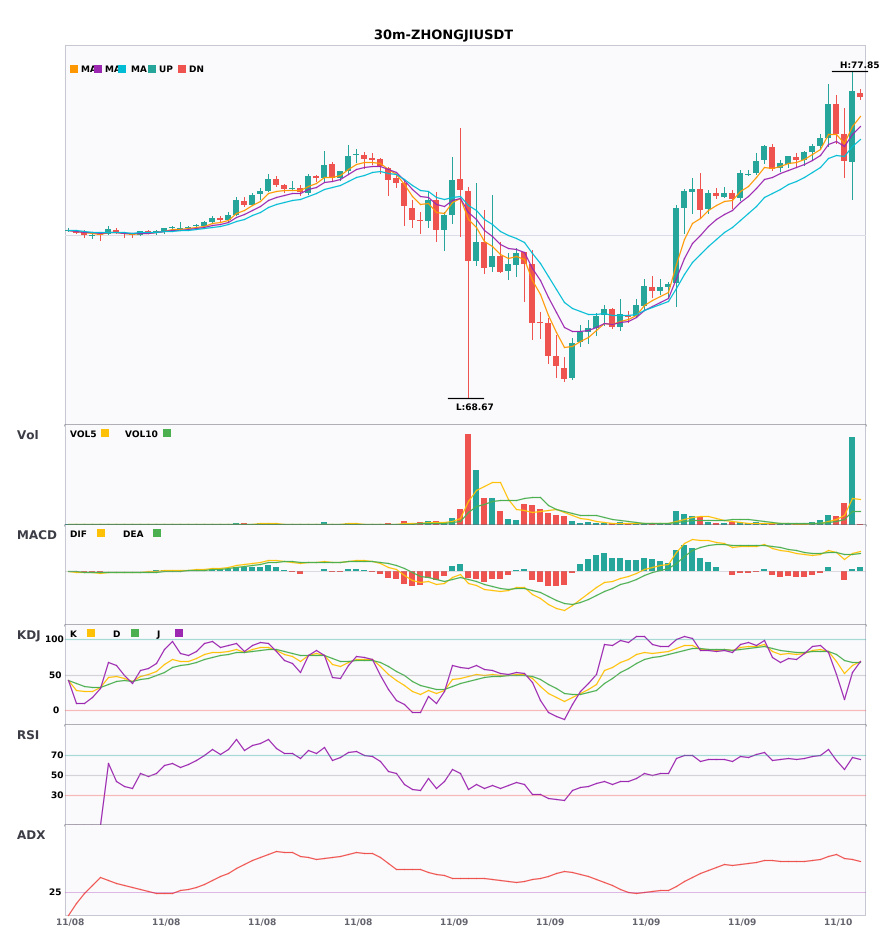
$JST / $ZHONGJI 3 30-minute confluence turns bullish; bullish signals are appearing simultaneously 🔥
════════════════════
🔴 $JST 30-minute bullish signal
⚠️Technical analysis: ADX (31) indicates a clear trending market | MACD bullish crossover above zero, bullish momentum released | EMA5 crosses above EMA8, short-term outlook turns bullish | KDJ is weak, with bears in control (K: 47.4, D: 47.5) | Trading volume expands (2.4x)
════════════════════
🔴 $ZHONGJI 3 30-minute bullish signal
⚠️Technical analysis: ADX (62) indicates a very strong trend (watch for an overheated pullback) | MACD bullish crossover above zero, bullish momentum released | EMA5 > EMA8 > EMA13, bullish alignment | KDJ is strong, with bulls in control (K: 62.6, D: 67.4) | Trading volume surges (6.4x)
════════════════════
🔔 Follow for first-hand market alerts 🔔
#技术分析 #JST #ZHONGJI
📌 When trading, pay attention to whether the candlestick pattern confirms the signal
$JST / $ZHONGJI 3 30-minute confluence turns bullish; bullish signals are appearing simultaneously 🔥
════════════════════
🔴 $JST 30-minute bullish signal
⚠️Technical analysis: ADX (31) indicates a clear trending market | MACD bullish crossover above zero, bullish momentum released | EMA5 crosses above EMA8, short-term outlook turns bullish | KDJ is weak, with bears in control (K: 47.4, D: 47.5) | Trading volume expands (2.4x)
════════════════════
🔴 $ZHONGJI 3 30-minute bullish signal
⚠️Technical analysis: ADX (62) indicates a very strong trend (watch for an overheated pullback) | MACD bullish crossover above zero, bullish momentum released | EMA5 > EMA8 > EMA13, bullish alignment | KDJ is strong, with bulls in control (K: 62.6, D: 67.4) | Trading volume surges (6.4x)
════════════════════
🔔 Follow for first-hand market alerts 🔔
#技术分析 #JST #ZHONGJI
📌 When trading, pay attention to whether the candlestick pattern confirms the signal
════════════════════
🔴 $JST 30-minute bullish signal
⚠️Technical analysis: ADX (31) indicates a clear trending market | MACD bullish crossover above zero, bullish momentum released | EMA5 crosses above EMA8, short-term outlook turns bullish | KDJ is weak, with bears in control (K: 47.4, D: 47.5) | Trading volume expands (2.4x)
════════════════════
🔴 $ZHONGJI 3 30-minute bullish signal
⚠️Technical analysis: ADX (62) indicates a very strong trend (watch for an overheated pullback) | MACD bullish crossover above zero, bullish momentum released | EMA5 > EMA8 > EMA13, bullish alignment | KDJ is strong, with bulls in control (K: 62.6, D: 67.4) | Trading volume surges (6.4x)
════════════════════
🔔 Follow for first-hand market alerts 🔔
#技术分析 #JST #ZHONGJI
📌 When trading, pay attention to whether the candlestick pattern confirms the signal
9

·
--
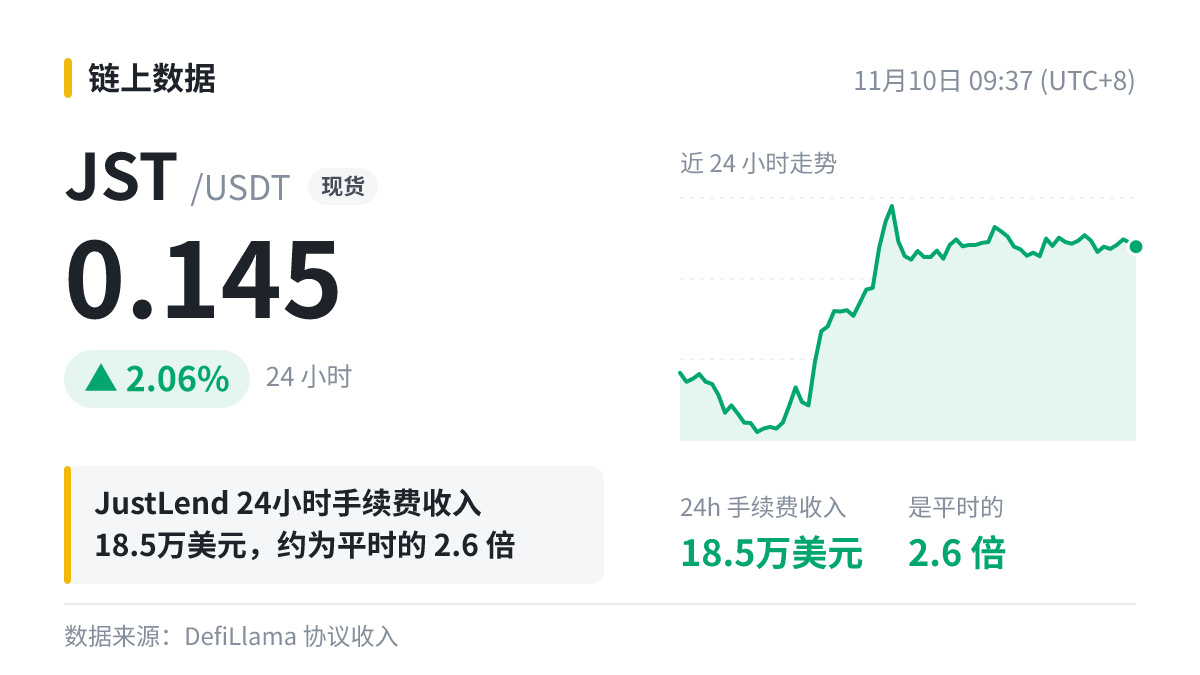
$JST JustLend (lending) fee revenue has risen from its usual daily average of $72,000 to 2.6 times that amount, reaching $185,000 on the latest day.
When I look at this kind of data, I usually ask three questions:
1) Who is paying the fees—is it increased transaction volume or liquidations?
2) How long can this be sustained?
3) Is there a mechanism for the revenue to flow to JST holders?
Until these three questions are clear, don’t treat the revenue as a reason to jump in.
#JST
$JST JustLend (lending) fee revenue has risen from its usual daily average of $72,000 to 2.6 times that amount, reaching $185,000 on the latest day.
When I look at this kind of data, I usually ask three questions:
1) Who is paying the fees—is it increased transaction volume or liquidations?
2) How long can this be sustained?
3) Is there a mechanism for the revenue to flow to JST holders?
Until these three questions are clear, don’t treat the revenue as a reason to jump in.
#JST
When I look at this kind of data, I usually ask three questions:
1) Who is paying the fees—is it increased transaction volume or liquidations?
2) How long can this be sustained?
3) Is there a mechanism for the revenue to flow to JST holders?
Until these three questions are clear, don’t treat the revenue as a reason to jump in.
#JST
25

·
--
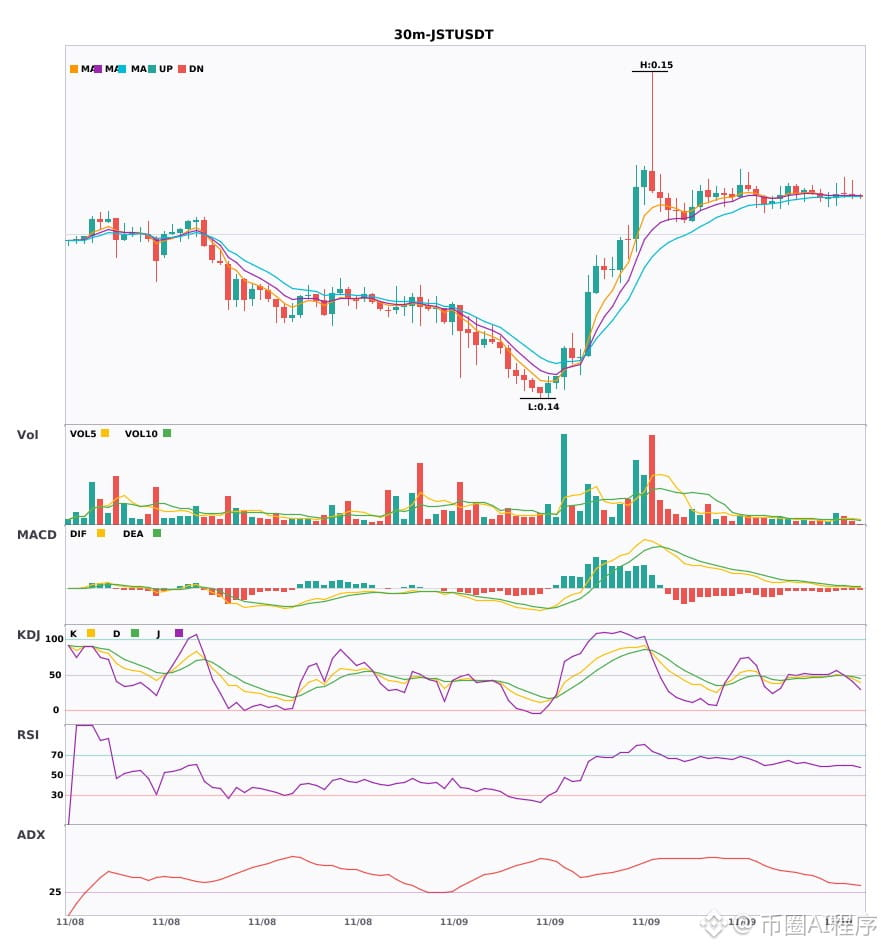
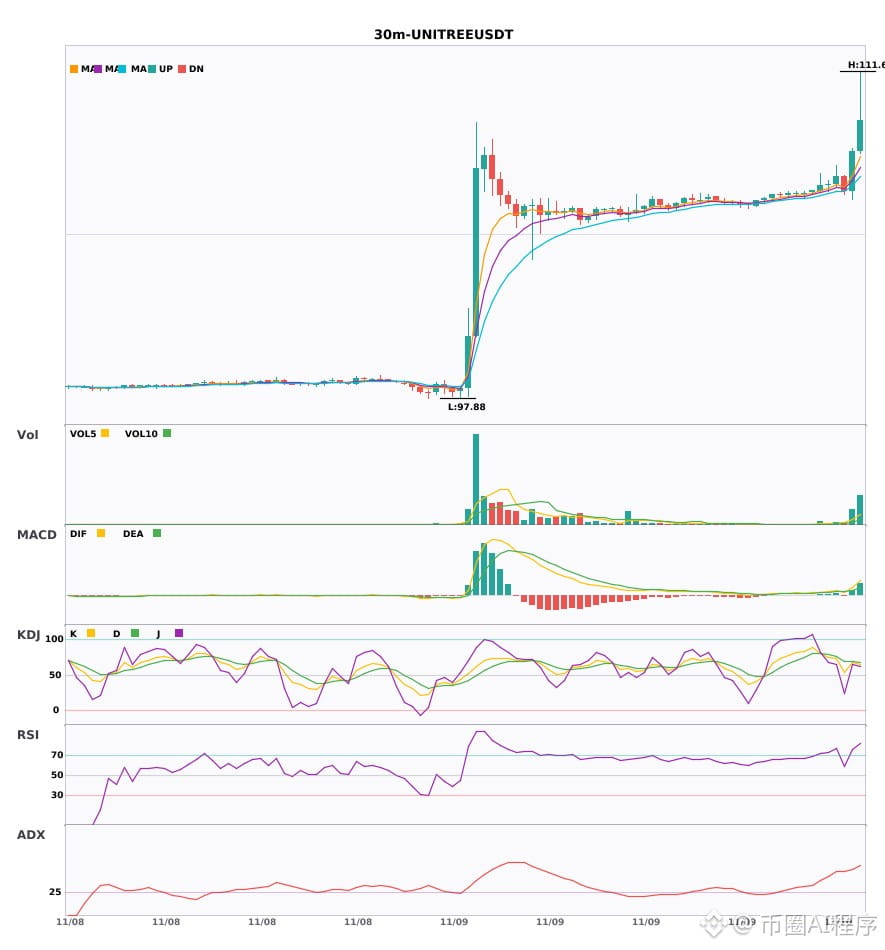
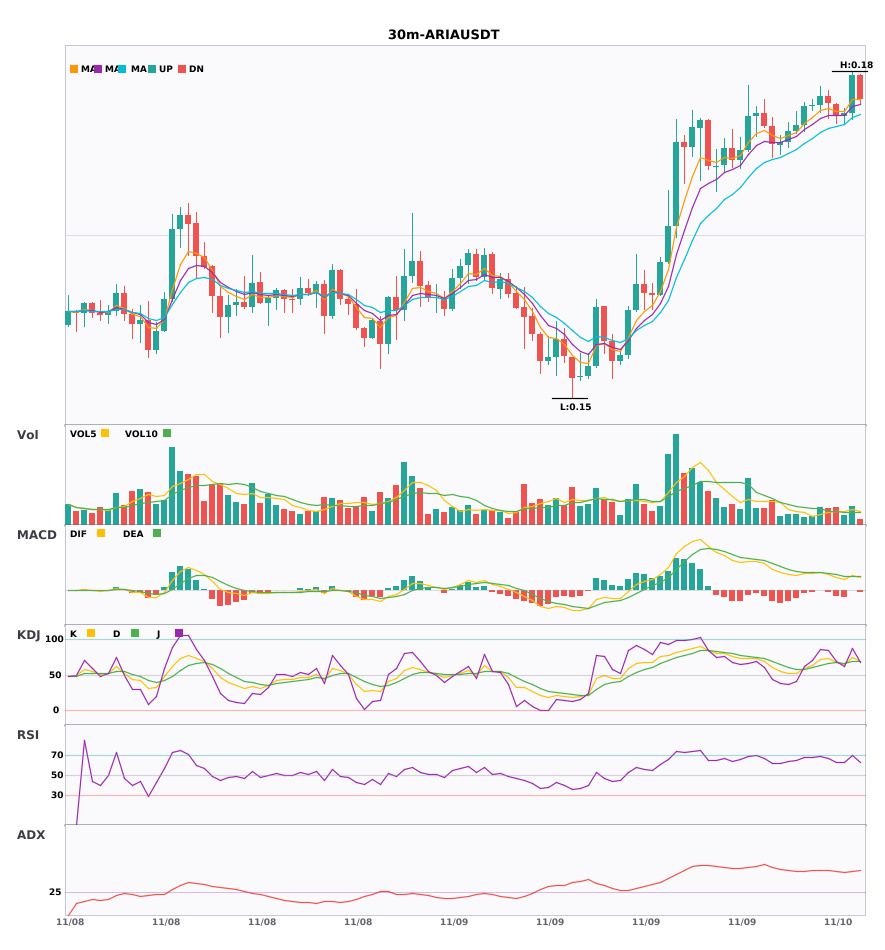
Multi-timeframe confluence: $JST / $UNITREE / $ARIA strengthen on the 30-minute timeframe; 4-hour bullish trend confirmed 🔥
════════════════════
🔴 $JST 30-minute bullish signal
⚠️Technical analysis: 4-hour bullish confluence confirmed | 30-minute entry: EMA5 crosses above EMA8, short-term bias turns bullish | KDJ death cross, short-term bearish (K: 48.7, D: 48.7) | Volume increase (2.1x)
════════════════════
🔴 $UNITREE 30-minute bullish signal
⚠️Technical analysis: 4-hour bullish confluence confirmed | 30-minute entry: MACD golden cross above zero, bullish momentum released | EMA5 > EMA8 > EMA13, bullish alignment | KDJ moving strongly, bulls have the upper hand (K: 67.2, D: 68.3) | Volume surge (5.5x)
════════════════════
🔴 $ARIA 30-minute bullish signal
⚠️Technical analysis: 4-hour bullish confluence confirmed | 30-minute entry: MACD golden cross above zero, bullish momentum released | EMA5 > EMA8 > EMA13, bullish alignment | KDJ golden cross, short-term bullish (K: 74.9, D: 69.2) | Volume increase (1.5x)
════════════════════
🔔 Follow for first-hand market alerts 🔔
#多周期共振 #JST #UNITREE #ARIA
📌 When trading, pay attention to whether the candlestick pattern is aligned
Multi-timeframe confluence: $JST / $UNITREE / $ARIA strengthen on the 30-minute timeframe; 4-hour bullish trend confirmed 🔥
════════════════════
🔴 $JST 30-minute bullish signal
⚠️Technical analysis: 4-hour bullish confluence confirmed | 30-minute entry: EMA5 crosses above EMA8, short-term bias turns bullish | KDJ death cross, short-term bearish (K: 48.7, D: 48.7) | Volume increase (2.1x)
════════════════════
🔴 $UNITREE 30-minute bullish signal
⚠️Technical analysis: 4-hour bullish confluence confirmed | 30-minute entry: MACD golden cross above zero, bullish momentum released | EMA5 > EMA8 > EMA13, bullish alignment | KDJ moving strongly, bulls have the upper hand (K: 67.2, D: 68.3) | Volume surge (5.5x)
════════════════════
🔴 $ARIA 30-minute bullish signal
⚠️Technical analysis: 4-hour bullish confluence confirmed | 30-minute entry: MACD golden cross above zero, bullish momentum released | EMA5 > EMA8 > EMA13, bullish alignment | KDJ golden cross, short-term bullish (K: 74.9, D: 69.2) | Volume increase (1.5x)
════════════════════
🔔 Follow for first-hand market alerts 🔔
#多周期共振 #JST #UNITREE #ARIA
📌 When trading, pay attention to whether the candlestick pattern is aligned
════════════════════
🔴 $JST 30-minute bullish signal
⚠️Technical analysis: 4-hour bullish confluence confirmed | 30-minute entry: EMA5 crosses above EMA8, short-term bias turns bullish | KDJ death cross, short-term bearish (K: 48.7, D: 48.7) | Volume increase (2.1x)
════════════════════
🔴 $UNITREE 30-minute bullish signal
⚠️Technical analysis: 4-hour bullish confluence confirmed | 30-minute entry: MACD golden cross above zero, bullish momentum released | EMA5 > EMA8 > EMA13, bullish alignment | KDJ moving strongly, bulls have the upper hand (K: 67.2, D: 68.3) | Volume surge (5.5x)
════════════════════
🔴 $ARIA 30-minute bullish signal
⚠️Technical analysis: 4-hour bullish confluence confirmed | 30-minute entry: MACD golden cross above zero, bullish momentum released | EMA5 > EMA8 > EMA13, bullish alignment | KDJ golden cross, short-term bullish (K: 74.9, D: 69.2) | Volume increase (1.5x)
════════════════════
🔔 Follow for first-hand market alerts 🔔
#多周期共振 #JST #UNITREE #ARIA
📌 When trading, pay attention to whether the candlestick pattern is aligned
35

·
--
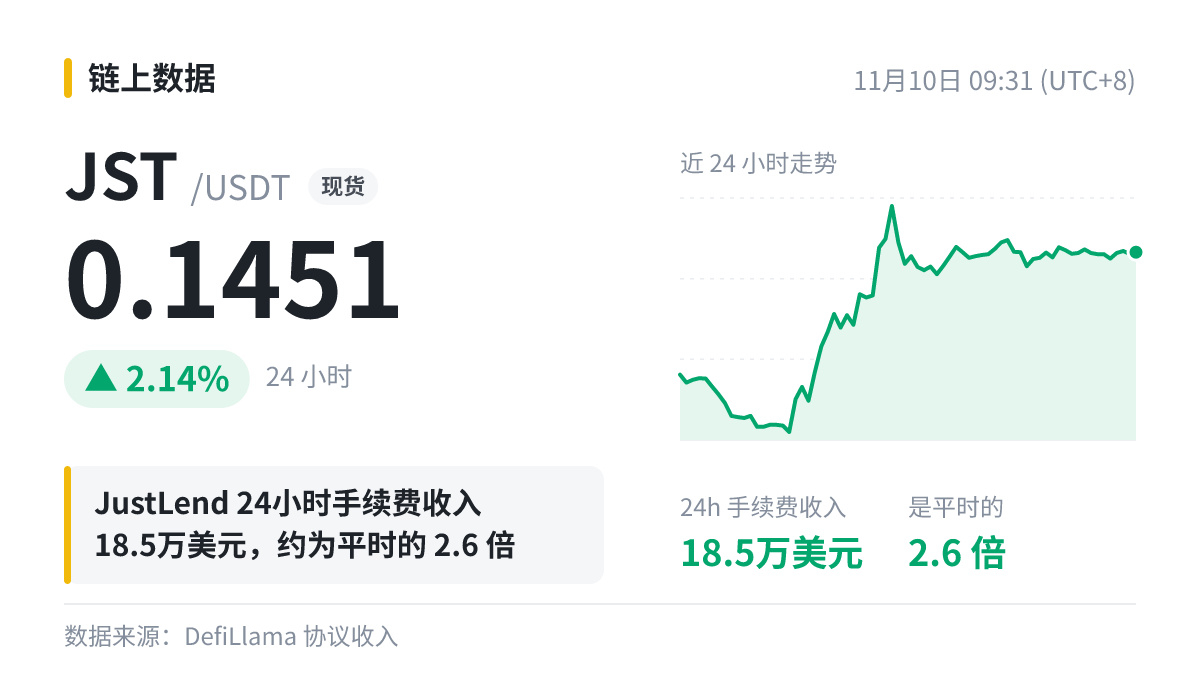
Data Snapshot | JustLend ($JST )
$72,000/day → $185,000/24h, fee revenue approximately ×2.6.
Note: This is fee revenue, including the portion distributed to LPs. It reflects overall usage; the protocol itself receives less.
This type of data generally tracks usage and can serve as a first-hand reference for adoption.
#JST
Data Snapshot | JustLend ($JST )
$72,000/day → $185,000/24h, fee revenue approximately ×2.6.
Note: This is fee revenue, including the portion distributed to LPs. It reflects overall usage; the protocol itself receives less.
This type of data generally tracks usage and can serve as a first-hand reference for adoption.
#JST
$72,000/day → $185,000/24h, fee revenue approximately ×2.6.
Note: This is fee revenue, including the portion distributed to LPs. It reflects overall usage; the protocol itself receives less.
This type of data generally tracks usage and can serve as a first-hand reference for adoption.
#JST
67
Log in to explore more content
Join global crypto users on Binance Square
⚡️ Get latest and useful information about crypto.
💬 Trusted by the world’s largest crypto exchange.
👍 Discover real insights from verified creators.
Email / Phone number
Trending Topics
1
#CPITestsDecemberRateOutlook
714,847 views
3,306 Discussing
2
#NvidiaInvestigatesAfterHuang’sAffairApology
271,352 views
2,120 Discussing
3
#AnthropicRejectsIPODelayValuationinQuestion
68,910 views
633 Discussing
4
#US-IranTalksFuelStrongStockMarketRebound
12,959 views
172 Discussing
5
#BitcoinFiveWeeklyLosses
296,742 views
2,473 Discussing
6
#AIChipSlumpNasdaq
167,023 views
1,504 Discussing
7
#BitcoinSpotETFsPost$201MNetOutflowForThirdStraightDay
0 views
0 Discussing
8
#CryptoLiquidationsReach$1.16BIn24Hours
27,277 views
61 Discussing
9
#StrategyBuys1037BTCLastWeek
6,715 views
79 Discussing
10
#NYSEToUseAvalancheToSettleTokenizedStocks
5,544 views
51 Discussing