
#glmr
glmr
623,498 views
3,810 Discussing
Hot
Latest

·
--
Bullish
See translation
🤣🚀 Can $GLMR
{spot}(GLMRUSDT)
ever revisit $50? Its past highs keep the dream alive, but the road back won't be easy. Market volatility, selling pressure, stronger demand, and ecosystem growth will all play a role. Bulls need real momentum, not just hype! Is $50 a realistic comeback target or pure imagination? What's your prediction? 👀
#GLMR #Crypto #BinanceSquare
🤣🚀 Can $GLMR
ever revisit $50? Its past highs keep the dream alive, but the road back won't be easy. Market volatility, selling pressure, stronger demand, and ecosystem growth will all play a role. Bulls need real momentum, not just hype! Is $50 a realistic comeback target or pure imagination? What's your prediction? 👀
#GLMR #Crypto #BinanceSquare
ever revisit $50? Its past highs keep the dream alive, but the road back won't be easy. Market volatility, selling pressure, stronger demand, and ecosystem growth will all play a role. Bulls need real momentum, not just hype! Is $50 a realistic comeback target or pure imagination? What's your prediction? 👀
#GLMR #Crypto #BinanceSquare
_Shizuka_:
Great my sweet friend
1
3
481

·
--
See translation
$GLMR +9.85% | $BANANAS31 +8.65% | $ZRO +8.61%
#GLMR jumped to $0.00727300, up +9.85% on $3.1 M of volume. Moonbeam’s positioning as a specialized Layer 1 that mirrors Ethereum’s Web3 RPC could give it extra appeal as developers look for tighter EVM compatibility.
#BANANAS31 rose to $0.00519000, gaining +8.65% with $1.1 M traded. The modest turnover suggests the rally is still early and may need broader interest to sustain momentum.
#ZRO climbed to $1.51, up +8.61% on a strong $8.3 M of volume. That level of activity hints at solid buying pressure behind the token’s recent surge.
The spread in volume between ZRO and the other two may indicate where short‑term capital is concentrating.
#Write2Earn #Binance
$GLMR +9.85% | $BANANAS31 +8.65% | $ZRO +8.61%
#GLMR jumped to $0.00727300, up +9.85% on $3.1 M of volume. Moonbeam’s positioning as a specialized Layer 1 that mirrors Ethereum’s Web3 RPC could give it extra appeal as developers look for tighter EVM compatibility.
#BANANAS31 rose to $0.00519000, gaining +8.65% with $1.1 M traded. The modest turnover suggests the rally is still early and may need broader interest to sustain momentum.
#ZRO climbed to $1.51, up +8.61% on a strong $8.3 M of volume. That level of activity hints at solid buying pressure behind the token’s recent surge.
The spread in volume between ZRO and the other two may indicate where short‑term capital is concentrating.
#Write2Earn #Binance
#GLMR jumped to $0.00727300, up +9.85% on $3.1 M of volume. Moonbeam’s positioning as a specialized Layer 1 that mirrors Ethereum’s Web3 RPC could give it extra appeal as developers look for tighter EVM compatibility.
#BANANAS31 rose to $0.00519000, gaining +8.65% with $1.1 M traded. The modest turnover suggests the rally is still early and may need broader interest to sustain momentum.
#ZRO climbed to $1.51, up +8.61% on a strong $8.3 M of volume. That level of activity hints at solid buying pressure behind the token’s recent surge.
The spread in volume between ZRO and the other two may indicate where short‑term capital is concentrating.
#Write2Earn #Binance
5

·
--
See translation
Glide Ahead: $GLMR Gains Traction in Asian Session 🚀
Price action: $GLMR held steady at $0.007346 on Binance Spot, up 14.10% over the past 24 hours. Volume surged to $3.1 M, indicating fresh buying interest despite a neutral sentiment backdrop.
Key levels: Immediate support sits around $0.0068, a zone that has previously absorbed sell pressure. The next resistance is near $0.0080, a round‑number barrier that could trigger a breakout if momentum persists. Mid‑range bias rests at $0.0075, acting as a pivot for short‑term swings.
Outlook: With the bullish continuation angle, the recent price climb suggests momentum is still building. Minor retracements toward the $0.0068 support appear attractive for incremental entries, while the $0.0080 ceiling offers a clear target for a continued uptrend. Traders should watch for volume‑driven spikes that could push the pair past resistance, confirming the bullish narrative.
#Crypto #Altcoins #GLMR
Glide Ahead: $GLMR Gains Traction in Asian Session 🚀
Price action: $GLMR held steady at $0.007346 on Binance Spot, up 14.10% over the past 24 hours. Volume surged to $3.1 M, indicating fresh buying interest despite a neutral sentiment backdrop.
Key levels: Immediate support sits around $0.0068, a zone that has previously absorbed sell pressure. The next resistance is near $0.0080, a round‑number barrier that could trigger a breakout if momentum persists. Mid‑range bias rests at $0.0075, acting as a pivot for short‑term swings.
Outlook: With the bullish continuation angle, the recent price climb suggests momentum is still building. Minor retracements toward the $0.0068 support appear attractive for incremental entries, while the $0.0080 ceiling offers a clear target for a continued uptrend. Traders should watch for volume‑driven spikes that could push the pair past resistance, confirming the bullish narrative.
#Crypto #Altcoins #GLMR
Price action: $GLMR held steady at $0.007346 on Binance Spot, up 14.10% over the past 24 hours. Volume surged to $3.1 M, indicating fresh buying interest despite a neutral sentiment backdrop.
Key levels: Immediate support sits around $0.0068, a zone that has previously absorbed sell pressure. The next resistance is near $0.0080, a round‑number barrier that could trigger a breakout if momentum persists. Mid‑range bias rests at $0.0075, acting as a pivot for short‑term swings.
Outlook: With the bullish continuation angle, the recent price climb suggests momentum is still building. Minor retracements toward the $0.0068 support appear attractive for incremental entries, while the $0.0080 ceiling offers a clear target for a continued uptrend. Traders should watch for volume‑driven spikes that could push the pair past resistance, confirming the bullish narrative.
#Crypto #Altcoins #GLMR
1
·
--
See translation
$GLMR +4.04% | $HEI +4.02% | $CAKE +3.94%
#GLMR nudges to $0.00692400, up +4.04% with $3.1 M changing hands. Its Layer 1 focus beyond a simple EVM bridge keeps it interesting for cross‑chain devs.
#HEI climbs to $0.0803, gaining +4.02% on $2.3 M volume. The modest trade flow suggests a steady, if not explosive, interest.
#CAKE rises to $1.64, up +3.94% with $2.3 M traded. The Binance‑linked token still benefits from its broad ecosystem exposure.
👀 Keep an eye on how GLMR’s volume compares to the others; a larger flow could precede a bigger move.
#Write2Earn #Binance
$GLMR +4.04% | $HEI +4.02% | $CAKE +3.94%
#GLMR nudges to $0.00692400, up +4.04% with $3.1 M changing hands. Its Layer 1 focus beyond a simple EVM bridge keeps it interesting for cross‑chain devs.
#HEI climbs to $0.0803, gaining +4.02% on $2.3 M volume. The modest trade flow suggests a steady, if not explosive, interest.
#CAKE rises to $1.64, up +3.94% with $2.3 M traded. The Binance‑linked token still benefits from its broad ecosystem exposure.
👀 Keep an eye on how GLMR’s volume compares to the others; a larger flow could precede a bigger move.
#Write2Earn #Binance
#GLMR nudges to $0.00692400, up +4.04% with $3.1 M changing hands. Its Layer 1 focus beyond a simple EVM bridge keeps it interesting for cross‑chain devs.
#HEI climbs to $0.0803, gaining +4.02% on $2.3 M volume. The modest trade flow suggests a steady, if not explosive, interest.
#CAKE rises to $1.64, up +3.94% with $2.3 M traded. The Binance‑linked token still benefits from its broad ecosystem exposure.
👀 Keep an eye on how GLMR’s volume compares to the others; a larger flow could precede a bigger move.
#Write2Earn #Binance
8

·
--
See translation
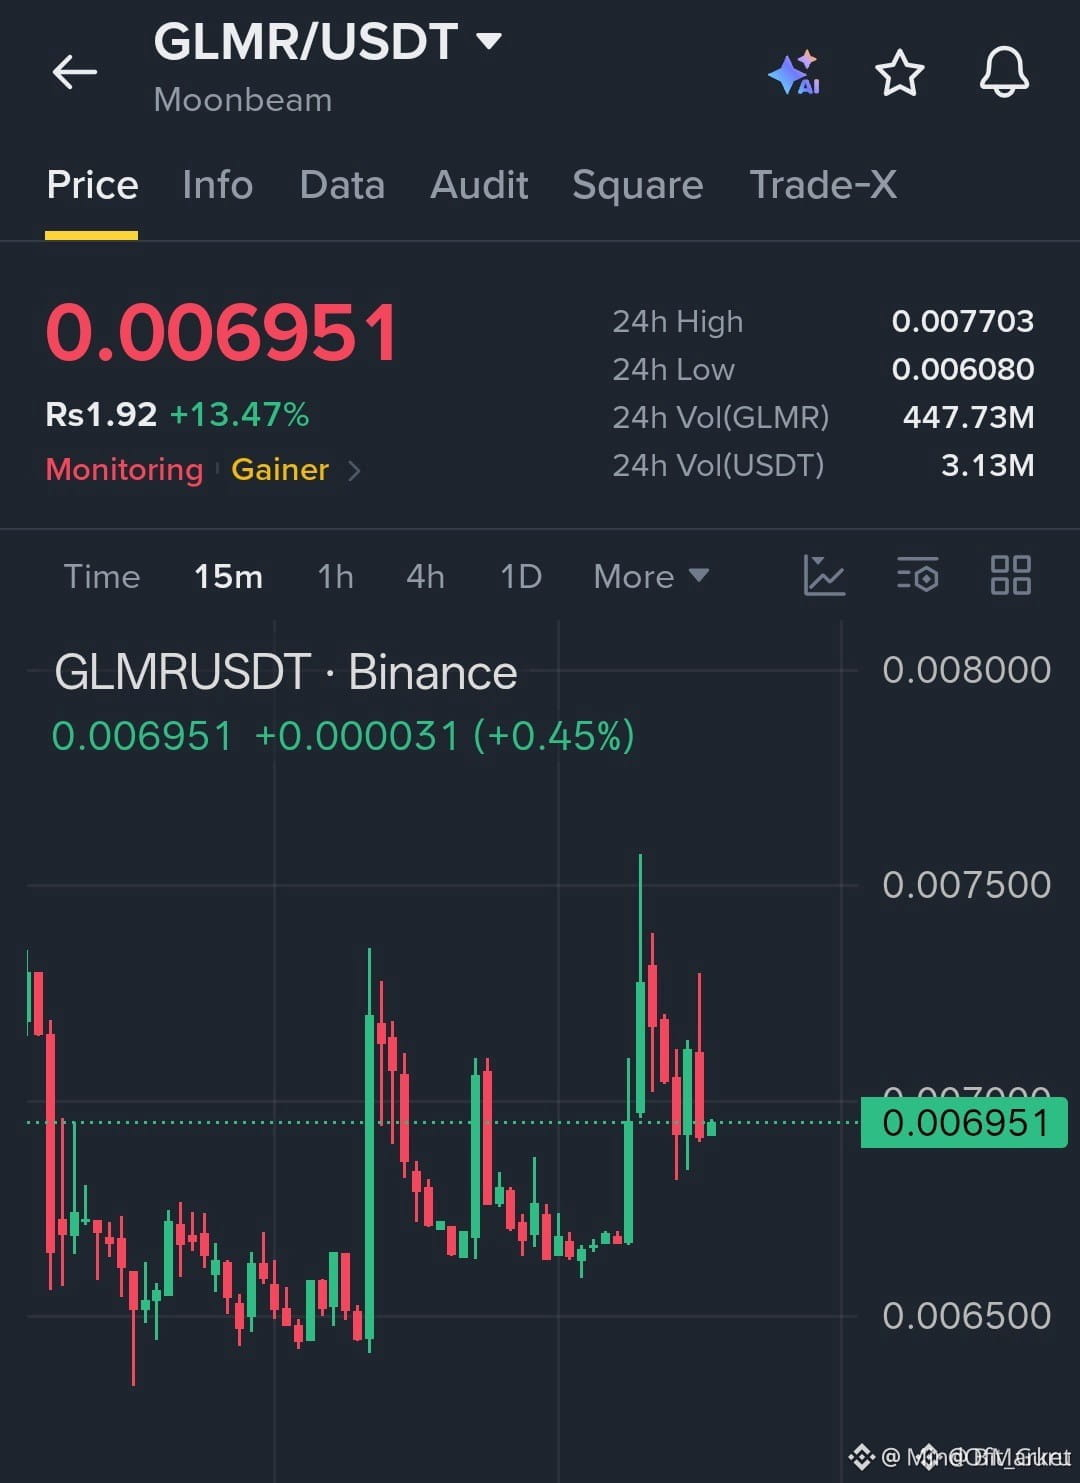
🚨 $GLMR BREAKING THROUGH ACCUMULATION RANGE WITH INSTITUTIONAL MOMENTUM 💥
Entry: 0.00685 – 0.00695 ⚡
Target: 0.00750 🚀
Stop Loss: 0.00665 ⚠️
Price action is slicing clean through the local equilibrium, clearing resting liquidity just above the range high. 📊 Order flow shows aggressive market buy clusters absorbing floating supply while inefficient fair value gaps are left unfilled below. ⚡
As long as structural support holds firm, the path toward higher resistance liquidity pools remains unobstructed. 🔍 Are you positioning inside this breakout range or waiting for a structural retest? 👇
⚠️ Not financial advice. Always manage your risk. 🛡️
🏷️ #GLMR #SmartMoney #Breakout #Crypto #OrderFlow
🦈 📈
🚨 $GLMR BREAKING THROUGH ACCUMULATION RANGE WITH INSTITUTIONAL MOMENTUM 💥
Entry: 0.00685 – 0.00695 ⚡
Target: 0.00750 🚀
Stop Loss: 0.00665 ⚠️
Price action is slicing clean through the local equilibrium, clearing resting liquidity just above the range high. 📊 Order flow shows aggressive market buy clusters absorbing floating supply while inefficient fair value gaps are left unfilled below. ⚡
As long as structural support holds firm, the path toward higher resistance liquidity pools remains unobstructed. 🔍 Are you positioning inside this breakout range or waiting for a structural retest? 👇
⚠️ Not financial advice. Always manage your risk. 🛡️
🏷️ #GLMR #SmartMoney #Breakout #Crypto #OrderFlow
🦈 📈
Entry: 0.00685 – 0.00695 ⚡
Target: 0.00750 🚀
Stop Loss: 0.00665 ⚠️
Price action is slicing clean through the local equilibrium, clearing resting liquidity just above the range high. 📊 Order flow shows aggressive market buy clusters absorbing floating supply while inefficient fair value gaps are left unfilled below. ⚡
As long as structural support holds firm, the path toward higher resistance liquidity pools remains unobstructed. 🔍 Are you positioning inside this breakout range or waiting for a structural retest? 👇
⚠️ Not financial advice. Always manage your risk. 🛡️
🏷️ #GLMR #SmartMoney #Breakout #Crypto #OrderFlow
🦈 📈
3

See translation
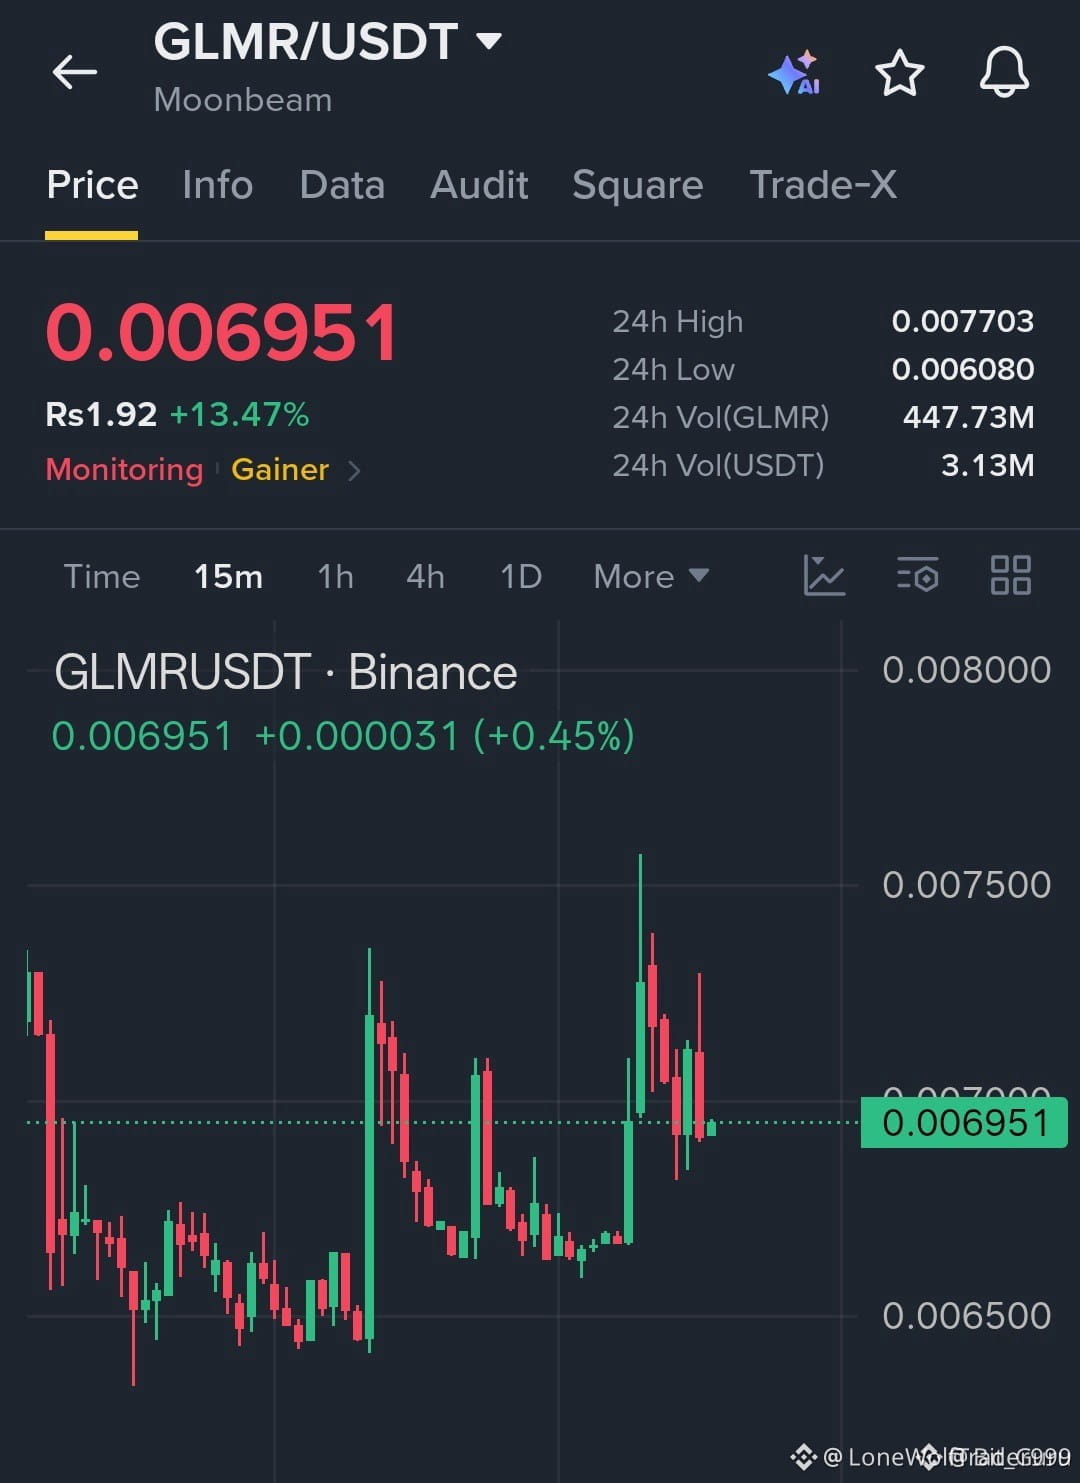
🚨 $GLMR VAPORIZING RESISTANCE AS BUYERS ACCUMULATE AT THE RANGE LOW! 💥
Entry: 0.00685 – 0.00695 ⚡
Target: 0.00750 🚀
Stop Loss: 0.00665 🛑
Sellers are losing their grip as order flow flips aggressive right above the local demand floor. 📊 Volume profiles show strong absorption in the current consolidation band, signaling that institutional accumulation is nearing completion. ⚡
The path of least resistance is pointing straight toward our upper objective as momentum indicators reset cleanly on lower timeframes. 💡 Are you scaling in at current bids or waiting for confirmation above the breakout structure? 👇
⚠️ Not financial advice. Always manage your risk. 🛡️
🏷️ #GLMR #LongSetup #Breakout #Crypto
🔥 💎
🚨 $GLMR VAPORIZING RESISTANCE AS BUYERS ACCUMULATE AT THE RANGE LOW! 💥
Entry: 0.00685 – 0.00695 ⚡
Target: 0.00750 🚀
Stop Loss: 0.00665 🛑
Sellers are losing their grip as order flow flips aggressive right above the local demand floor. 📊 Volume profiles show strong absorption in the current consolidation band, signaling that institutional accumulation is nearing completion. ⚡
The path of least resistance is pointing straight toward our upper objective as momentum indicators reset cleanly on lower timeframes. 💡 Are you scaling in at current bids or waiting for confirmation above the breakout structure? 👇
⚠️ Not financial advice. Always manage your risk. 🛡️
🏷️ #GLMR #LongSetup #Breakout #Crypto
🔥 💎
Entry: 0.00685 – 0.00695 ⚡
Target: 0.00750 🚀
Stop Loss: 0.00665 🛑
Sellers are losing their grip as order flow flips aggressive right above the local demand floor. 📊 Volume profiles show strong absorption in the current consolidation band, signaling that institutional accumulation is nearing completion. ⚡
The path of least resistance is pointing straight toward our upper objective as momentum indicators reset cleanly on lower timeframes. 💡 Are you scaling in at current bids or waiting for confirmation above the breakout structure? 👇
⚠️ Not financial advice. Always manage your risk. 🛡️
🏷️ #GLMR #LongSetup #Breakout #Crypto
🔥 💎
6

·
--
Bullish
See translation
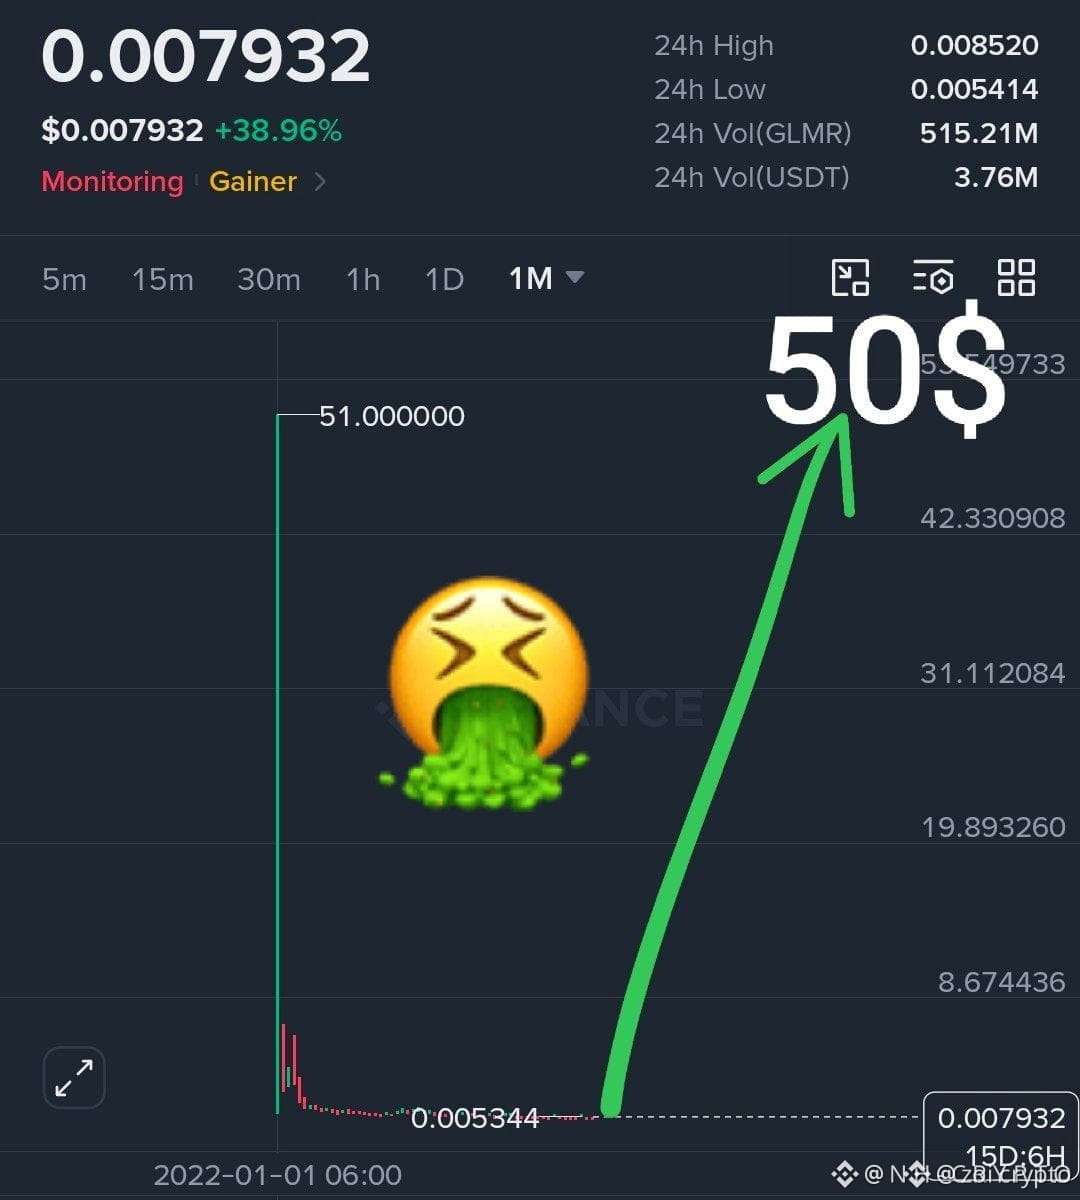
🚀 **$GLMR – BULLISH MOMENTUM IS BUILDING! CAN GLMR BREAK HIGHER?** 🔥
GLMR is showing impressive strength, currently trading at **$0.007932**, up approximately **38.96%** in the last 24 hours!
📊 **Key Market Levels:**
- Current Price: $0.007932
- Immediate Support: $0.007400
- Strong Support: $0.006500
- Resistance 1: $0.008520
- Breakout Target: $0.009500
📈 **What's Next?**
Buyers are showing strong interest, while rising trading volume suggests increasing market activity. A confirmed breakout above $0.008520 could open the door for another upward move.
🎯 **Potential LONG Setup:**
- Entry: $0.007600 – $0.007950
- TP1: $0.008200
- TP2: $0.008520
- TP3: $0.009500
- SL: $0.007200
⚠️ Avoid chasing the pump. Wait for confirmation and manage your risk carefully.
💎 Stay patient, follow the trend, and let smart trading decisions lead the way!
#GLMR #CryptoTrading #Binance
🚀 **$GLMR – BULLISH MOMENTUM IS BUILDING! CAN GLMR BREAK HIGHER?** 🔥
GLMR is showing impressive strength, currently trading at **$0.007932**, up approximately **38.96%** in the last 24 hours!
📊 **Key Market Levels:**
- Current Price: $0.007932
- Immediate Support: $0.007400
- Strong Support: $0.006500
- Resistance 1: $0.008520
- Breakout Target: $0.009500
📈 **What's Next?**
Buyers are showing strong interest, while rising trading volume suggests increasing market activity. A confirmed breakout above $0.008520 could open the door for another upward move.
🎯 **Potential LONG Setup:**
- Entry: $0.007600 – $0.007950
- TP1: $0.008200
- TP2: $0.008520
- TP3: $0.009500
- SL: $0.007200
⚠️ Avoid chasing the pump. Wait for confirmation and manage your risk carefully.
💎 Stay patient, follow the trend, and let smart trading decisions lead the way!
#GLMR #CryptoTrading #Binance
GLMR is showing impressive strength, currently trading at **$0.007932**, up approximately **38.96%** in the last 24 hours!
📊 **Key Market Levels:**
- Current Price: $0.007932
- Immediate Support: $0.007400
- Strong Support: $0.006500
- Resistance 1: $0.008520
- Breakout Target: $0.009500
📈 **What's Next?**
Buyers are showing strong interest, while rising trading volume suggests increasing market activity. A confirmed breakout above $0.008520 could open the door for another upward move.
🎯 **Potential LONG Setup:**
- Entry: $0.007600 – $0.007950
- TP1: $0.008200
- TP2: $0.008520
- TP3: $0.009500
- SL: $0.007200
⚠️ Avoid chasing the pump. Wait for confirmation and manage your risk carefully.
💎 Stay patient, follow the trend, and let smart trading decisions lead the way!
#GLMR #CryptoTrading #Binance
2
81
·
--
See translation
🚨 EXTERNAL SCRIPT COMPROMISE PRESSURES $HUMA AND $GLMR AS LIQUIDITY TESTS KEY SUPPORT 📉
Recent external script compromises across major web infrastructure have introduced short-term sentiment friction for assets like $HUMA , $GLMR , and $BLESS . 📊 Smart money is closely monitoring order book depth to determine if this friction triggers structural liquidations or merely a minor efficiency fill. ⚡
Market participants remain divided between anticipating a deeper liquidity hunt or a rapid technical recovery once patches absorb the vulnerability. 💡 How is your portfolio positioning around these sudden supply chain anomalies? 🤔
⚠️ Not financial advice. Always manage your risk. 🛡️
🏷️ #HUMA #MarketStructure #CryptoAnalysis #GLMR
🦈 ⚖️
🚨 EXTERNAL SCRIPT COMPROMISE PRESSURES $HUMA AND $GLMR AS LIQUIDITY TESTS KEY SUPPORT 📉
Recent external script compromises across major web infrastructure have introduced short-term sentiment friction for assets like $HUMA , $GLMR , and $BLESS . 📊 Smart money is closely monitoring order book depth to determine if this friction triggers structural liquidations or merely a minor efficiency fill. ⚡
Market participants remain divided between anticipating a deeper liquidity hunt or a rapid technical recovery once patches absorb the vulnerability. 💡 How is your portfolio positioning around these sudden supply chain anomalies? 🤔
⚠️ Not financial advice. Always manage your risk. 🛡️
🏷️ #HUMA #MarketStructure #CryptoAnalysis #GLMR
🦈 ⚖️
Recent external script compromises across major web infrastructure have introduced short-term sentiment friction for assets like $HUMA , $GLMR , and $BLESS . 📊 Smart money is closely monitoring order book depth to determine if this friction triggers structural liquidations or merely a minor efficiency fill. ⚡
Market participants remain divided between anticipating a deeper liquidity hunt or a rapid technical recovery once patches absorb the vulnerability. 💡 How is your portfolio positioning around these sudden supply chain anomalies? 🤔
⚠️ Not financial advice. Always manage your risk. 🛡️
🏷️ #HUMA #MarketStructure #CryptoAnalysis #GLMR
🦈 ⚖️

19
·
--
See translation
$GLMR +15.74% | $ZRO +10.35% | $ENA -4.59%
#GLMR is up 15.74% at $0.00714800, trading on $3.1 M volume. The Moonbeam narrative stresses its specialized Layer 1 design beyond a simple EVM bridge, which may be fueling the rally.
#ZRO climbs 10.35% to $1.54 on $7.1 M volume, showing solid buyer interest despite the broader market softness.
#ENA slips 4.59% to $0.1144 while moving $24.2 M, a notable drop in price against a hefty turnover.
👀 Keep an eye on GLMR’s volume relative to its price jump; sustained buying could test the next resistance level.
#Write2Earn #Binance
$GLMR +15.74% | $ZRO +10.35% | $ENA -4.59%
#GLMR is up 15.74% at $0.00714800, trading on $3.1 M volume. The Moonbeam narrative stresses its specialized Layer 1 design beyond a simple EVM bridge, which may be fueling the rally.
#ZRO climbs 10.35% to $1.54 on $7.1 M volume, showing solid buyer interest despite the broader market softness.
#ENA slips 4.59% to $0.1144 while moving $24.2 M, a notable drop in price against a hefty turnover.
👀 Keep an eye on GLMR’s volume relative to its price jump; sustained buying could test the next resistance level.
#Write2Earn #Binance
#GLMR is up 15.74% at $0.00714800, trading on $3.1 M volume. The Moonbeam narrative stresses its specialized Layer 1 design beyond a simple EVM bridge, which may be fueling the rally.
#ZRO climbs 10.35% to $1.54 on $7.1 M volume, showing solid buyer interest despite the broader market softness.
#ENA slips 4.59% to $0.1144 while moving $24.2 M, a notable drop in price against a hefty turnover.
👀 Keep an eye on GLMR’s volume relative to its price jump; sustained buying could test the next resistance level.
#Write2Earn #Binance
5

·
--
See translation
🚨 HONG KONG REGULATORY EXPANSION BRINGS INSTITUTIONAL CLARITY FOR $RARE AND $GLMR 📈
Institutional capital requires structural certainty before deploying heavy liquidity into alternative assets. The upcoming legislative framework expanding licensing to dealers and custodians marks a pivotal shift toward mature market integration. 📊
While compliance hurdles remain strict with selective approvals, this regulatory bridge eliminates jurisdictional ambiguity. Smart money typically accumulates quietly during structural transitions before the broader market prices in structural permanence.
💬 Are you positioning ahead of institutional inflows as regulatory frameworks mature? 👇
⚠️ Not financial advice. Always manage your risk. 🛡️
🏷️ #RARE #GLMR #RegulatoryClarity #Crypto
⚖️
🚨 HONG KONG REGULATORY EXPANSION BRINGS INSTITUTIONAL CLARITY FOR $RARE AND $GLMR 📈
Institutional capital requires structural certainty before deploying heavy liquidity into alternative assets. The upcoming legislative framework expanding licensing to dealers and custodians marks a pivotal shift toward mature market integration. 📊
While compliance hurdles remain strict with selective approvals, this regulatory bridge eliminates jurisdictional ambiguity. Smart money typically accumulates quietly during structural transitions before the broader market prices in structural permanence.
💬 Are you positioning ahead of institutional inflows as regulatory frameworks mature? 👇
⚠️ Not financial advice. Always manage your risk. 🛡️
🏷️ #RARE #GLMR #RegulatoryClarity #Crypto
⚖️
Institutional capital requires structural certainty before deploying heavy liquidity into alternative assets. The upcoming legislative framework expanding licensing to dealers and custodians marks a pivotal shift toward mature market integration. 📊
While compliance hurdles remain strict with selective approvals, this regulatory bridge eliminates jurisdictional ambiguity. Smart money typically accumulates quietly during structural transitions before the broader market prices in structural permanence.
💬 Are you positioning ahead of institutional inflows as regulatory frameworks mature? 👇
⚠️ Not financial advice. Always manage your risk. 🛡️
🏷️ #RARE #GLMR #RegulatoryClarity #Crypto
⚖️

5

See translation
$GLMR 🔥 is making some serious moves!
A nearly 28% rally while the crypto market is struggling — that's definitely worth watching.
But here's what I'm curious about: can $GLMR hold these gains, or will sellers step in after this sharp move?
Would you watch GLMR from here, or wait for a pullback?
#GLMR #Moonbeam #Crypto #altcoins
{spot}(GLMRUSDT)
$GLMR 🔥 is making some serious moves!
A nearly 28% rally while the crypto market is struggling — that's definitely worth watching.
But here's what I'm curious about: can $GLMR hold these gains, or will sellers step in after this sharp move?
Would you watch GLMR from here, or wait for a pullback?
#GLMR #Moonbeam #Crypto #altcoins
A nearly 28% rally while the crypto market is struggling — that's definitely worth watching.
But here's what I'm curious about: can $GLMR hold these gains, or will sellers step in after this sharp move?
Would you watch GLMR from here, or wait for a pullback?
#GLMR #Moonbeam #Crypto #altcoins
3
538

·
--
See translation
$LUNC +4.22% | $AUDIO +3.72% | $GLMR +3.44%
#LUNC nudges to $0.00003656, up +4.22% on $1.1 M volume. The Terra‑based payment network is showing modest buying pressure after recent news.
#AUDIO climbs to $0.0112, up +3.72% with $1.2 M traded. The audio‑streaming protocol seems to be catching some short‑term interest.
#GLMR moves to $0.00679100, up +3.44% on $3.2 M volume. The Moonbeam ecosystem’s activity is noticeably higher than its peers.
📈 Watch the volume surge on GLMR; it may signal growing developer engagement.
#Write2Earn #Binance
$LUNC +4.22% | $AUDIO +3.72% | $GLMR +3.44%
#LUNC nudges to $0.00003656, up +4.22% on $1.1 M volume. The Terra‑based payment network is showing modest buying pressure after recent news.
#AUDIO climbs to $0.0112, up +3.72% with $1.2 M traded. The audio‑streaming protocol seems to be catching some short‑term interest.
#GLMR moves to $0.00679100, up +3.44% on $3.2 M volume. The Moonbeam ecosystem’s activity is noticeably higher than its peers.
📈 Watch the volume surge on GLMR; it may signal growing developer engagement.
#Write2Earn #Binance
#LUNC nudges to $0.00003656, up +4.22% on $1.1 M volume. The Terra‑based payment network is showing modest buying pressure after recent news.
#AUDIO climbs to $0.0112, up +3.72% with $1.2 M traded. The audio‑streaming protocol seems to be catching some short‑term interest.
#GLMR moves to $0.00679100, up +3.44% on $3.2 M volume. The Moonbeam ecosystem’s activity is noticeably higher than its peers.
📈 Watch the volume surge on GLMR; it may signal growing developer engagement.
#Write2Earn #Binance
16

·
--
See translation
$GLMR IS BACK ON THE RADAR!
Moonbeam ($GLMR ) is attracting serious market attention today.
Strong momentum is bringing traders back to GLMR. Volume and price action are worth watching. Can bulls continue this move? A breakout could bring more attention, but a sharp pullback is also possible.
My question: Is GLMR preparing for another leg up, or is a correction coming?
👇 Bullish or Bearish? Let me know!
#GLMR #Moonbeam #Crypto #Altcoins #BinanceSquare
{spot}(GLMRUSDT)
$GLMR IS BACK ON THE RADAR!
Moonbeam ($GLMR ) is attracting serious market attention today.
Strong momentum is bringing traders back to GLMR. Volume and price action are worth watching. Can bulls continue this move? A breakout could bring more attention, but a sharp pullback is also possible.
My question: Is GLMR preparing for another leg up, or is a correction coming?
👇 Bullish or Bearish? Let me know!
#GLMR #Moonbeam #Crypto #Altcoins #BinanceSquare
Moonbeam ($GLMR ) is attracting serious market attention today.
Strong momentum is bringing traders back to GLMR. Volume and price action are worth watching. Can bulls continue this move? A breakout could bring more attention, but a sharp pullback is also possible.
My question: Is GLMR preparing for another leg up, or is a correction coming?
👇 Bullish or Bearish? Let me know!
#GLMR #Moonbeam #Crypto #Altcoins #BinanceSquare

1
200

·
--
See translation
I fumbled $GLMR badly: sold the first bounce, then watched it chop without me. 🤦
Now it’s $0.006518, down 7.79% today, with $3.49M traded. Ugly.
The part I can’t ignore: volume is 3.6x the 20-day average, but price is still under both the 20D and 50D averages. RSI is sitting at 50 on the 4h, basically no conviction, while the last 4h window slipped another 1.3%. 😬
$BTC strength hasn’t helped this one either. Funding reads 0.000%, with longs still paying.
At $0.0065, I’m watching for a clean reclaim before taking this seriously. No chasing this time.
Holding or fading $GLMR?
#GLMR #Web3
I fumbled $GLMR badly: sold the first bounce, then watched it chop without me. 🤦
Now it’s $0.006518, down 7.79% today, with $3.49M traded. Ugly.
The part I can’t ignore: volume is 3.6x the 20-day average, but price is still under both the 20D and 50D averages. RSI is sitting at 50 on the 4h, basically no conviction, while the last 4h window slipped another 1.3%. 😬
$BTC strength hasn’t helped this one either. Funding reads 0.000%, with longs still paying.
At $0.0065, I’m watching for a clean reclaim before taking this seriously. No chasing this time.
Holding or fading $GLMR ?
#GLMR #Web3
Now it’s $0.006518, down 7.79% today, with $3.49M traded. Ugly.
The part I can’t ignore: volume is 3.6x the 20-day average, but price is still under both the 20D and 50D averages. RSI is sitting at 50 on the 4h, basically no conviction, while the last 4h window slipped another 1.3%. 😬
$BTC strength hasn’t helped this one either. Funding reads 0.000%, with longs still paying.
At $0.0065, I’m watching for a clean reclaim before taking this seriously. No chasing this time.
Holding or fading $GLMR ?
#GLMR #Web3
4

·
--
See translation
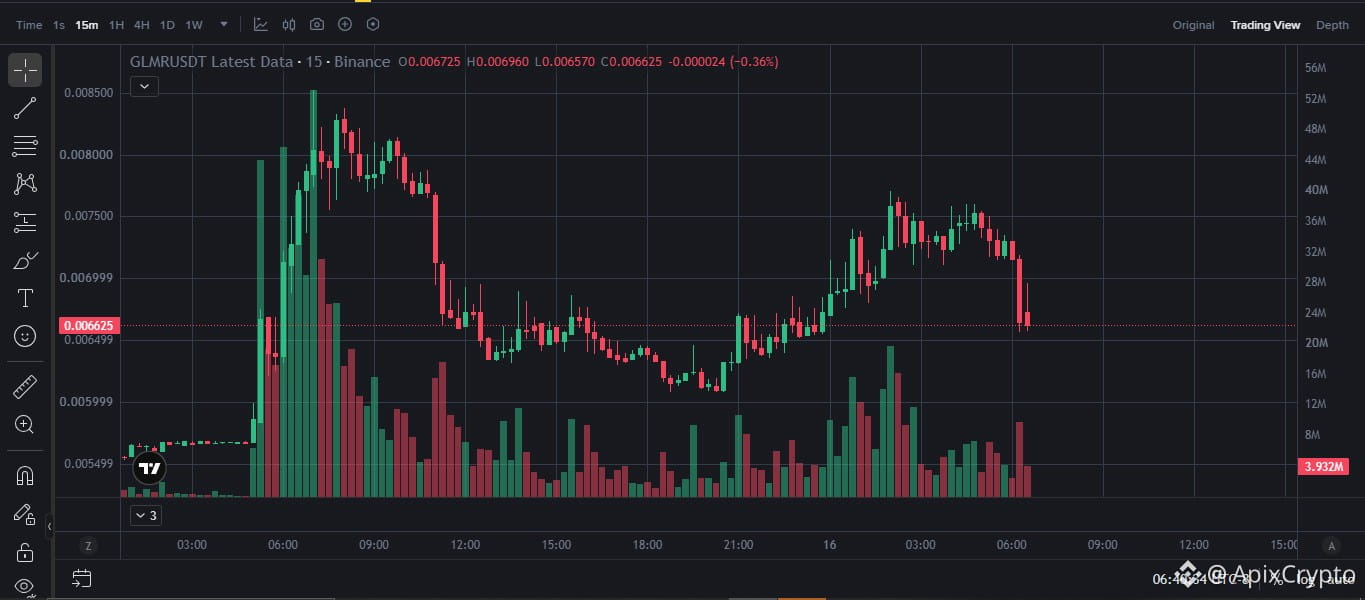
Moonbeam ($GLMR #GLMR
{spot}(GLMRUSDT)
is trading around $0.0065 – $0.0070, rebounding roughly 14% to 25% over the past 24 hours on a sharp spike in localized trading volume. Despite today's bounce, the token faces major structural risks following its network migration and exchange scrutiny.
Key Driver:
Spot trading volume surged by over 300%, lifting GLMR from a 24-hour low of $0.0055 to an intraday high near $0.0083 without a specific news catalyst.
Key Levels: Immediate support sits at $0.0060 – $0.0062. Reclaiming $0.0072 is needed to sustain upward momentum toward $0.0080, while losing support risks a retest of its September all-time low near $0.0054.
Main Risks: After shutting down its Polkadot network in August 2026 to pivot into an AI agent settlement protocol on Base, GLMR remains in a steep broader downtrend below its 50-day and 200-day moving averages. It also carries a Binance Monitoring Tag, signaling elevated volatility and potential delisting risk. #A Packed Week of Earnings and Data Tests Markets #AnthropicIPOTestsInvestorAppetiteForAI #BitcoinExtendsLosingStreakToSixWeeks #XRPFallsTo$0.89LowestSinceNovember2024
Moonbeam ($GLMR #GLMR
is trading around $0.0065 – $0.0070, rebounding roughly 14% to 25% over the past 24 hours on a sharp spike in localized trading volume. Despite today's bounce, the token faces major structural risks following its network migration and exchange scrutiny.
Key Driver:
Spot trading volume surged by over 300%, lifting GLMR from a 24-hour low of $0.0055 to an intraday high near $0.0083 without a specific news catalyst.
Key Levels: Immediate support sits at $0.0060 – $0.0062. Reclaiming $0.0072 is needed to sustain upward momentum toward $0.0080, while losing support risks a retest of its September all-time low near $0.0054.
Main Risks: After shutting down its Polkadot network in August 2026 to pivot into an AI agent settlement protocol on Base, GLMR remains in a steep broader downtrend below its 50-day and 200-day moving averages. It also carries a Binance Monitoring Tag, signaling elevated volatility and potential delisting risk. #A Packed Week of Earnings and Data Tests Markets #AnthropicIPOTestsInvestorAppetiteForAI #BitcoinExtendsLosingStreakToSixWeeks #XRPFallsTo$0.89LowestSinceNovember2024
is trading around $0.0065 – $0.0070, rebounding roughly 14% to 25% over the past 24 hours on a sharp spike in localized trading volume. Despite today's bounce, the token faces major structural risks following its network migration and exchange scrutiny.
Key Driver:
Spot trading volume surged by over 300%, lifting GLMR from a 24-hour low of $0.0055 to an intraday high near $0.0083 without a specific news catalyst.
Key Levels: Immediate support sits at $0.0060 – $0.0062. Reclaiming $0.0072 is needed to sustain upward momentum toward $0.0080, while losing support risks a retest of its September all-time low near $0.0054.
Main Risks: After shutting down its Polkadot network in August 2026 to pivot into an AI agent settlement protocol on Base, GLMR remains in a steep broader downtrend below its 50-day and 200-day moving averages. It also carries a Binance Monitoring Tag, signaling elevated volatility and potential delisting risk. #A Packed Week of Earnings and Data Tests Markets #AnthropicIPOTestsInvestorAppetiteForAI #BitcoinExtendsLosingStreakToSixWeeks #XRPFallsTo$0.89LowestSinceNovember2024
Phoenix Crypto:
The volume spike is encouraging, but GLMR still has major resistance to overcome. Holding $0.0060–$0.0062 and reclaiming $0.0072 would be important signs of strength. The bigger risks shouldn't be ignored! ⚠️
2
1
255


See translation
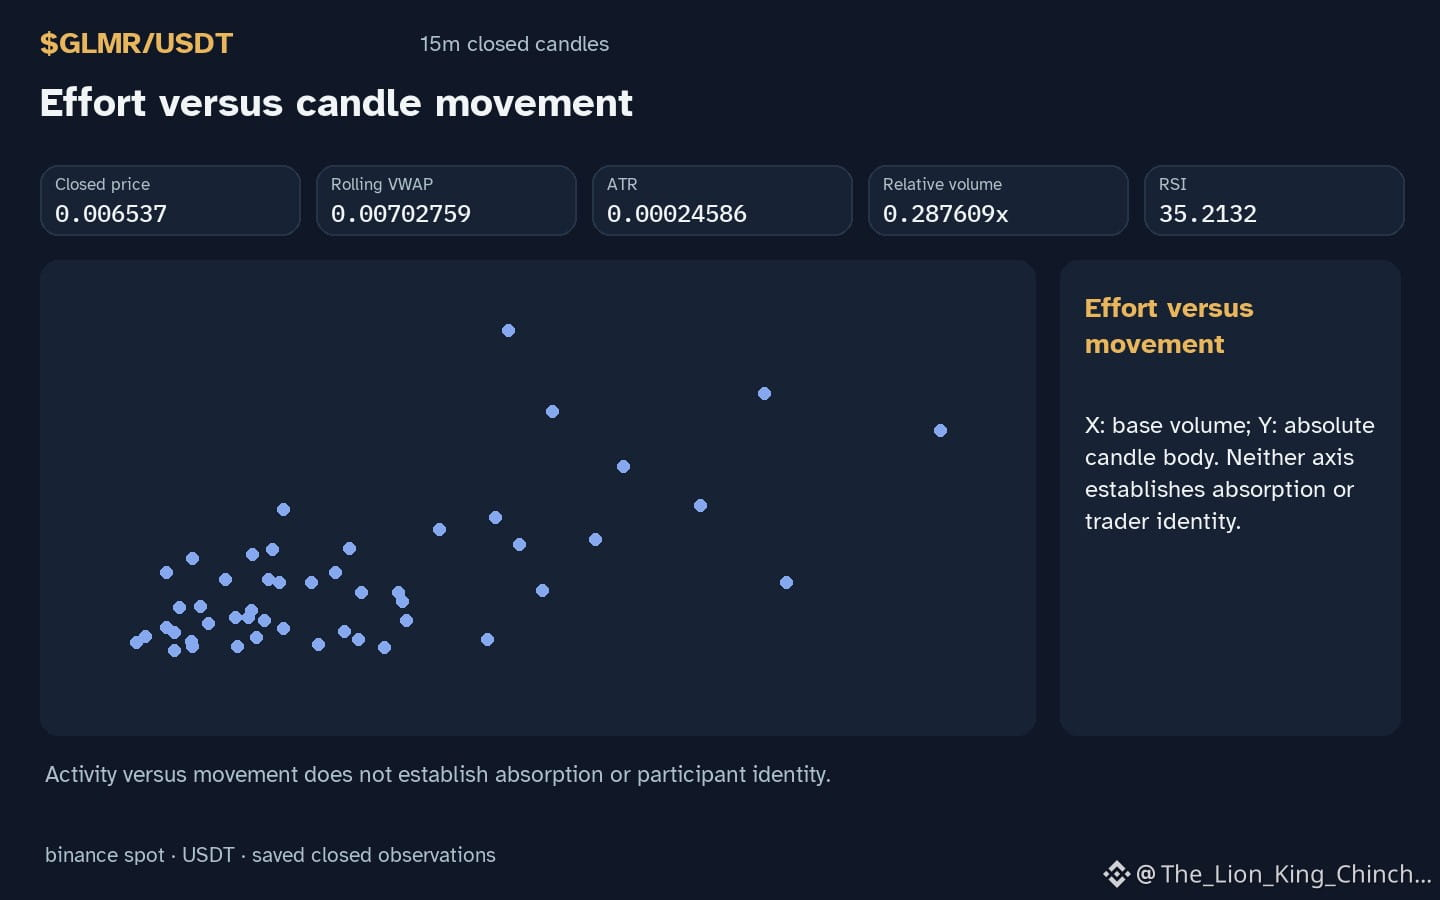
$GLMR: The Trade-off Between Fast Decisions and Mental Clarity
How can a researcher maintain emotional independence from market color when observing the current $GLMR chart? The daily change -18.4709% provides a specific data point that might influence one's initial mood or bias.
Consider a hypothetical trade-off between acting immediately on a perceived shift and waiting for a closed candle to verify the trend. When the hourly direction is down and the price stays inside recorded range, a common thought experiment is the choice between entry quality and chasing a move. Acting quickly might secure a better entry if the move continues, but it risks reacting to temporary noise. Conversely, waiting for more data improves clarity but often increases the distance to a meaningful invalidation point. This tension defines the difficulty of remaining objective.
The analogy of a neutral observer fails if one assumes that a lower RSI 35.2 or volume at 0.29x baseline automatically predicts a reversal. These are measurements of the past, not guarantees of the future. A self-check involves asking if the interpretation would change if the colors on the chart were inverted. If the bias remains, the interpretation is likely tied to the direction rather than the structural evidence. A closed-candle move above resistance 0.0076 would weaken a bearish interpretation, requiring a fresh reassessment of the range boundaries.
Probabilistic market research, not a recommendation or guaranteed return.
#GLMR #RiskManagement #CryptoLearning
$GLMR : The Trade-off Between Fast Decisions and Mental Clarity
How can a researcher maintain emotional independence from market color when observing the current $GLMR chart? The daily change -18.4709% provides a specific data point that might influence one's initial mood or bias.
Consider a hypothetical trade-off between acting immediately on a perceived shift and waiting for a closed candle to verify the trend. When the hourly direction is down and the price stays inside recorded range, a common thought experiment is the choice between entry quality and chasing a move. Acting quickly might secure a better entry if the move continues, but it risks reacting to temporary noise. Conversely, waiting for more data improves clarity but often increases the distance to a meaningful invalidation point. This tension defines the difficulty of remaining objective.
The analogy of a neutral observer fails if one assumes that a lower RSI 35.2 or volume at 0.29x baseline automatically predicts a reversal. These are measurements of the past, not guarantees of the future. A self-check involves asking if the interpretation would change if the colors on the chart were inverted. If the bias remains, the interpretation is likely tied to the direction rather than the structural evidence. A closed-candle move above resistance 0.0076 would weaken a bearish interpretation, requiring a fresh reassessment of the range boundaries.
Probabilistic market research, not a recommendation or guaranteed return.
#GLMR #RiskManagement #CryptoLearning
How can a researcher maintain emotional independence from market color when observing the current $GLMR chart? The daily change -18.4709% provides a specific data point that might influence one's initial mood or bias.
Consider a hypothetical trade-off between acting immediately on a perceived shift and waiting for a closed candle to verify the trend. When the hourly direction is down and the price stays inside recorded range, a common thought experiment is the choice between entry quality and chasing a move. Acting quickly might secure a better entry if the move continues, but it risks reacting to temporary noise. Conversely, waiting for more data improves clarity but often increases the distance to a meaningful invalidation point. This tension defines the difficulty of remaining objective.
The analogy of a neutral observer fails if one assumes that a lower RSI 35.2 or volume at 0.29x baseline automatically predicts a reversal. These are measurements of the past, not guarantees of the future. A self-check involves asking if the interpretation would change if the colors on the chart were inverted. If the bias remains, the interpretation is likely tied to the direction rather than the structural evidence. A closed-candle move above resistance 0.0076 would weaken a bearish interpretation, requiring a fresh reassessment of the range boundaries.
Probabilistic market research, not a recommendation or guaranteed return.
#GLMR #RiskManagement #CryptoLearning
22

·
--
See translation
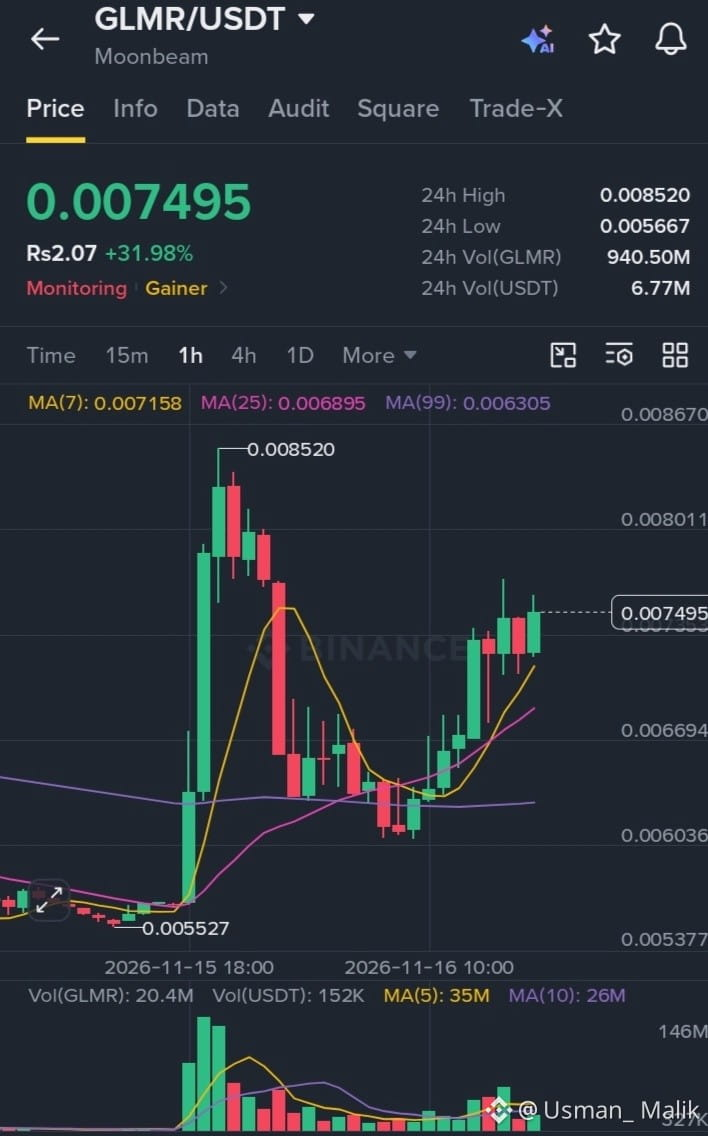
🚀 $GLMR (Moonbeam) — Strong Bullish Momentum
$GLMR is showing strong bullish momentum with a sharp 31.46% gain. Buyers are dominating, with a potential resistance breakout and continuation setup.
Trade Setup (Long)
Entry Zone: 0.00720 – 0.00745
TP1: 0.00780
TP2: 0.00820
TP3: 0.00870
Stop Loss: 0.00695
Bullish bias remains active while price holds above support.
#GLMR #Moonbeam #CryptoTrading.
🚀 $GLMR (Moonbeam) — Strong Bullish Momentum
$GLMR is showing strong bullish momentum with a sharp 31.46% gain. Buyers are dominating, with a potential resistance breakout and continuation setup.
Trade Setup (Long)
Entry Zone: 0.00720 – 0.00745
TP1: 0.00780
TP2: 0.00820
TP3: 0.00870
Stop Loss: 0.00695
Bullish bias remains active while price holds above support.
#GLMR #Moonbeam #CryptoTrading.
$GLMR is showing strong bullish momentum with a sharp 31.46% gain. Buyers are dominating, with a potential resistance breakout and continuation setup.
Trade Setup (Long)
Entry Zone: 0.00720 – 0.00745
TP1: 0.00780
TP2: 0.00820
TP3: 0.00870
Stop Loss: 0.00695
Bullish bias remains active while price holds above support.
#GLMR #Moonbeam #CryptoTrading.
152

See translation
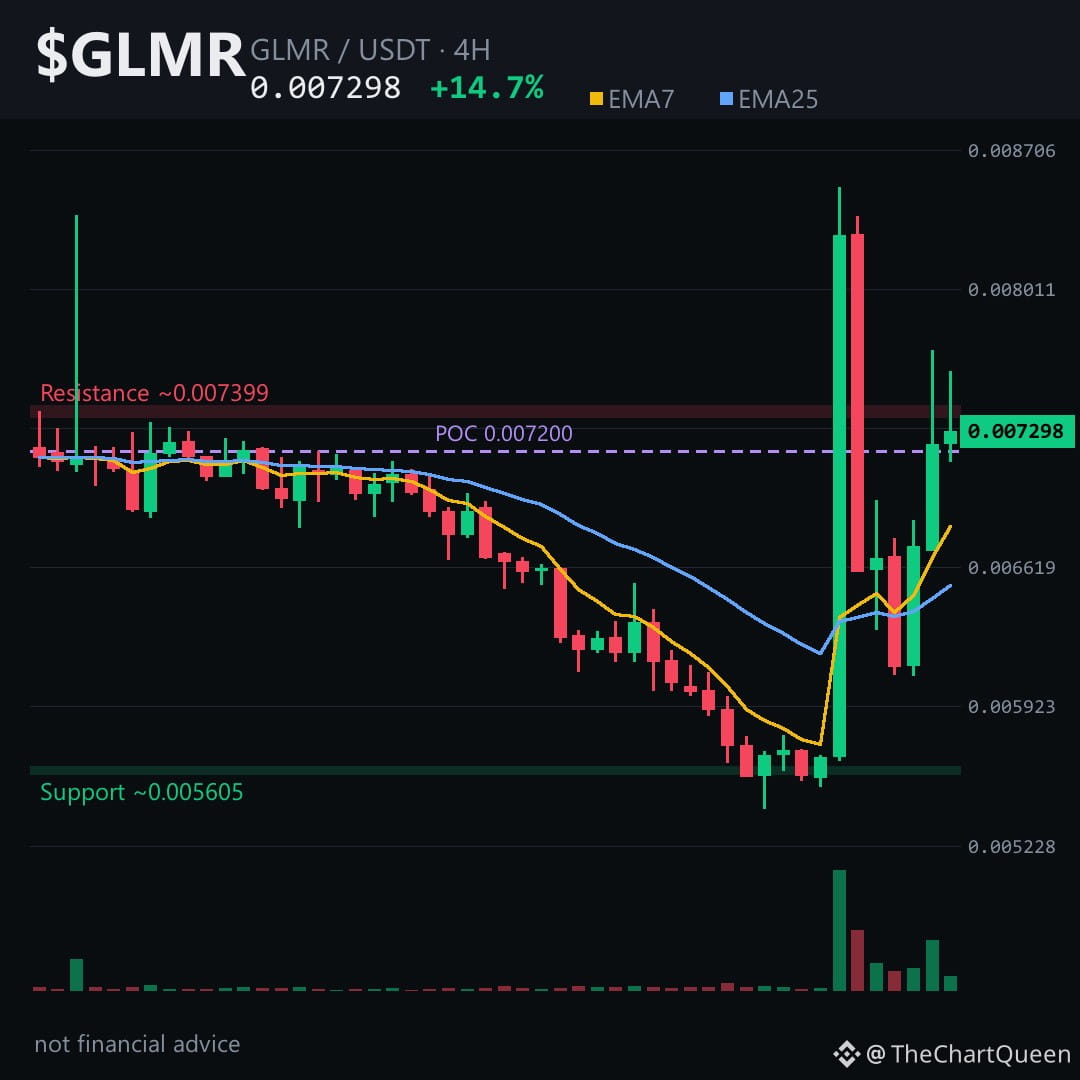
Why did $GLMR just spike 45% in a single 4-hour candle — and then hand back nearly half of it?
That explosive green candle pushed price straight into the volume profile's point of control around 0.0072, got rejected, fell 20%, and has been rebuilding since.
The 4-hour picture is quietly bullish: shorter-term MAs stacked above longer ones, RSI neutral, higher lows for 12 hours. A staircase pattern — often keeps grinding up once the spike digests.
The level that matters most is 0.0069. That's the 4-hour invalidation zone — lose that on a close, and the bullish read falls apart. If it holds, path of least resistance points toward 0.0079, matching the highs from that wild candle.
Tap $GLMR to pull up the chart and see the structure yourself.
My read: 4-hour trend is constructive, but the daily is still bearish, so any upside is a bounce within a larger downtrend until proven otherwise.
I'll be watching how $GLMR behaves around 0.0069 in the next few sessions — follow along for that update.
What's the one level on your chart that makes or breaks this setup for you? 👇
⚠️ Not financial advice. DYOR.
#GLMR #Moonbeam #Crypto #BinanceSquare
Why did $GLMR just spike 45% in a single 4-hour candle — and then hand back nearly half of it?
That explosive green candle pushed price straight into the volume profile's point of control around 0.0072, got rejected, fell 20%, and has been rebuilding since.
The 4-hour picture is quietly bullish: shorter-term MAs stacked above longer ones, RSI neutral, higher lows for 12 hours. A staircase pattern — often keeps grinding up once the spike digests.
The level that matters most is 0.0069. That's the 4-hour invalidation zone — lose that on a close, and the bullish read falls apart. If it holds, path of least resistance points toward 0.0079, matching the highs from that wild candle.
Tap $GLMR to pull up the chart and see the structure yourself.
My read: 4-hour trend is constructive, but the daily is still bearish, so any upside is a bounce within a larger downtrend until proven otherwise.
I'll be watching how $GLMR behaves around 0.0069 in the next few sessions — follow along for that update.
What's the one level on your chart that makes or breaks this setup for you? 👇
⚠️ Not financial advice. DYOR.
#GLMR #Moonbeam #Crypto #BinanceSquare
That explosive green candle pushed price straight into the volume profile's point of control around 0.0072, got rejected, fell 20%, and has been rebuilding since.
The 4-hour picture is quietly bullish: shorter-term MAs stacked above longer ones, RSI neutral, higher lows for 12 hours. A staircase pattern — often keeps grinding up once the spike digests.
The level that matters most is 0.0069. That's the 4-hour invalidation zone — lose that on a close, and the bullish read falls apart. If it holds, path of least resistance points toward 0.0079, matching the highs from that wild candle.
Tap $GLMR to pull up the chart and see the structure yourself.
My read: 4-hour trend is constructive, but the daily is still bearish, so any upside is a bounce within a larger downtrend until proven otherwise.
I'll be watching how $GLMR behaves around 0.0069 in the next few sessions — follow along for that update.
What's the one level on your chart that makes or breaks this setup for you? 👇
⚠️ Not financial advice. DYOR.
#GLMR #Moonbeam #Crypto #BinanceSquare
4

·
--
See translation
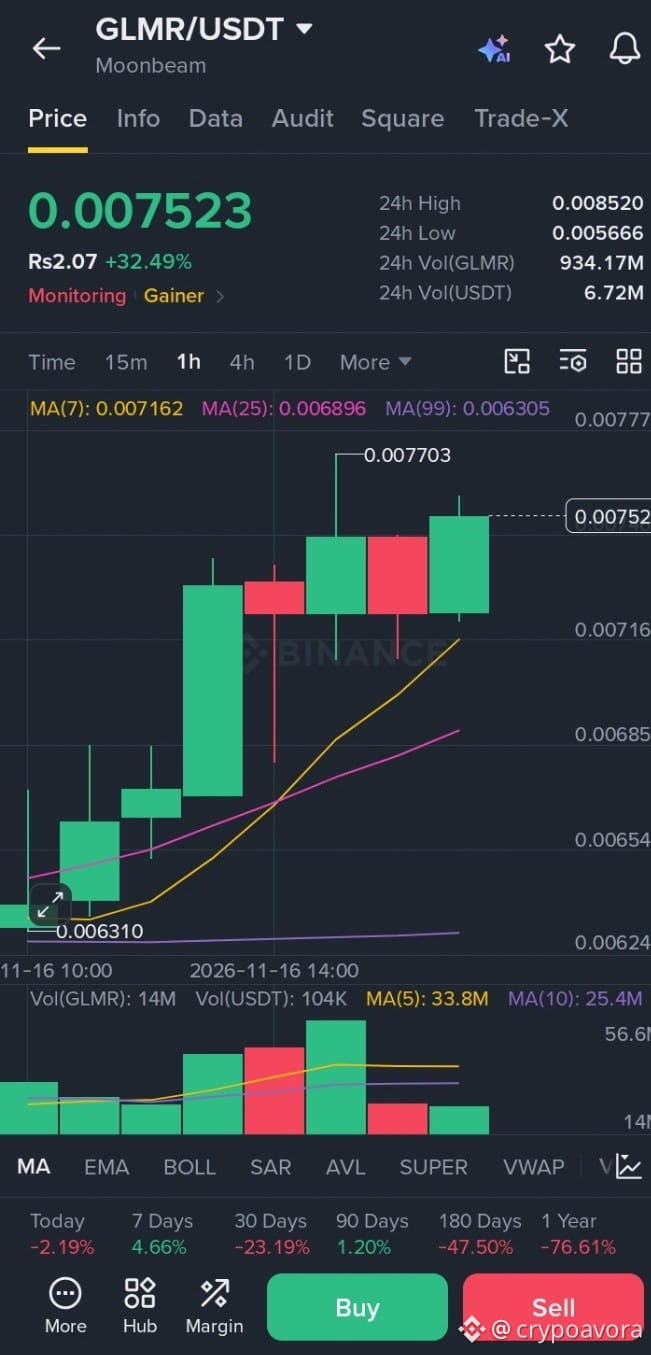
$GLMR 🚨 $GLMR JUST WOKE UP! IS THIS A REAL REVERSAL OR A TRAP? 🔥
After bleeding throughout November, GLMR suddenly delivered a massive surprise!
📈 What happened?
Mid-October: Around $0.0105
Saturday low: $0.00541
Sunday pump: $0.00567 → $0.00852
Nearly 50% rally in just 3 hourly candles!
Trading volume surged more than 10x its usual level.
But here's the interesting part 👀
{spot}(GLMRUSDT)
Most of the pump was sold off, bringing GLMR back to $0.00608. However, buyers defended that level, and price is now recovering toward $0.0075.
🎯 Key levels to watch:
Resistance 1: $0.0077
Major resistance: $0.00852
Support: $0.00608
🔥 My take: A breakout above $0.0077 could bring $0.00852 back into focus. But losing $0.00608 would weaken the recovery setup.
💬 Let's discuss: Do you think $GLMR is preparing for another rally, or was this just a weekend pump to trap buyers?
👇 Comment your target: $0.0085 or back to $0.0060?
#GLMR #Moonbeam #CryptoMarket #Altcoins #BinanceSquare #CryptoTrading
$GLMR 🚨 $GLMR JUST WOKE UP! IS THIS A REAL REVERSAL OR A TRAP? 🔥
After bleeding throughout November, GLMR suddenly delivered a massive surprise!
📈 What happened?
Mid-October: Around $0.0105
Saturday low: $0.00541
Sunday pump: $0.00567 → $0.00852
Nearly 50% rally in just 3 hourly candles!
Trading volume surged more than 10x its usual level.
But here's the interesting part 👀
Most of the pump was sold off, bringing GLMR back to $0.00608. However, buyers defended that level, and price is now recovering toward $0.0075.
🎯 Key levels to watch:
Resistance 1: $0.0077
Major resistance: $0.00852
Support: $0.00608
🔥 My take: A breakout above $0.0077 could bring $0.00852 back into focus. But losing $0.00608 would weaken the recovery setup.
💬 Let's discuss: Do you think $GLMR is preparing for another rally, or was this just a weekend pump to trap buyers?
👇 Comment your target: $0.0085 or back to $0.0060?
#GLMR #Moonbeam #CryptoMarket #Altcoins #BinanceSquare #CryptoTrading
After bleeding throughout November, GLMR suddenly delivered a massive surprise!
📈 What happened?
Mid-October: Around $0.0105
Saturday low: $0.00541
Sunday pump: $0.00567 → $0.00852
Nearly 50% rally in just 3 hourly candles!
Trading volume surged more than 10x its usual level.
But here's the interesting part 👀
Most of the pump was sold off, bringing GLMR back to $0.00608. However, buyers defended that level, and price is now recovering toward $0.0075.
🎯 Key levels to watch:
Resistance 1: $0.0077
Major resistance: $0.00852
Support: $0.00608
🔥 My take: A breakout above $0.0077 could bring $0.00852 back into focus. But losing $0.00608 would weaken the recovery setup.
💬 Let's discuss: Do you think $GLMR is preparing for another rally, or was this just a weekend pump to trap buyers?
👇 Comment your target: $0.0085 or back to $0.0060?
#GLMR #Moonbeam #CryptoMarket #Altcoins #BinanceSquare #CryptoTrading
3

·
--
See translation
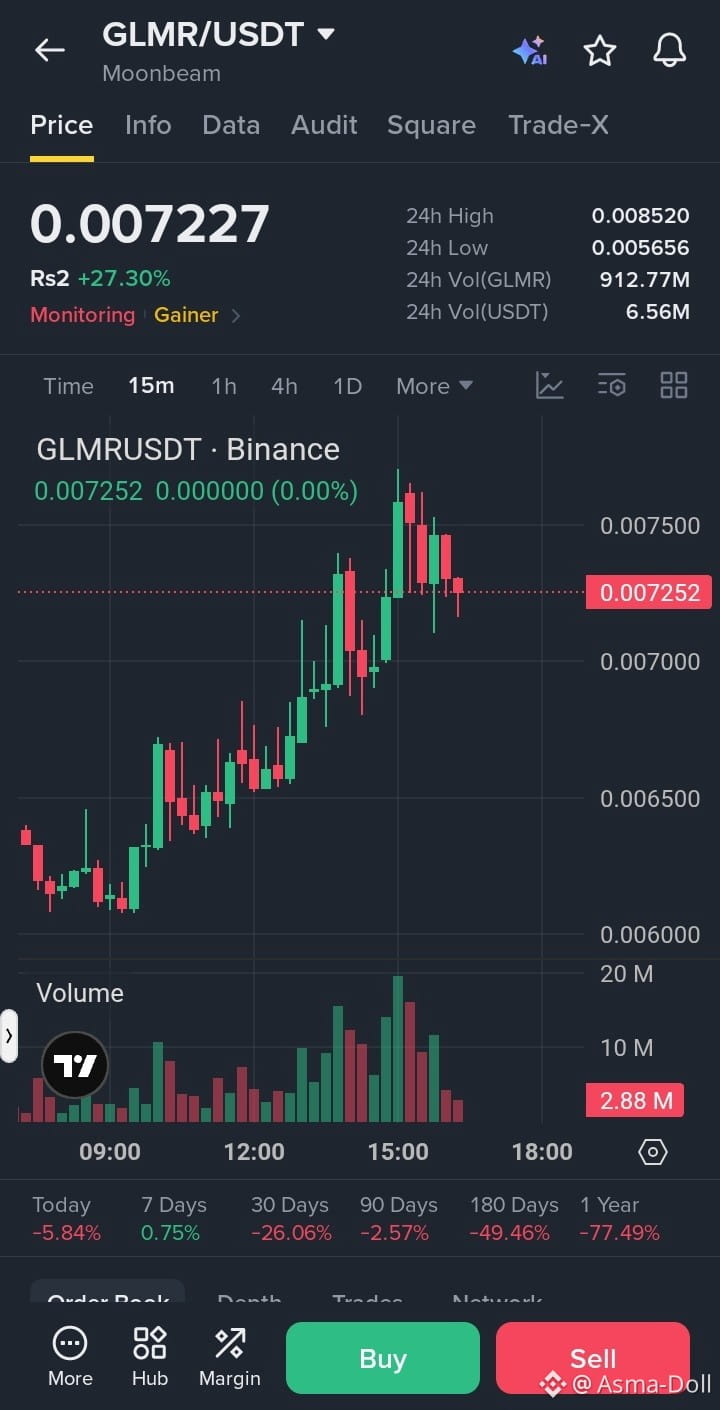
🔴 $GLMR /USDT – SHORT SIGNAL
BEARISH SETUP – HIGH VOLATILITY
Entry Zone: 0.00720 – 0.00740
Stop Loss (SL): 0.00775
Take Profit Targets:
* TP1: 0.00695
* TP2: 0.00665
* TP3: 0.00630
Trade here $GLMR
{spot}(GLMRUSDT)
Analysis:
* GLMR surged +27.30%, showing a sharp speculative pump.
* Strong rejection near 0.00852 may indicate selling pressure.
* High trading volume suggests increased volatility.
* A pullback is possible after the rapid upward move.
* Avoid chasing shorts while bullish momentum remains strong.
Confirmation: Clean breakdown below 0.00715 with strong selling volume.
Risk-to-Reward: Approximately 1:0.6 to 1:2.4, depending on entry and target.
⚠️ Wait for bearish confirmation before entering. This is a counter-trend setup, not a confirmed reversal.
#GLMR #Moonbeam #BinanceSignals #CryptoShort #AltcoinTrading
🔴 $GLMR /USDT – SHORT SIGNAL
BEARISH SETUP – HIGH VOLATILITY
Entry Zone: 0.00720 – 0.00740
Stop Loss (SL): 0.00775
Take Profit Targets:
* TP1: 0.00695
* TP2: 0.00665
* TP3: 0.00630
Trade here $GLMR
Analysis:
* GLMR surged +27.30%, showing a sharp speculative pump.
* Strong rejection near 0.00852 may indicate selling pressure.
* High trading volume suggests increased volatility.
* A pullback is possible after the rapid upward move.
* Avoid chasing shorts while bullish momentum remains strong.
Confirmation: Clean breakdown below 0.00715 with strong selling volume.
Risk-to-Reward: Approximately 1:0.6 to 1:2.4, depending on entry and target.
⚠️ Wait for bearish confirmation before entering. This is a counter-trend setup, not a confirmed reversal.
#GLMR #Moonbeam #BinanceSignals #CryptoShort #AltcoinTrading
BEARISH SETUP – HIGH VOLATILITY
Entry Zone: 0.00720 – 0.00740
Stop Loss (SL): 0.00775
Take Profit Targets:
* TP1: 0.00695
* TP2: 0.00665
* TP3: 0.00630
Trade here $GLMR
Analysis:
* GLMR surged +27.30%, showing a sharp speculative pump.
* Strong rejection near 0.00852 may indicate selling pressure.
* High trading volume suggests increased volatility.
* A pullback is possible after the rapid upward move.
* Avoid chasing shorts while bullish momentum remains strong.
Confirmation: Clean breakdown below 0.00715 with strong selling volume.
Risk-to-Reward: Approximately 1:0.6 to 1:2.4, depending on entry and target.
⚠️ Wait for bearish confirmation before entering. This is a counter-trend setup, not a confirmed reversal.
#GLMR #Moonbeam #BinanceSignals #CryptoShort #AltcoinTrading
1
15
Log in to explore more content
Join global crypto users on Binance Square
⚡️ Get latest and useful information about crypto.
💬 Trusted by the world’s largest crypto exchange.
👍 Discover real insights from verified creators.
Email / Phone number
Trending Topics
1
#NvidiaBeatsEstimatesWith$130BQ4Outlook
2,931 views
58 Discussing
2
#AnthropicIPOPriceCouldExceed$80
6,918 views
65 Discussing
3
#CanNvidia’sDataCenterGrowthContinue?
15,493 views
274 Discussing
4
#DBSAndCirclePartnerToExpandAsianInstitutionsUSDCAccess
735 views
15 Discussing
5
#LedgerHardwareImplantReportsExtendToDubai
79 views
20 Discussing
6
#NvidiaBoardNotConsideringHuang’sReturnasCEO
174,096 views
1,277 Discussing
7
#KOSPIFalls2.59%ToLowestCloseSinceFebruary
47,892 views
536 Discussing
8
#AnthropicClearedToListOnNasdaqAsANT
41,758 views
418 Discussing
9
#WhatInvestmentSignalsDo13FFilingsReveal?
93,187 views
827 Discussing
10
#TetherCapitalMakesStrategicInvestmentInStables
24,184 views
231 Discussing