
#gemi
gemi
14,029 views
37 Discussing
Hot
Latest

See translation
📊 $GEMI REBOUNDS AFTER HOURS AS RETAIL VOLUME COOLS ACROSS THE BOARD 📉
Entry: 2.79 ⚡
Institutional balance sheets reveal a fascinating divergence as retail flow contracts. While platform assets expanded to 13.4 billion, spot volume compression forced aggressive operating overhead cuts to narrow quarterly net losses. 📊
Diversification into prediction markets printed a 52 percent quarterly expansion, highlighting where smart capital seeks new yield during low-volatility regimes. 💡
💬 Are legacy venues pivoting fast enough to capture structural liquidity shifts, or is fee compression here to stay? 👇
⚠️ Not financial advice. Always manage your risk. 🛡️
🏷️ #GEMI #CryptoExchange #MarketStructure #OrderFlow
🦈 ⚖️
📊 $GEMI REBOUNDS AFTER HOURS AS RETAIL VOLUME COOLS ACROSS THE BOARD 📉
Entry: 2.79 ⚡
Institutional balance sheets reveal a fascinating divergence as retail flow contracts. While platform assets expanded to 13.4 billion, spot volume compression forced aggressive operating overhead cuts to narrow quarterly net losses. 📊
Diversification into prediction markets printed a 52 percent quarterly expansion, highlighting where smart capital seeks new yield during low-volatility regimes. 💡
💬 Are legacy venues pivoting fast enough to capture structural liquidity shifts, or is fee compression here to stay? 👇
⚠️ Not financial advice. Always manage your risk. 🛡️
🏷️ #GEMI #CryptoExchange #MarketStructure #OrderFlow
🦈 ⚖️
Entry: 2.79 ⚡
Institutional balance sheets reveal a fascinating divergence as retail flow contracts. While platform assets expanded to 13.4 billion, spot volume compression forced aggressive operating overhead cuts to narrow quarterly net losses. 📊
Diversification into prediction markets printed a 52 percent quarterly expansion, highlighting where smart capital seeks new yield during low-volatility regimes. 💡
💬 Are legacy venues pivoting fast enough to capture structural liquidity shifts, or is fee compression here to stay? 👇
⚠️ Not financial advice. Always manage your risk. 🛡️
🏷️ #GEMI #CryptoExchange #MarketStructure #OrderFlow
🦈 ⚖️
GEMIUS-9.16%
6

See translation
RETAIL VOLUME DRYING UP AS $GEMI CUTS COSTS AND PIVOTS TO PREDICTIONS! 📉⚡
The latest earnings from $GEMI expose a harsh reality: retail capital has gone quiet after the initial 2025 euphoria. 📊 Trading volume cratering by over seventy percent shows liquidity migrating elsewhere while exchanges tighten their belts to survive the winter. 🛡️
Even with a narrowed net loss and rising platform assets, the pivot toward prediction markets reveals where platforms are scrambling for fresh revenue streams. 💡 When traditional spot volume cools down, survival demands aggressive adaptation and lean operations. ⚡
💬 Are prediction markets enough to rescue exchange margins, or is retail waiting on the sidelines for the next major macro catalyst? 👇
⚠️ Not financial advice. Always manage your risk. 🛡️
🏷️ #GEMI #CryptoExchange #Earnings #MarketTrends
🔥 💎
RETAIL VOLUME DRYING UP AS $GEMI CUTS COSTS AND PIVOTS TO PREDICTIONS! 📉⚡
The latest earnings from $GEMI expose a harsh reality: retail capital has gone quiet after the initial 2025 euphoria. 📊 Trading volume cratering by over seventy percent shows liquidity migrating elsewhere while exchanges tighten their belts to survive the winter. 🛡️
Even with a narrowed net loss and rising platform assets, the pivot toward prediction markets reveals where platforms are scrambling for fresh revenue streams. 💡 When traditional spot volume cools down, survival demands aggressive adaptation and lean operations. ⚡
💬 Are prediction markets enough to rescue exchange margins, or is retail waiting on the sidelines for the next major macro catalyst? 👇
⚠️ Not financial advice. Always manage your risk. 🛡️
🏷️ #GEMI #CryptoExchange #Earnings #MarketTrends
🔥 💎
The latest earnings from $GEMI expose a harsh reality: retail capital has gone quiet after the initial 2025 euphoria. 📊 Trading volume cratering by over seventy percent shows liquidity migrating elsewhere while exchanges tighten their belts to survive the winter. 🛡️
Even with a narrowed net loss and rising platform assets, the pivot toward prediction markets reveals where platforms are scrambling for fresh revenue streams. 💡 When traditional spot volume cools down, survival demands aggressive adaptation and lean operations. ⚡
💬 Are prediction markets enough to rescue exchange margins, or is retail waiting on the sidelines for the next major macro catalyst? 👇
⚠️ Not financial advice. Always manage your risk. 🛡️
🏷️ #GEMI #CryptoExchange #Earnings #MarketTrends
🔥 💎
GEMIUS-9.16%
3


·
--
See translation
📉 Gemini's trading volume drops 73% as Q3 revenue falls to $41M
Gemini reported $40.9 million in Q3 revenue, down 19% year over year, as trading volume fell to $4.5 billion from $16.4 billion a year earlier. Its net loss narrowed to $58.6 million from nearly $160 million, helped by a 30% cut in operating expenses. Assets on the platform rose to $13.4 billion from $8.4 billion in Q2, and prediction market revenue grew 52% quarter over quarter to $800,000. GEMI shares rose 6.5% after hours to $2.79 but remain down about 75% this year.
⭐ The sharp drop in exchange volume shows how much retail trading has cooled since the 2025 bull run, pushing exchanges to cut costs and look for new revenue such as prediction markets.
#Gemini #GEMI #Earnings #CryptoExchange
📉 Gemini's trading volume drops 73% as Q3 revenue falls to $41M
Gemini reported $40.9 million in Q3 revenue, down 19% year over year, as trading volume fell to $4.5 billion from $16.4 billion a year earlier. Its net loss narrowed to $58.6 million from nearly $160 million, helped by a 30% cut in operating expenses. Assets on the platform rose to $13.4 billion from $8.4 billion in Q2, and prediction market revenue grew 52% quarter over quarter to $800,000. GEMI shares rose 6.5% after hours to $2.79 but remain down about 75% this year.
⭐ The sharp drop in exchange volume shows how much retail trading has cooled since the 2025 bull run, pushing exchanges to cut costs and look for new revenue such as prediction markets.
#Gemini #GEMI #Earnings #CryptoExchange
Gemini reported $40.9 million in Q3 revenue, down 19% year over year, as trading volume fell to $4.5 billion from $16.4 billion a year earlier. Its net loss narrowed to $58.6 million from nearly $160 million, helped by a 30% cut in operating expenses. Assets on the platform rose to $13.4 billion from $8.4 billion in Q2, and prediction market revenue grew 52% quarter over quarter to $800,000. GEMI shares rose 6.5% after hours to $2.79 but remain down about 75% this year.
⭐ The sharp drop in exchange volume shows how much retail trading has cooled since the 2025 bull run, pushing exchanges to cut costs and look for new revenue such as prediction markets.
#Gemini #GEMI #Earnings #CryptoExchange
GEMIUS-9.16%
248

·
--
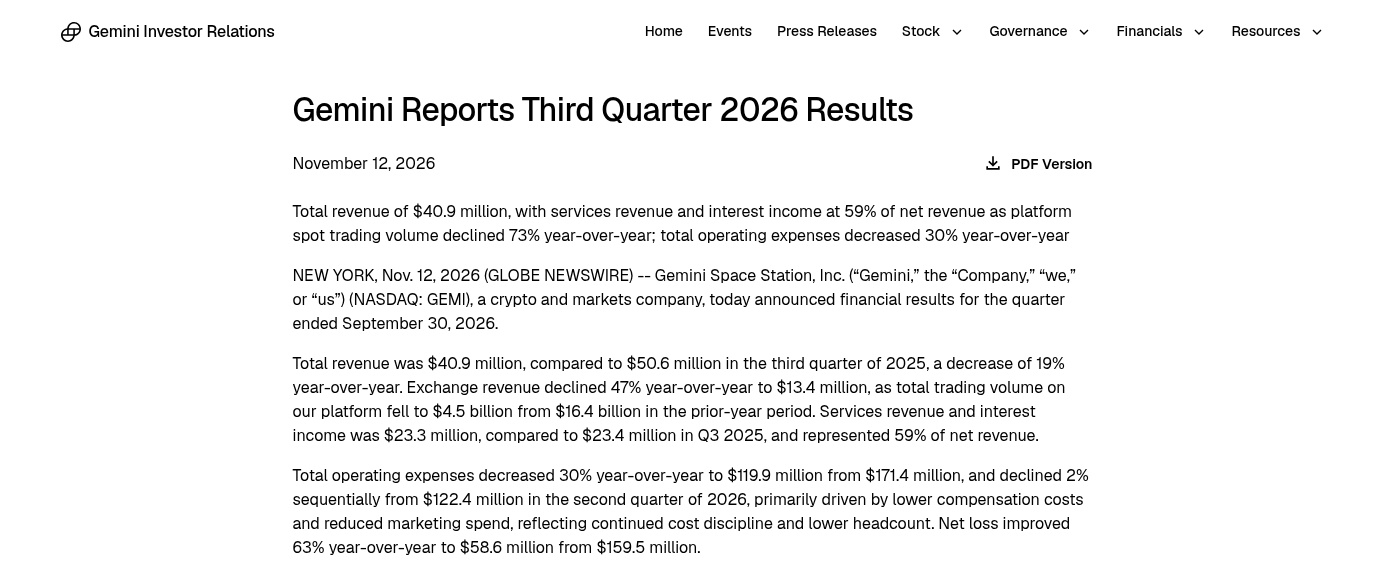
I just came across a press release on Gemini’s (Nasdaq: GEMI) investor relations website announcing its third-quarter results for the period ended September 30, 2026. It was published on November 12.
Revenue for the quarter totaled $40.9 million, down 19% year over year from $50.6 million. Platform trading volume fell from $16.4 billion to $4.5 billion, a 73% year-over-year decline. Exchange revenue fell 47% year over year to $13.4 million. Services revenue and interest income totaled $23.3 million, about 59% of net revenue.
On the other hand, operating expenses decreased 30% year over year to $119.9 million, marking a decline for the third consecutive quarter. Net loss narrowed 63% year over year to $58.6 million, compared with a loss of $159.5 million in the same period last year. As of September 30, cash and cash equivalents stood at $194.1 million, and platform assets totaled $13.4 billion.
Trading volume fell considerably, while expenses are also being reduced. The shareholder conference call is scheduled for 8:30 a.m. Eastern Time on November 13.
#GEMI #Gemini
I just came across a press release on Gemini’s (Nasdaq: GEMI) investor relations website announcing its third-quarter results for the period ended September 30, 2026. It was published on November 12.
Revenue for the quarter totaled $40.9 million, down 19% year over year from $50.6 million. Platform trading volume fell from $16.4 billion to $4.5 billion, a 73% year-over-year decline. Exchange revenue fell 47% year over year to $13.4 million. Services revenue and interest income totaled $23.3 million, about 59% of net revenue.
On the other hand, operating expenses decreased 30% year over year to $119.9 million, marking a decline for the third consecutive quarter. Net loss narrowed 63% year over year to $58.6 million, compared with a loss of $159.5 million in the same period last year. As of September 30, cash and cash equivalents stood at $194.1 million, and platform assets totaled $13.4 billion.
Trading volume fell considerably, while expenses are also being reduced. The shareholder conference call is scheduled for 8:30 a.m. Eastern Time on November 13.
#GEMI #Gemini
Revenue for the quarter totaled $40.9 million, down 19% year over year from $50.6 million. Platform trading volume fell from $16.4 billion to $4.5 billion, a 73% year-over-year decline. Exchange revenue fell 47% year over year to $13.4 million. Services revenue and interest income totaled $23.3 million, about 59% of net revenue.
On the other hand, operating expenses decreased 30% year over year to $119.9 million, marking a decline for the third consecutive quarter. Net loss narrowed 63% year over year to $58.6 million, compared with a loss of $159.5 million in the same period last year. As of September 30, cash and cash equivalents stood at $194.1 million, and platform assets totaled $13.4 billion.
Trading volume fell considerably, while expenses are also being reduced. The shareholder conference call is scheduled for 8:30 a.m. Eastern Time on November 13.
#GEMI #Gemini
GEMIUS-9.16%
64

🇺🇸 Gemini sells European business for less than $10 million
The Winklevoss brothers’ crypto exchange is selling its UK and European divisions to KAST, a payments company specializing in stablecoins. The deal is worth less than $10 million.
Back in February, Gemini announced it was exiting the UK and European markets and cutting staff. The company decided to focus on its US business.
#GEMI #exchanges
🇺🇸 Gemini sells European business for less than $10 million
The Winklevoss brothers’ crypto exchange is selling its UK and European divisions to KAST, a payments company specializing in stablecoins. The deal is worth less than $10 million.
Back in February, Gemini announced it was exiting the UK and European markets and cutting staff. The company decided to focus on its US business.
#GEMI #exchanges
The Winklevoss brothers’ crypto exchange is selling its UK and European divisions to KAST, a payments company specializing in stablecoins. The deal is worth less than $10 million.
Back in February, Gemini announced it was exiting the UK and European markets and cutting staff. The company decided to focus on its US business.
#GEMI #exchanges
1
291

·
--
$GEMI / Tokenized Stocks · Premium Monitoring
Token: GEMIon | Underlying: GEMI | Coefficient: 1
On-chain price: $4.67 (24h -8.17%)
US stock underlying: $4.67
Premium / Discount: +0.00% (vs underlying fair value) (Underlying market closed; pricing uses the most recent close)
52-week range: $3.38 - $26.75
Number of holding addresses: 111
Underlying status: closed (Weekend or Holiday)
Why monitor the premium: The token can be traded 24/7, while the underlying US stock only provides quotes during US Eastern Time market hours.
During market-closed periods, the premium is easiest to widen—either due to on-chain accumulation or due to redemption / halt expectations building up.
Abnormal premium jumps often reveal sentiment and arbitrage gaps earlier than the price itself.
Do you think premium monitoring is more useful, or is watching the price enough?👇
(The above is educational information from public data, not investment advice; DYOR)
#GEMI
$GEMI / Tokenized Stocks · Premium Monitoring
Token: GEMIon | Underlying: GEMI | Coefficient: 1
On-chain price: $4.67 (24h -8.17%)
US stock underlying: $4.67
Premium / Discount: +0.00% (vs underlying fair value) (Underlying market closed; pricing uses the most recent close)
52-week range: $3.38 - $26.75
Number of holding addresses: 111
Underlying status: closed (Weekend or Holiday)
Why monitor the premium: The token can be traded 24/7, while the underlying US stock only provides quotes during US Eastern Time market hours.
During market-closed periods, the premium is easiest to widen—either due to on-chain accumulation or due to redemption / halt expectations building up.
Abnormal premium jumps often reveal sentiment and arbitrage gaps earlier than the price itself.
Do you think premium monitoring is more useful, or is watching the price enough?👇
(The above is educational information from public data, not investment advice; DYOR)
#GEMI
Token: GEMIon | Underlying: GEMI | Coefficient: 1
On-chain price: $4.67 (24h -8.17%)
US stock underlying: $4.67
Premium / Discount: +0.00% (vs underlying fair value) (Underlying market closed; pricing uses the most recent close)
52-week range: $3.38 - $26.75
Number of holding addresses: 111
Underlying status: closed (Weekend or Holiday)
Why monitor the premium: The token can be traded 24/7, while the underlying US stock only provides quotes during US Eastern Time market hours.
During market-closed periods, the premium is easiest to widen—either due to on-chain accumulation or due to redemption / halt expectations building up.
Abnormal premium jumps often reveal sentiment and arbitrage gaps earlier than the price itself.
Do you think premium monitoring is more useful, or is watching the price enough?👇
(The above is educational information from public data, not investment advice; DYOR)
#GEMI
34
·
--
$GEMI / Tokenized Stocks — look at the on-chain official data, not the headlines.
Token: GEMIon | Underlying stock: GEMI
On-chain price: $5.65 (24h +0.47%)
Number of holding addresses: 108 | US stock market cap: $731,914,815
P/E ratio: - | Dividend yield: -
52-week range: $3.38 - $26.75
Status: postmarket
My take: Tokenized stocks wrap real stocks onto the blockchain. As long as the custody certificates are updated in time, the on-chain price should have only a small premium/discount versus the underlying — that’s exactly the point of this structure. I’ll be watching whether the on-chain price keeps up with the stock.
Are you bullish on tokenized stocks, or do you think it’s still just hype? 👇
#GEMI
$GEMI / Tokenized Stocks — look at the on-chain official data, not the headlines.
Token: GEMIon | Underlying stock: GEMI
On-chain price: $5.65 (24h +0.47%)
Number of holding addresses: 108 | US stock market cap: $731,914,815
P/E ratio: - | Dividend yield: -
52-week range: $3.38 - $26.75
Status: postmarket
My take: Tokenized stocks wrap real stocks onto the blockchain. As long as the custody certificates are updated in time, the on-chain price should have only a small premium/discount versus the underlying — that’s exactly the point of this structure. I’ll be watching whether the on-chain price keeps up with the stock.
Are you bullish on tokenized stocks, or do you think it’s still just hype? 👇
#GEMI
Token: GEMIon | Underlying stock: GEMI
On-chain price: $5.65 (24h +0.47%)
Number of holding addresses: 108 | US stock market cap: $731,914,815
P/E ratio: - | Dividend yield: -
52-week range: $3.38 - $26.75
Status: postmarket
My take: Tokenized stocks wrap real stocks onto the blockchain. As long as the custody certificates are updated in time, the on-chain price should have only a small premium/discount versus the underlying — that’s exactly the point of this structure. I’ll be watching whether the on-chain price keeps up with the stock.
Are you bullish on tokenized stocks, or do you think it’s still just hype? 👇
#GEMI

·
--
See translation
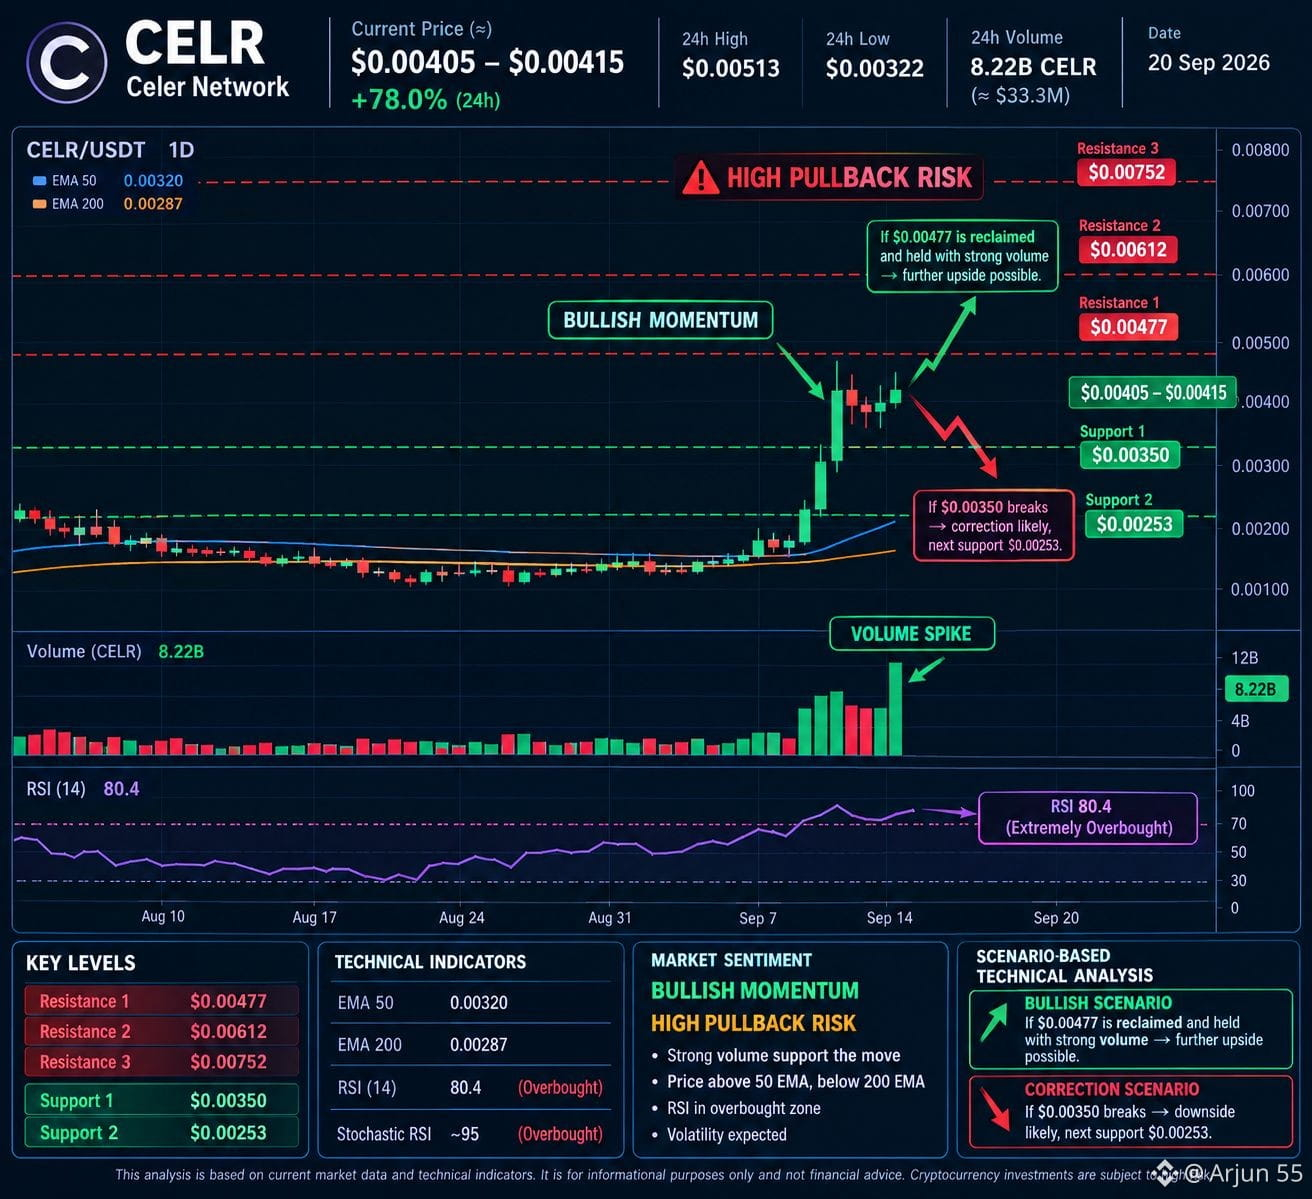
$CELR CELR (Celer Network) — short analysis
As of 20 Sep 2026, CELR has shown a very sharp short-term move. Recent Binance data had CELR around $0.00229 on Sep 19, after rising from about $0.00204 on Sep 16; volume also increased substantially.
Short-term trend: Bullish, but high pullback risk
Current zone: ~$0.0023
Resistance: ~$0.00236–$0.00240
Support: ~$0.00214, then ~$0.00199
Volume: Strong — recent volume expansion supports the move, but can also accompany profit-taking.
Technical picture: RSI around 57.6 is not extremely overbought, while Stochastic RSI is overbought; price is above the 50-EMA but below the 200-EMA.
My scenario-based view:
If CELR breaks $0.00240 with strong volume, further upside momentum becomes technically possible.
If it fails around $0.00236–$0.00240, a pullback toward $0.00214–$0.00200 becomes possible.
Because the token recently experienced an unusually large move, I would treat the near-term setup as bullish momentum + significant correction risk, rather than assuming a straight rise. Coin Market Cap's current analysis similarly flags elevated pullback risk after the recent surge.
Overall: Near-term bias: UP, but volatile/pullback-prone.
This is a technical scenario, not a certainty or financial advice.
#CELR #GEMI #Saga #CPIWatch
{spot}(CELRUSDT)
{stock_us}(GEMI.US)
{spot}(SAGAUSDT)
$CELR CELR (Celer Network) — short analysis
As of 20 Sep 2026, CELR has shown a very sharp short-term move. Recent Binance data had CELR around $0.00229 on Sep 19, after rising from about $0.00204 on Sep 16; volume also increased substantially.
Short-term trend: Bullish, but high pullback risk
Current zone: ~$0.0023
Resistance: ~$0.00236–$0.00240
Support: ~$0.00214, then ~$0.00199
Volume: Strong — recent volume expansion supports the move, but can also accompany profit-taking.
Technical picture: RSI around 57.6 is not extremely overbought, while Stochastic RSI is overbought; price is above the 50-EMA but below the 200-EMA.
My scenario-based view:
If CELR breaks $0.00240 with strong volume, further upside momentum becomes technically possible.
If it fails around $0.00236–$0.00240, a pullback toward $0.00214–$0.00200 becomes possible.
Because the token recently experienced an unusually large move, I would treat the near-term setup as bullish momentum + significant correction risk, rather than assuming a straight rise. Coin Market Cap's current analysis similarly flags elevated pullback risk after the recent surge.
Overall: Near-term bias: UP, but volatile/pullback-prone.
This is a technical scenario, not a certainty or financial advice.
#CELR #GEMI #Saga #CPIWatch
As of 20 Sep 2026, CELR has shown a very sharp short-term move. Recent Binance data had CELR around $0.00229 on Sep 19, after rising from about $0.00204 on Sep 16; volume also increased substantially.
Short-term trend: Bullish, but high pullback risk
Current zone: ~$0.0023
Resistance: ~$0.00236–$0.00240
Support: ~$0.00214, then ~$0.00199
Volume: Strong — recent volume expansion supports the move, but can also accompany profit-taking.
Technical picture: RSI around 57.6 is not extremely overbought, while Stochastic RSI is overbought; price is above the 50-EMA but below the 200-EMA.
My scenario-based view:
If CELR breaks $0.00240 with strong volume, further upside momentum becomes technically possible.
If it fails around $0.00236–$0.00240, a pullback toward $0.00214–$0.00200 becomes possible.
Because the token recently experienced an unusually large move, I would treat the near-term setup as bullish momentum + significant correction risk, rather than assuming a straight rise. Coin Market Cap's current analysis similarly flags elevated pullback risk after the recent surge.
Overall: Near-term bias: UP, but volatile/pullback-prone.
This is a technical scenario, not a certainty or financial advice.
#CELR #GEMI #Saga #CPIWatch
274
Log in to explore more content
Join global crypto users on Binance Square
⚡️ Get latest and useful information about crypto.
💬 Trusted by the world’s largest crypto exchange.
👍 Discover real insights from verified creators.
Email / Phone number
Trending Topics
1
#WhoWillSucceedJensenHuangatNvidia?
121,639 views
1,416 Discussing
2
#WhatWillDriveCryptoandStocks’NextRebound?
506,875 views
3,293 Discussing
3
#BitcoinActiveSupplyInProfitDropsBelow45%
49,611 views
569 Discussing
4
#KavaSaysAbnormalActivityLimitedToKavaLend
24,653 views
309 Discussing
5
#USSpotXRPETFsSeeLargestWeeklyOutflowIn8Months
19,130 views
265 Discussing
6
#USPPIMissMayEaseBTCPressure
252,587 views
2,172 Discussing
7
#WORPTLetsTouristsConvertCryptoToThaiBaht
6,556 views
78 Discussing
8
#TONStrategyReports$23.97MQ3NetLoss
7,363 views
41 Discussing
9
#PolkadotCommunityApprovesNewStrategyWith97%Vote
23,632 views
275 Discussing
10
#dYdXPlansV9.9UpgradeToShiftUSDCToInjective
18,275 views
227 Discussing