
#futuresdata
futuresdata
523 views
12 Discussing
Hot
Latest

See translation
Recent SHELL futures liquidations were relatively small and mainly involved long positions, according to aggregated trackers. Liquidation data can help identify forced position closures, but reported figures may vary because exchanges do not always provide identical coverage. Small liquidation totals should not be interpreted as evidence of a major squeeze or a confirmed change in market direction.
#Liquidations #FuturesData #SHELL
Recent SHELL futures liquidations were relatively small and mainly involved long positions, according to aggregated trackers. Liquidation data can help identify forced position closures, but reported figures may vary because exchanges do not always provide identical coverage. Small liquidation totals should not be interpreted as evidence of a major squeeze or a confirmed change in market direction.
#Liquidations #FuturesData #SHELL
#Liquidations #FuturesData #SHELL
3
OI and liquidations: Don't look at just one number
The report dated 06/11 recorded SHELL's OI at several million USD, according to third-party derivatives tracking sources.
Some data windows showed liquidations skewed toward Long positions, but the reported value was relatively small.
This is not enough to call it a liquidation cascade. It's important to distinguish between small liquidations and a widespread position-imbalance event.
#SHELL #Liquidations #FuturesData
OI and liquidations: Don't look at just one number
The report dated 06/11 recorded SHELL's OI at several million USD, according to third-party derivatives tracking sources.
Some data windows showed liquidations skewed toward Long positions, but the reported value was relatively small.
This is not enough to call it a liquidation cascade. It's important to distinguish between small liquidations and a widespread position-imbalance event.
#SHELL #Liquidations #FuturesData
The report dated 06/11 recorded SHELL's OI at several million USD, according to third-party derivatives tracking sources.
Some data windows showed liquidations skewed toward Long positions, but the reported value was relatively small.
This is not enough to call it a liquidation cascade. It's important to distinguish between small liquidations and a widespread position-imbalance event.
#SHELL #Liquidations #FuturesData
15
Open Interest doesn't tell you the trend on its own
Binance USDⓈ-M Futures data at the time of review shows SHELL's Open Interest at around 75.19 million tokens, equivalent to a notional value of approximately 1.69 million USDT.
An increase in OI doesn't mean the price is certain to rise. A decrease in OI doesn't automatically confirm a downtrend either.
This indicator should be read alongside price movements and trading volume.
#SHELL #MyShell #FuturesData
Open Interest doesn't tell you the trend on its own
Binance USDⓈ-M Futures data at the time of review shows SHELL's Open Interest at around 75.19 million tokens, equivalent to a notional value of approximately 1.69 million USDT.
An increase in OI doesn't mean the price is certain to rise. A decrease in OI doesn't automatically confirm a downtrend either.
This indicator should be read alongside price movements and trading volume.
#SHELL #MyShell #FuturesData
Binance USDⓈ-M Futures data at the time of review shows SHELL's Open Interest at around 75.19 million tokens, equivalent to a notional value of approximately 1.69 million USDT.
An increase in OI doesn't mean the price is certain to rise. A decrease in OI doesn't automatically confirm a downtrend either.
This indicator should be read alongside price movements and trading volume.
#SHELL #MyShell #FuturesData
70
See translation
$SHELL Mark Price Tracks Close to the Futures Index Price
Data snapshot: October 17, 2026, 14:20 ICT (UTC+7).
Binance USDⓈ-M Futures reported a mark price of approximately $0.02243881 and an index price of $0.02243862. The two values were very close at the time of retrieval.
The mark price is used in futures risk and unrealized-profit calculations, while the index price represents a reference derived from the underlying market data. They serve different purposes even when their values are nearly identical.
These figures are a snapshot and can change with market conditions.
#MarkPrice #IndexPrice #FuturesData
$SHELL Mark Price Tracks Close to the Futures Index Price
Data snapshot: October 17, 2026, 14:20 ICT (UTC+7).
Binance USDⓈ-M Futures reported a mark price of approximately $0.02243881 and an index price of $0.02243862. The two values were very close at the time of retrieval.
The mark price is used in futures risk and unrealized-profit calculations, while the index price represents a reference derived from the underlying market data. They serve different purposes even when their values are nearly identical.
These figures are a snapshot and can change with market conditions.
#MarkPrice #IndexPrice #FuturesData
Data snapshot: October 17, 2026, 14:20 ICT (UTC+7).
Binance USDⓈ-M Futures reported a mark price of approximately $0.02243881 and an index price of $0.02243862. The two values were very close at the time of retrieval.
The mark price is used in futures risk and unrealized-profit calculations, while the index price represents a reference derived from the underlying market data. They serve different purposes even when their values are nearly identical.
These figures are a snapshot and can change with market conditions.
#MarkPrice #IndexPrice #FuturesData

38

See translation
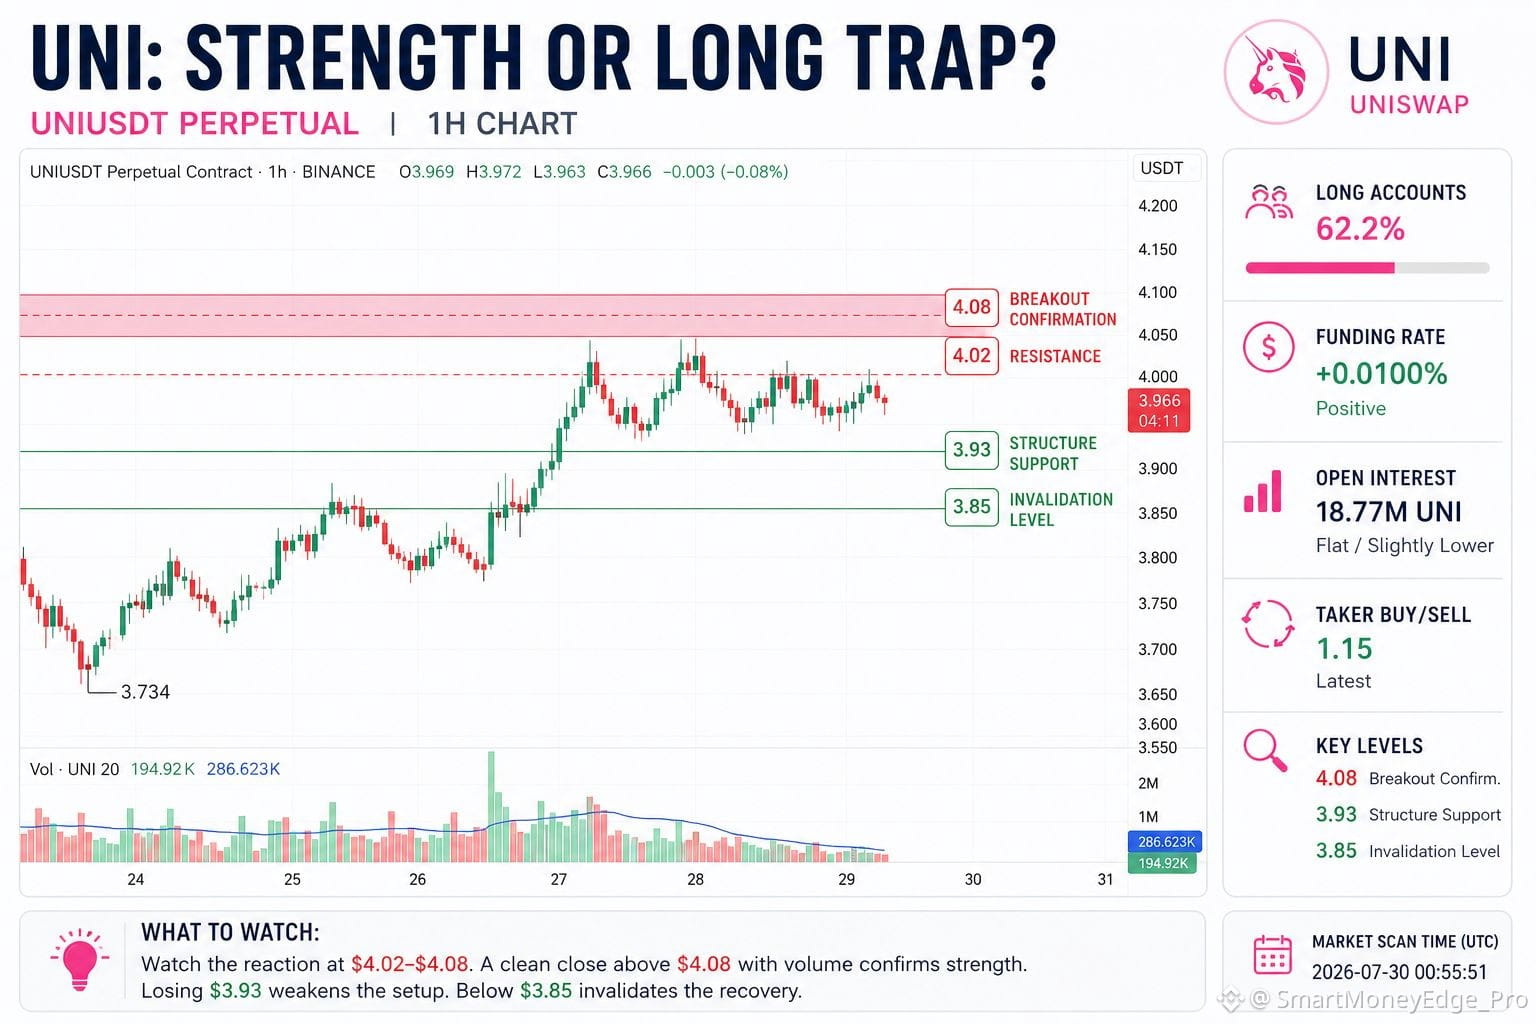
$UNI looks stronger than the market, but the derivatives data is not confirming a clean breakout yet.
Price recovered from $3.74 and continues to hold near $4.00 while BTC remains under pressure.
The issue is positioning.
Around 62% of accounts are long, funding is positive, and open interest has stopped expanding. That leaves UNI vulnerable if buyers cannot clear the $4.02–$4.08 resistance zone.
A strong 1H close above $4.08, supported by fresh volume and rising open interest, would improve the continuation case.
Losing $3.93 would weaken the structure. Below $3.85, the short-term recovery is invalidated.
Watch whether UNI can hold after the next breakout attempt—not just whether it trades above resistance briefly.
Why this matters:
Crowded positioning can create false confidence before price confirms. Waiting for acceptance above resistance reduces the risk of becoming liquidity for a failed breakout.
#UNIUSDT #Uniswap #FuturesData
$UNI looks stronger than the market, but the derivatives data is not confirming a clean breakout yet.
Price recovered from $3.74 and continues to hold near $4.00 while BTC remains under pressure.
The issue is positioning.
Around 62% of accounts are long, funding is positive, and open interest has stopped expanding. That leaves UNI vulnerable if buyers cannot clear the $4.02–$4.08 resistance zone.
A strong 1H close above $4.08, supported by fresh volume and rising open interest, would improve the continuation case.
Losing $3.93 would weaken the structure. Below $3.85, the short-term recovery is invalidated.
Watch whether UNI can hold after the next breakout attempt—not just whether it trades above resistance briefly.
Why this matters:
Crowded positioning can create false confidence before price confirms. Waiting for acceptance above resistance reduces the risk of becoming liquidity for a failed breakout.
#UNIUSDT #Uniswap #FuturesData
Price recovered from $3.74 and continues to hold near $4.00 while BTC remains under pressure.
The issue is positioning.
Around 62% of accounts are long, funding is positive, and open interest has stopped expanding. That leaves UNI vulnerable if buyers cannot clear the $4.02–$4.08 resistance zone.
A strong 1H close above $4.08, supported by fresh volume and rising open interest, would improve the continuation case.
Losing $3.93 would weaken the structure. Below $3.85, the short-term recovery is invalidated.
Watch whether UNI can hold after the next breakout attempt—not just whether it trades above resistance briefly.
Why this matters:
Crowded positioning can create false confidence before price confirms. Waiting for acceptance above resistance reduces the risk of becoming liquidity for a failed breakout.
#UNIUSDT #Uniswap #FuturesData
7
1
6
202

30D trade $BTC 156.1 USDT
See translation
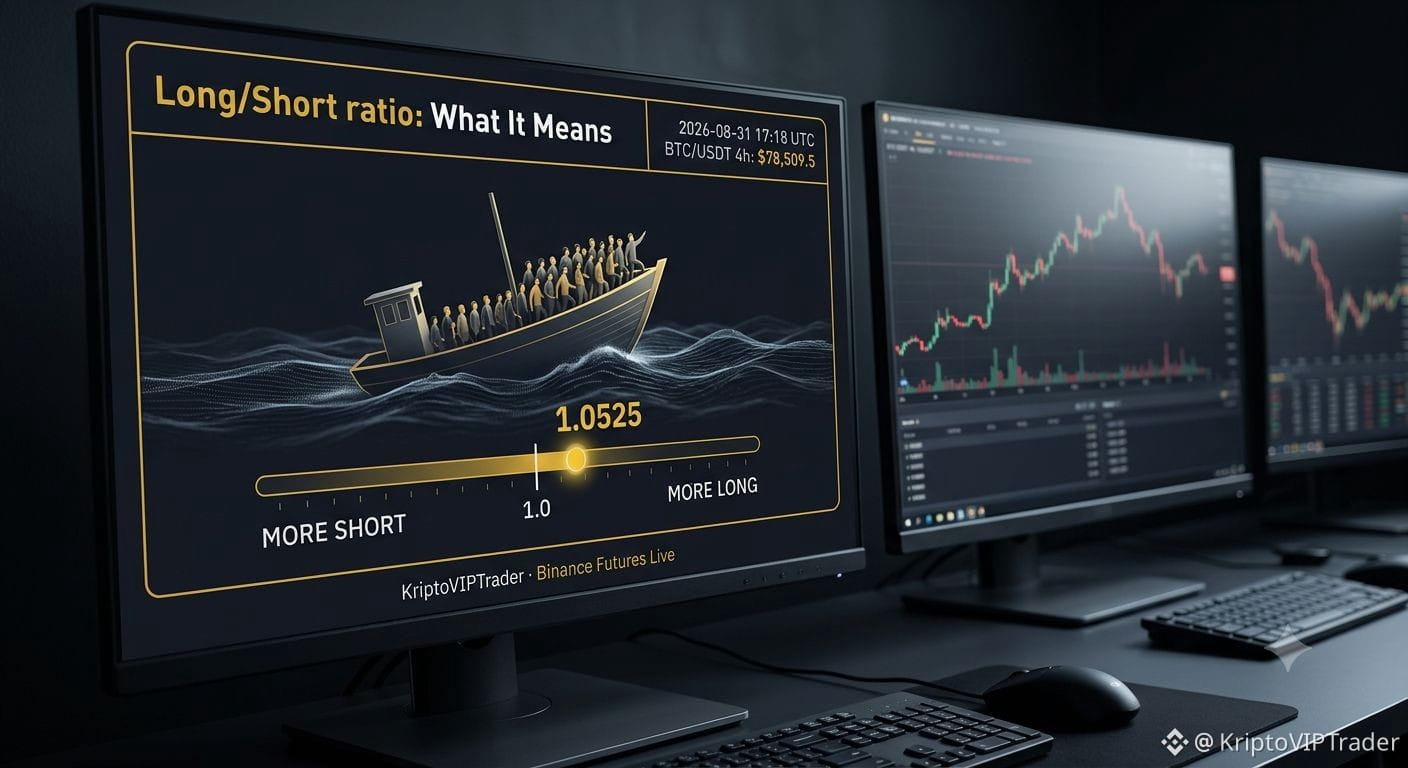
Ever wondered what the 'smart money' is doing? The Long/Short ratio on the 4-hour chart is a great place to start, and right now, it's reading 1.0525.
Here is the straightforward definition: this ratio compares the *number of accounts* holding long positions versus those holding short positions. It counts users, not the total amount of money being traded. Think of it as a headcount of the bulls versus the bears.
A reading of 1.0525 means that, currently, slightly more individual trading accounts are positioned for Bitcoin to rise than fall. This is crucial context right now because while this majority leans long, the BTC price is actually trading at $78,509.5, down -0.57% over the last 24 hours. The crowd is optimistic, but the immediate price action is showing caution.
$BTC
#FuturesData #smartmoney #Write2Earn
{spot}(BTCUSDT)
Ever wondered what the 'smart money' is doing? The Long/Short ratio on the 4-hour chart is a great place to start, and right now, it's reading 1.0525.
Here is the straightforward definition: this ratio compares the *number of accounts* holding long positions versus those holding short positions. It counts users, not the total amount of money being traded. Think of it as a headcount of the bulls versus the bears.
A reading of 1.0525 means that, currently, slightly more individual trading accounts are positioned for Bitcoin to rise than fall. This is crucial context right now because while this majority leans long, the BTC price is actually trading at $78,509.5, down -0.57% over the last 24 hours. The crowd is optimistic, but the immediate price action is showing caution.
$BTC
#FuturesData #smartmoney #Write2Earn
Here is the straightforward definition: this ratio compares the *number of accounts* holding long positions versus those holding short positions. It counts users, not the total amount of money being traded. Think of it as a headcount of the bulls versus the bears.
A reading of 1.0525 means that, currently, slightly more individual trading accounts are positioned for Bitcoin to rise than fall. This is crucial context right now because while this majority leans long, the BTC price is actually trading at $78,509.5, down -0.57% over the last 24 hours. The crowd is optimistic, but the immediate price action is showing caution.
$BTC
#FuturesData #smartmoney #Write2Earn
61
Log in to explore more content
Join global crypto users on Binance Square
⚡️ Get latest and useful information about crypto.
💬 Trusted by the world’s largest crypto exchange.
👍 Discover real insights from verified creators.
Email / Phone number
Trending Topics
1
#HuangRisksOusterOverReportedAffairWithSubordinate
18,138 views
334 Discussing
2
#AnthropicRejectsIPODelayValuationinQuestion
453,695 views
3,824 Discussing
3
#CoreWeaveJumps10%On168%RevenueGrowth
57,288 views
811 Discussing
4
#ZcashFallsBelow$1000ForFirstTimeSinceSeptember
30,595 views
175 Discussing
5
#CanNvidiaEarningsEaseMarketConcerns?
164,365 views
1,755 Discussing
6
#PythAddsNYSERealTimeDataToMarketplace
0 views
4 Discussing
7
#SolanaCompanyReports$3.4MQ3Revenue
605 views
21 Discussing
8
#StrategyMetaplanetLoseMSCIIndexMembership
5,872 views
90 Discussing
9
#tZEROWinsCFTCApprovalForRegulatedDerivativesExchange
540 views
10 Discussing
10
#TradFiForBeginners
480,217 views
3,209 Discussing