

#btcanalysis
btcanalysis
2.1M views
4,922 Discussing
Hot
Latest

·
--
See translation
$BTC ($BTC ) — Today’s Market Update 📊
Bitcoin is currently trading around the $82K area after facing strong selling pressure over the past few sessions. The market is looking a little weak in the short term, but volatility is creating important opportunities for traders who stay patient and disciplined.
BTC is currently holding near the $81K–$82K zone, which is an important area to watch. If buyers manage to defend this support and BTC starts moving back above $84K, we could see a recovery toward the $86K–$87K resistance area. On the other hand, a clear break below $81K could bring additional downside pressure.
For me, the most important thing right now is not to chase the market. Wait for confirmation, watch volume and price action, and always manage your risk.
Bitcoin can change direction quickly. Stay calm, stay patient, and let the market show the next move. 🚀📉
#IMFSaysTokenizedMarketsSmall #BTC #Crypto #BTCAnalysis #CryptoTrading
$BTC ($BTC ) — Today’s Market Update 📊
Bitcoin is currently trading around the $82K area after facing strong selling pressure over the past few sessions. The market is looking a little weak in the short term, but volatility is creating important opportunities for traders who stay patient and disciplined.
BTC is currently holding near the $81K–$82K zone, which is an important area to watch. If buyers manage to defend this support and BTC starts moving back above $84K, we could see a recovery toward the $86K–$87K resistance area. On the other hand, a clear break below $81K could bring additional downside pressure.
For me, the most important thing right now is not to chase the market. Wait for confirmation, watch volume and price action, and always manage your risk.
Bitcoin can change direction quickly. Stay calm, stay patient, and let the market show the next move. 🚀📉
#IMFSaysTokenizedMarketsSmall #BTC #Crypto #BTCAnalysis #CryptoTrading
Bitcoin is currently trading around the $82K area after facing strong selling pressure over the past few sessions. The market is looking a little weak in the short term, but volatility is creating important opportunities for traders who stay patient and disciplined.
BTC is currently holding near the $81K–$82K zone, which is an important area to watch. If buyers manage to defend this support and BTC starts moving back above $84K, we could see a recovery toward the $86K–$87K resistance area. On the other hand, a clear break below $81K could bring additional downside pressure.
For me, the most important thing right now is not to chase the market. Wait for confirmation, watch volume and price action, and always manage your risk.
Bitcoin can change direction quickly. Stay calm, stay patient, and let the market show the next move. 🚀📉
#IMFSaysTokenizedMarketsSmall #BTC #Crypto #BTCAnalysis #CryptoTrading
89

See translation
🔥 $BTC ONE MORE SHAKEOUT BEFORE THE NEXT BIG MOVE?
Bitcoin keeps getting rejected around the $87K resistance, and that’s the level I’m watching closely.
📉 My reasoning: • Repeated rejection near $87K shows sellers are still active.
• Previous cycles had major corrections before the next breakout phase.
• The chart is showing a similar pattern of ATH → deep correction → accumulation → new expansion.
• If BTC loses the key support zones, a deeper flush could happen before the real reversal.
🎯 My scenario:
$82K → $73K → $70K → $65K → 🚀 Breakout
I’m not saying this must happen — this is my current market scenario. If BTC holds strength and breaks the major resistance instead, the bearish path can be invalidated.
Don’t FOMO. Watch the levels, manage risk, and let price confirm the direction. 🧠📊
#BTC #Bitcoin #Crypto #BitcoinPrediction #CryptoTrading #BTCAnalysis
🔥 $BTC ONE MORE SHAKEOUT BEFORE THE NEXT BIG MOVE?
Bitcoin keeps getting rejected around the $87K resistance, and that’s the level I’m watching closely.
📉 My reasoning: • Repeated rejection near $87K shows sellers are still active.
• Previous cycles had major corrections before the next breakout phase.
• The chart is showing a similar pattern of ATH → deep correction → accumulation → new expansion.
• If BTC loses the key support zones, a deeper flush could happen before the real reversal.
🎯 My scenario:
$82K → $73K → $70K → $65K → 🚀 Breakout
I’m not saying this must happen — this is my current market scenario. If BTC holds strength and breaks the major resistance instead, the bearish path can be invalidated.
Don’t FOMO. Watch the levels, manage risk, and let price confirm the direction. 🧠📊
#BTC #Bitcoin #Crypto #BitcoinPrediction #CryptoTrading #BTCAnalysis
Bitcoin keeps getting rejected around the $87K resistance, and that’s the level I’m watching closely.
📉 My reasoning: • Repeated rejection near $87K shows sellers are still active.
• Previous cycles had major corrections before the next breakout phase.
• The chart is showing a similar pattern of ATH → deep correction → accumulation → new expansion.
• If BTC loses the key support zones, a deeper flush could happen before the real reversal.
🎯 My scenario:
$82K → $73K → $70K → $65K → 🚀 Breakout
I’m not saying this must happen — this is my current market scenario. If BTC holds strength and breaks the major resistance instead, the bearish path can be invalidated.
Don’t FOMO. Watch the levels, manage risk, and let price confirm the direction. 🧠📊
#BTC #Bitcoin #Crypto #BitcoinPrediction #CryptoTrading #BTCAnalysis
CryptoBeast CB
·
--
🚨 $BTC PAY ATTENTION! THE FINAL SHAKEOUT MAY NOT BE OVER
Bitcoin is still struggling to break and hold above $87K. Every rejection from this zone tells us sellers are defending the level aggressively.
📉 Why I’m watching the downside first:
• $87K remains a major resistance
• Repeated rejection can trigger another liquidity flush
• The current cycle structure still allows a deeper correction
• Historically, Bitcoin has seen major shakeouts before powerful expansions
🎯 My current roadmap:
$82K → $73K → $70K → $65K → 🚀 BREAKOUT
If BTC sweeps the lower levels and starts reclaiming them with strong volume, that could become the setup for the next major bullish leg.
This is a scenario, not a guarantee. Don’t blindly short or long let BTC confirm the move.
🧠 Patience > FOMO.
#BTC #Bitcoin #Crypto #BTCAnalysis #CryptoTrading #BitcoinPrediction #Uptober
Bitcoin is still struggling to break and hold above $87K. Every rejection from this zone tells us sellers are defending the level aggressively.
📉 Why I’m watching the downside first:
• $87K remains a major resistance
• Repeated rejection can trigger another liquidity flush
• The current cycle structure still allows a deeper correction
• Historically, Bitcoin has seen major shakeouts before powerful expansions
🎯 My current roadmap:
$82K → $73K → $70K → $65K → 🚀 BREAKOUT
If BTC sweeps the lower levels and starts reclaiming them with strong volume, that could become the setup for the next major bullish leg.
This is a scenario, not a guarantee. Don’t blindly short or long let BTC confirm the move.
🧠 Patience > FOMO.
#BTC #Bitcoin #Crypto #BTCAnalysis #CryptoTrading #BitcoinPrediction #Uptober
1
3

Article
See translation
Bitcoin Loses $82.8K: Is $81K Next—or Will Bulls Spring a Bear Trap?$BTC
{future}(BTCUSDT)
Bitcoin Market Outlook | October 8, 2026
Bitcoin is testing a critical area after retreating from the upper boundary of its recent trading range. The latest supplied Binance BTC/USDT perpetual chart shows BTC near $82,545, slightly below the important $82,822 support level.
The question now is whether sellers can turn that level into resistance—or whether buyers can reclaim it and trap late shorts.
My current outlook is cautiously bearish below $82,822–$83,000. However, a confirmed recovery above this area would change the immediate trading picture.
What is the daily chart telling us?
Bitcoin previously advanced inside an ascending channel before consolidating between approximately $82,822 and $86,606.
Recent candles show rejection from the upper part of that range, followed by a move back toward its lower boundary. Price now appears below the projected lower edge of the rising channel and marginally below horizontal support.
That combination suggests weakening momentum. However, the current daily candle is still open. An intraday move below support is a warning—not yet confirmation of a daily breakdown.
A daily close below $82,822, followed by a failed reclaim, would strengthen the bearish case. A recovery back inside the range would raise the possibility of a false breakdown.
Momentum: buyers are losing strength
Daily RSI is around 50 on the supplied chart, showing that the earlier bullish momentum has cooled toward neutral.
The earlier monitoring snapshot recorded BTC perpetual RSI near 33 on the four-hour timeframe and 42 on the hourly timeframe. Those readings suggest short-term weakness, although they are from an earlier snapshot and should not be treated as simultaneous live readings.
This creates a tricky environment: the market looks vulnerable, but a relief bounce remains possible. Selling after an extended red candle can produce a poor entry even when the broader directional view is correct.
What does the broader monitoring data suggest?
The supplied monitoring sheet records rising dollar strength, higher US Treasury yields and rising USDT dominance. Together, these observations are consistent with a cautious environment for crypto.
It also lists approximately $487 million in daily net Bitcoin spot ETF outflows. The underlying ETF reporting session is not specified, so this should be treated as background from the monitoring snapshot—not a verified October 8 session total.
One distinction matters: a decline in total crypto market capitalization is not the same as an equivalent amount of cash leaving the market. Market capitalization changes with asset prices.
The sheet also records declining open interest and positive funding. Declining open interest can reflect positions closing; it does not guarantee lower volatility. Positive funding means longs pay shorts, and is not, by itself, a short-entry signal.
The price levels that matter
• $82,822–$83,000: Immediate reclaim zone and the main decision area.
• $84,187–$84,218: Potential upside reaction area identified in the monitoring snapshot.
• $84,609: Another upside reference if the recovery extends.
• $86,606: Major resistance at the upper boundary of the recent range.
• $87,200: Higher resistance if buyers reclaim the range convincingly.
On the downside:
• $82,150–$82,000: Immediate watch zone, combining the chart’s intraday low with the snapshot’s approximately $82,064 liquidity reference.
• $81,724: Additional downside liquidity reference from the monitoring sheet.
• $80,963: The next major horizontal chart support.
• $79,719: Lower support if $80,963 fails.
• $78,727–$78,234: A deeper support area if selling accelerates.
Liquidity estimates can change quickly. They are areas to monitor, not guaranteed destinations.
Conditional trade signal 1: Short a failed reclaim
The bearish setup requires price to bounce into broken support and show rejection.
Entry zone: $82,800–$83,000
Stop-loss: $83,500
Target 1: $82,100
Target 2: $81,750
Target 3: $81,000
Extended target: $79,750
Activation: Wait for a retest of the entry zone, followed by a 15-minute or one-hour rejection candle closing back below $82,822. A lower high would provide additional confirmation.
Using an illustrative entry of $82,900, the risk to the stop is $600 per BTC. The approximate reward-to-risk ratios are 1.3:1 at Target 1, 1.9:1 at Target 2 and 3.2:1 at Target 3, before fees and slippage.
If BTC falls straight toward $82,100 without offering the retest, do not chase the original entry. The setup needs to be reassessed.
Conditional trade signal 2: Long a confirmed recovery
A bullish recovery becomes more credible if Bitcoin reclaims the lost range floor and holds above it.
Entry zone: $82,950–$83,100
Stop-loss: $82,450
Target 1: $84,150
Target 2: $84,600
Target 3: $86,500
Activation: Wait for a one-hour close above $83,000, followed by a successful retest of the $82,822–$83,000 area. Enter only if buyers defend that zone and price returns to the entry area.
Using an illustrative entry of $83,000, the risk to the stop is $550 per BTC. The approximate reward-to-risk ratios are 2.1:1 at Target 1 and 2.9:1 at Target 2, before costs.
The final target is a stretch objective that requires sustained buying and may take longer than the current session.
These are alternative scenarios. Neither setup is active solely because price touches an entry level.
How I would manage the risk
Keep planned risk small—for example, 0.5% of account equity per trade—and calculate position size from the distance between entry and stop-loss.
Consider partial profit-taking at the first target, then adjust the remaining stop according to confirmed price structure. Never widen the stop simply to avoid accepting a loss.
Leverage does not improve the setup. Excessive leverage can turn an ordinary price fluctuation into liquidation, and stop orders can experience slippage.
My outlook for Bitcoin’s next move
As long as BTC remains below $82,822–$83,000, I favor watching for a test of $82,100–$82,000. If that area breaks and a retest fails, $81,724 and $80,963 become the next downside references.
If Bitcoin reclaims $83,000 and holds it, the immediate bearish view weakens. That would put $84,187–$84,218 back in focus, followed by $84,609.
The key today is the reaction around the broken range floor. A rejection supports continuation lower; a successful reclaim supports a recovery.
Educational market analysis only. These are conditional trade plans, not guaranteed outcomes. Check current prices and confirmation before trading.
#bitcoin #BTCanalysis #CryptoTradingInsights #BTCUSDTAnalysis #muhammadranarizwan
Bitcoin Loses $82.8K: Is $81K Next—or Will Bulls Spring a Bear Trap?
$BTC
Bitcoin Market Outlook | October 8, 2026
Bitcoin is testing a critical area after retreating from the upper boundary of its recent trading range. The latest supplied Binance BTC/USDT perpetual chart shows BTC near $82,545, slightly below the important $82,822 support level.
The question now is whether sellers can turn that level into resistance—or whether buyers can reclaim it and trap late shorts.
My current outlook is cautiously bearish below $82,822–$83,000. However, a confirmed recovery above this area would change the immediate trading picture.
What is the daily chart telling us?
Bitcoin previously advanced inside an ascending channel before consolidating between approximately $82,822 and $86,606.
Recent candles show rejection from the upper part of that range, followed by a move back toward its lower boundary. Price now appears below the projected lower edge of the rising channel and marginally below horizontal support.
That combination suggests weakening momentum. However, the current daily candle is still open. An intraday move below support is a warning—not yet confirmation of a daily breakdown.
A daily close below $82,822, followed by a failed reclaim, would strengthen the bearish case. A recovery back inside the range would raise the possibility of a false breakdown.
Momentum: buyers are losing strength
Daily RSI is around 50 on the supplied chart, showing that the earlier bullish momentum has cooled toward neutral.
The earlier monitoring snapshot recorded BTC perpetual RSI near 33 on the four-hour timeframe and 42 on the hourly timeframe. Those readings suggest short-term weakness, although they are from an earlier snapshot and should not be treated as simultaneous live readings.
This creates a tricky environment: the market looks vulnerable, but a relief bounce remains possible. Selling after an extended red candle can produce a poor entry even when the broader directional view is correct.
What does the broader monitoring data suggest?
The supplied monitoring sheet records rising dollar strength, higher US Treasury yields and rising USDT dominance. Together, these observations are consistent with a cautious environment for crypto.
It also lists approximately $487 million in daily net Bitcoin spot ETF outflows. The underlying ETF reporting session is not specified, so this should be treated as background from the monitoring snapshot—not a verified October 8 session total.
One distinction matters: a decline in total crypto market capitalization is not the same as an equivalent amount of cash leaving the market. Market capitalization changes with asset prices.
The sheet also records declining open interest and positive funding. Declining open interest can reflect positions closing; it does not guarantee lower volatility. Positive funding means longs pay shorts, and is not, by itself, a short-entry signal.
The price levels that matter
• $82,822–$83,000: Immediate reclaim zone and the main decision area.
• $84,187–$84,218: Potential upside reaction area identified in the monitoring snapshot.
• $84,609: Another upside reference if the recovery extends.
• $86,606: Major resistance at the upper boundary of the recent range.
• $87,200: Higher resistance if buyers reclaim the range convincingly.
On the downside:
• $82,150–$82,000: Immediate watch zone, combining the chart’s intraday low with the snapshot’s approximately $82,064 liquidity reference.
• $81,724: Additional downside liquidity reference from the monitoring sheet.
• $80,963: The next major horizontal chart support.
• $79,719: Lower support if $80,963 fails.
• $78,727–$78,234: A deeper support area if selling accelerates.
Liquidity estimates can change quickly. They are areas to monitor, not guaranteed destinations.
Conditional trade signal 1: Short a failed reclaim
The bearish setup requires price to bounce into broken support and show rejection.
Entry zone: $82,800–$83,000
Stop-loss: $83,500
Target 1: $82,100
Target 2: $81,750
Target 3: $81,000
Extended target: $79,750
Activation: Wait for a retest of the entry zone, followed by a 15-minute or one-hour rejection candle closing back below $82,822. A lower high would provide additional confirmation.
Using an illustrative entry of $82,900, the risk to the stop is $600 per BTC. The approximate reward-to-risk ratios are 1.3:1 at Target 1, 1.9:1 at Target 2 and 3.2:1 at Target 3, before fees and slippage.
If BTC falls straight toward $82,100 without offering the retest, do not chase the original entry. The setup needs to be reassessed.
Conditional trade signal 2: Long a confirmed recovery
A bullish recovery becomes more credible if Bitcoin reclaims the lost range floor and holds above it.
Entry zone: $82,950–$83,100
Stop-loss: $82,450
Target 1: $84,150
Target 2: $84,600
Target 3: $86,500
Activation: Wait for a one-hour close above $83,000, followed by a successful retest of the $82,822–$83,000 area. Enter only if buyers defend that zone and price returns to the entry area.
Using an illustrative entry of $83,000, the risk to the stop is $550 per BTC. The approximate reward-to-risk ratios are 2.1:1 at Target 1 and 2.9:1 at Target 2, before costs.
The final target is a stretch objective that requires sustained buying and may take longer than the current session.
These are alternative scenarios. Neither setup is active solely because price touches an entry level.
How I would manage the risk
Keep planned risk small—for example, 0.5% of account equity per trade—and calculate position size from the distance between entry and stop-loss.
Consider partial profit-taking at the first target, then adjust the remaining stop according to confirmed price structure. Never widen the stop simply to avoid accepting a loss.
Leverage does not improve the setup. Excessive leverage can turn an ordinary price fluctuation into liquidation, and stop orders can experience slippage.
My outlook for Bitcoin’s next move
As long as BTC remains below $82,822–$83,000, I favor watching for a test of $82,100–$82,000. If that area breaks and a retest fails, $81,724 and $80,963 become the next downside references.
If Bitcoin reclaims $83,000 and holds it, the immediate bearish view weakens. That would put $84,187–$84,218 back in focus, followed by $84,609.
The key today is the reaction around the broken range floor. A rejection supports continuation lower; a successful reclaim supports a recovery.
Educational market analysis only. These are conditional trade plans, not guaranteed outcomes. Check current prices and confirmation before trading.
#bitcoin #BTCanalysis #CryptoTradingInsights #BTCUSDTAnalysis #muhammadranarizwan
Bitcoin Market Outlook | October 8, 2026
Bitcoin is testing a critical area after retreating from the upper boundary of its recent trading range. The latest supplied Binance BTC/USDT perpetual chart shows BTC near $82,545, slightly below the important $82,822 support level.
The question now is whether sellers can turn that level into resistance—or whether buyers can reclaim it and trap late shorts.
My current outlook is cautiously bearish below $82,822–$83,000. However, a confirmed recovery above this area would change the immediate trading picture.
What is the daily chart telling us?
Bitcoin previously advanced inside an ascending channel before consolidating between approximately $82,822 and $86,606.
Recent candles show rejection from the upper part of that range, followed by a move back toward its lower boundary. Price now appears below the projected lower edge of the rising channel and marginally below horizontal support.
That combination suggests weakening momentum. However, the current daily candle is still open. An intraday move below support is a warning—not yet confirmation of a daily breakdown.
A daily close below $82,822, followed by a failed reclaim, would strengthen the bearish case. A recovery back inside the range would raise the possibility of a false breakdown.
Momentum: buyers are losing strength
Daily RSI is around 50 on the supplied chart, showing that the earlier bullish momentum has cooled toward neutral.
The earlier monitoring snapshot recorded BTC perpetual RSI near 33 on the four-hour timeframe and 42 on the hourly timeframe. Those readings suggest short-term weakness, although they are from an earlier snapshot and should not be treated as simultaneous live readings.
This creates a tricky environment: the market looks vulnerable, but a relief bounce remains possible. Selling after an extended red candle can produce a poor entry even when the broader directional view is correct.
What does the broader monitoring data suggest?
The supplied monitoring sheet records rising dollar strength, higher US Treasury yields and rising USDT dominance. Together, these observations are consistent with a cautious environment for crypto.
It also lists approximately $487 million in daily net Bitcoin spot ETF outflows. The underlying ETF reporting session is not specified, so this should be treated as background from the monitoring snapshot—not a verified October 8 session total.
One distinction matters: a decline in total crypto market capitalization is not the same as an equivalent amount of cash leaving the market. Market capitalization changes with asset prices.
The sheet also records declining open interest and positive funding. Declining open interest can reflect positions closing; it does not guarantee lower volatility. Positive funding means longs pay shorts, and is not, by itself, a short-entry signal.
The price levels that matter
• $82,822–$83,000: Immediate reclaim zone and the main decision area.
• $84,187–$84,218: Potential upside reaction area identified in the monitoring snapshot.
• $84,609: Another upside reference if the recovery extends.
• $86,606: Major resistance at the upper boundary of the recent range.
• $87,200: Higher resistance if buyers reclaim the range convincingly.
On the downside:
• $82,150–$82,000: Immediate watch zone, combining the chart’s intraday low with the snapshot’s approximately $82,064 liquidity reference.
• $81,724: Additional downside liquidity reference from the monitoring sheet.
• $80,963: The next major horizontal chart support.
• $79,719: Lower support if $80,963 fails.
• $78,727–$78,234: A deeper support area if selling accelerates.
Liquidity estimates can change quickly. They are areas to monitor, not guaranteed destinations.
Conditional trade signal 1: Short a failed reclaim
The bearish setup requires price to bounce into broken support and show rejection.
Entry zone: $82,800–$83,000
Stop-loss: $83,500
Target 1: $82,100
Target 2: $81,750
Target 3: $81,000
Extended target: $79,750
Activation: Wait for a retest of the entry zone, followed by a 15-minute or one-hour rejection candle closing back below $82,822. A lower high would provide additional confirmation.
Using an illustrative entry of $82,900, the risk to the stop is $600 per BTC. The approximate reward-to-risk ratios are 1.3:1 at Target 1, 1.9:1 at Target 2 and 3.2:1 at Target 3, before fees and slippage.
If BTC falls straight toward $82,100 without offering the retest, do not chase the original entry. The setup needs to be reassessed.
Conditional trade signal 2: Long a confirmed recovery
A bullish recovery becomes more credible if Bitcoin reclaims the lost range floor and holds above it.
Entry zone: $82,950–$83,100
Stop-loss: $82,450
Target 1: $84,150
Target 2: $84,600
Target 3: $86,500
Activation: Wait for a one-hour close above $83,000, followed by a successful retest of the $82,822–$83,000 area. Enter only if buyers defend that zone and price returns to the entry area.
Using an illustrative entry of $83,000, the risk to the stop is $550 per BTC. The approximate reward-to-risk ratios are 2.1:1 at Target 1 and 2.9:1 at Target 2, before costs.
The final target is a stretch objective that requires sustained buying and may take longer than the current session.
These are alternative scenarios. Neither setup is active solely because price touches an entry level.
How I would manage the risk
Keep planned risk small—for example, 0.5% of account equity per trade—and calculate position size from the distance between entry and stop-loss.
Consider partial profit-taking at the first target, then adjust the remaining stop according to confirmed price structure. Never widen the stop simply to avoid accepting a loss.
Leverage does not improve the setup. Excessive leverage can turn an ordinary price fluctuation into liquidation, and stop orders can experience slippage.
My outlook for Bitcoin’s next move
As long as BTC remains below $82,822–$83,000, I favor watching for a test of $82,100–$82,000. If that area breaks and a retest fails, $81,724 and $80,963 become the next downside references.
If Bitcoin reclaims $83,000 and holds it, the immediate bearish view weakens. That would put $84,187–$84,218 back in focus, followed by $84,609.
The key today is the reaction around the broken range floor. A rejection supports continuation lower; a successful reclaim supports a recovery.
Educational market analysis only. These are conditional trade plans, not guaranteed outcomes. Check current prices and confirmation before trading.
#bitcoin #BTCanalysis #CryptoTradingInsights #BTCUSDTAnalysis #muhammadranarizwan
95

Article
See translation
🚨 BTC IS AT A DECISION POINT — THE NEXT MOVE COULD BE BIGBitcoin is entering a zone where patience matters more than prediction.
The market has been caught between two forces: buyers trying to reclaim momentum and sellers defending every major resistance level. That’s why BTC can feel strong one moment and weak the next.
The key level I’m watching is $85K.
🟢 If BTC reclaims $85K and holds above it, short-term sentiment could shift quickly. Buyers may start targeting $87K, and a clean breakout from there could open the door toward $90K.
But there’s still a risk on the downside.
🔴 If BTC keeps getting rejected around $85K, sellers could push price back toward the $82K–$83K support zone. This is the area bulls need to defend if they want to keep the current structure intact.
A strong hold above $82K could simply mean Bitcoin is consolidating before its next major move.
However, a decisive breakdown below that zone could change the short-term picture completely, potentially bringing stronger selling pressure and deeper support levels into focus.
🎯 Levels I’m Watching
🟢 $85K — First bullish confirmation
🚀 $87K — Breakout trigger
🎯 $90K — Next psychological target
🟡 $82K–$83K — Critical support
🔴 Below $82K — Bearish momentum risk
I’m not chasing every green candle, and I’m not panicking over every red candle.
Bitcoin is building pressure.
The longer price remains trapped between these levels, the more important the eventual breakout becomes.
One clean move above resistance could bring FOMO back into the market.
One decisive breakdown could bring fear back.
For now, the smartest move is simple:
Watch the levels. Wait for confirmation. Let BTC choose the direction. ⚡️
{spot}(BTCUSDT)
$BTC #bitcoin #crypto #BinanceSquare #BTCanalysis
🚨 BTC IS AT A DECISION POINT — THE NEXT MOVE COULD BE BIG
Bitcoin is entering a zone where patience matters more than prediction.
The market has been caught between two forces: buyers trying to reclaim momentum and sellers defending every major resistance level. That’s why BTC can feel strong one moment and weak the next.
The key level I’m watching is $85K.
🟢 If BTC reclaims $85K and holds above it, short-term sentiment could shift quickly. Buyers may start targeting $87K, and a clean breakout from there could open the door toward $90K.
But there’s still a risk on the downside.
🔴 If BTC keeps getting rejected around $85K, sellers could push price back toward the $82K–$83K support zone. This is the area bulls need to defend if they want to keep the current structure intact.
A strong hold above $82K could simply mean Bitcoin is consolidating before its next major move.
However, a decisive breakdown below that zone could change the short-term picture completely, potentially bringing stronger selling pressure and deeper support levels into focus.
🎯 Levels I’m Watching
🟢 $85K — First bullish confirmation
🚀 $87K — Breakout trigger
🎯 $90K — Next psychological target
🟡 $82K–$83K — Critical support
🔴 Below $82K — Bearish momentum risk
I’m not chasing every green candle, and I’m not panicking over every red candle.
Bitcoin is building pressure.
The longer price remains trapped between these levels, the more important the eventual breakout becomes.
One clean move above resistance could bring FOMO back into the market.
One decisive breakdown could bring fear back.
For now, the smartest move is simple:
Watch the levels. Wait for confirmation. Let BTC choose the direction. ⚡️
$BTC #bitcoin #crypto #BinanceSquare #BTCanalysis
The market has been caught between two forces: buyers trying to reclaim momentum and sellers defending every major resistance level. That’s why BTC can feel strong one moment and weak the next.
The key level I’m watching is $85K.
🟢 If BTC reclaims $85K and holds above it, short-term sentiment could shift quickly. Buyers may start targeting $87K, and a clean breakout from there could open the door toward $90K.
But there’s still a risk on the downside.
🔴 If BTC keeps getting rejected around $85K, sellers could push price back toward the $82K–$83K support zone. This is the area bulls need to defend if they want to keep the current structure intact.
A strong hold above $82K could simply mean Bitcoin is consolidating before its next major move.
However, a decisive breakdown below that zone could change the short-term picture completely, potentially bringing stronger selling pressure and deeper support levels into focus.
🎯 Levels I’m Watching
🟢 $85K — First bullish confirmation
🚀 $87K — Breakout trigger
🎯 $90K — Next psychological target
🟡 $82K–$83K — Critical support
🔴 Below $82K — Bearish momentum risk
I’m not chasing every green candle, and I’m not panicking over every red candle.
Bitcoin is building pressure.
The longer price remains trapped between these levels, the more important the eventual breakout becomes.
One clean move above resistance could bring FOMO back into the market.
One decisive breakdown could bring fear back.
For now, the smartest move is simple:
Watch the levels. Wait for confirmation. Let BTC choose the direction. ⚡️
$BTC #bitcoin #crypto #BinanceSquare #BTCanalysis
88

Article
See translation
BTC BULLISH 🟢 OR BEARISH 🔴 — WHAT’S NEXT?Bitcoin is currently sitting around the $83K area, and the market is at an important decision point. Recent selling pressure has pushed BTC lower, but the bigger trend still has some bullish signals. 📊
🟢 BULLISH SCENARIO:
If BTC can regain strength and move back above nearby resistance, buyers could regain control. Strong volume and positive market sentiment would make the bullish case stronger.
🔴 BEARISH SCENARIO:
If selling pressure continues and important support breaks, BTC could face another move lower. Macro factors such as rising yields and oil prices are currently adding pressure to risk assets.
👀 WHAT I’M WATCHING:
• BTC support & resistance
• Trading volume
• Market sentiment
• U.S. macro news
• Overall crypto market direction
💭 MY VIEW:
BTC is in a high-volatility zone. I’m watching confirmation instead of assuming the next move.
⚠️ Educational content only. Crypto is highly volatile. Always DYOR.
👇 WHAT DO YOU THINK?
🟢 BULLISH
🔴 BEARISH
#bitcoin #TradingCommunity #BTCAnalysis #CryptoMarket #BitcoinNews
BTC BULLISH 🟢 OR BEARISH 🔴 — WHAT’S NEXT?
Bitcoin is currently sitting around the $83K area, and the market is at an important decision point. Recent selling pressure has pushed BTC lower, but the bigger trend still has some bullish signals. 📊
🟢 BULLISH SCENARIO:
If BTC can regain strength and move back above nearby resistance, buyers could regain control. Strong volume and positive market sentiment would make the bullish case stronger.
🔴 BEARISH SCENARIO:
If selling pressure continues and important support breaks, BTC could face another move lower. Macro factors such as rising yields and oil prices are currently adding pressure to risk assets.
👀 WHAT I’M WATCHING:
• BTC support & resistance
• Trading volume
• Market sentiment
• U.S. macro news
• Overall crypto market direction
💭 MY VIEW:
BTC is in a high-volatility zone. I’m watching confirmation instead of assuming the next move.
⚠️ Educational content only. Crypto is highly volatile. Always DYOR.
👇 WHAT DO YOU THINK?
🟢 BULLISH
🔴 BEARISH
#bitcoin #TradingCommunity #BTCAnalysis #CryptoMarket #BitcoinNews
🟢 BULLISH SCENARIO:
If BTC can regain strength and move back above nearby resistance, buyers could regain control. Strong volume and positive market sentiment would make the bullish case stronger.
🔴 BEARISH SCENARIO:
If selling pressure continues and important support breaks, BTC could face another move lower. Macro factors such as rising yields and oil prices are currently adding pressure to risk assets.
👀 WHAT I’M WATCHING:
• BTC support & resistance
• Trading volume
• Market sentiment
• U.S. macro news
• Overall crypto market direction
💭 MY VIEW:
BTC is in a high-volatility zone. I’m watching confirmation instead of assuming the next move.
⚠️ Educational content only. Crypto is highly volatile. Always DYOR.
👇 WHAT DO YOU THINK?
🟢 BULLISH
🔴 BEARISH
#bitcoin #TradingCommunity #BTCAnalysis #CryptoMarket #BitcoinNews
8

·
--
Bearish
See translation
Bitcoin is showing strong market interest, but volatility remains high.
📈 Holding key support could bring more upside.
📉 Losing support could trigger a deeper correction.
For me, the key is simple: watch the trend, volume, and support levels.
Stay patient. Don’t chase the market. Manage risk.
$BTC remains one of the most important assets to watch in crypto. 🚀
#BTC #Bitcoin #Crypto #BTCAnalysis #cryptotrading
{spot}(BTCUSDT)
Bitcoin is showing strong market interest, but volatility remains high.
📈 Holding key support could bring more upside.
📉 Losing support could trigger a deeper correction.
For me, the key is simple: watch the trend, volume, and support levels.
Stay patient. Don’t chase the market. Manage risk.
$BTC remains one of the most important assets to watch in crypto. 🚀
#BTC #Bitcoin #Crypto #BTCAnalysis #cryptotrading
📈 Holding key support could bring more upside.
📉 Losing support could trigger a deeper correction.
For me, the key is simple: watch the trend, volume, and support levels.
Stay patient. Don’t chase the market. Manage risk.
$BTC remains one of the most important assets to watch in crypto. 🚀
#BTC #Bitcoin #Crypto #BTCAnalysis #cryptotrading
1
107

·
--
Bearish
See translation
🚨 $BTC KEY LEVELS TODAY
Bitcoin is hovering around $83.8K after the sharp sell-off.
{future}(BTCUSDT)
The levels I’m watching:
🔴 Below $83K → risk of another leg down toward $80K
🟢 Reclaim $86.5K–$87K → would show buyers are starting to regain control
For now, I’m not chasing longs.
Let the market show its direction first.
#bitcoin #BTCanalysis #CryptoVolatility #TradingRisk #BuyTheDip
🚨 $BTC KEY LEVELS TODAY
Bitcoin is hovering around $83.8K after the sharp sell-off.
The levels I’m watching:
🔴 Below $83K → risk of another leg down toward $80K
🟢 Reclaim $86.5K–$87K → would show buyers are starting to regain control
For now, I’m not chasing longs.
Let the market show its direction first.
#bitcoin #BTCanalysis #CryptoVolatility #TradingRisk #BuyTheDip
Bitcoin is hovering around $83.8K after the sharp sell-off.
The levels I’m watching:
🔴 Below $83K → risk of another leg down toward $80K
🟢 Reclaim $86.5K–$87K → would show buyers are starting to regain control
For now, I’m not chasing longs.
Let the market show its direction first.
#bitcoin #BTCanalysis #CryptoVolatility #TradingRisk #BuyTheDip
1
73

·
--
Bullish
See translation
$BITCOIN has bounced 47% from its low, but history suggests a moderate drawdown before a rebound can make the rally vulnerable. 📊
$BTC remains interesting, but confirmation is key before expecting another major move higher. 🚀
{future}(BTCUSDT)
#Bitcoin #BTC #Binance #CryptoNewss #BTCanalysis
$BITCOIN has bounced 47% from its low, but history suggests a moderate drawdown before a rebound can make the rally vulnerable. 📊
$BTC remains interesting, but confirmation is key before expecting another major move higher. 🚀
#Bitcoin #BTC #Binance #CryptoNewss #BTCanalysis
$BTC remains interesting, but confirmation is key before expecting another major move higher. 🚀
#Bitcoin #BTC #Binance #CryptoNewss #BTCanalysis
1
72

See translation
$BTC
#BinanceLaunchesBinanceIntelligence #EvernorthXRPTreasuryCompletesSPACMerger #StrategyMarketCapSurpassesRumble
BTC Latest Analysis — 7 Oct 2026
Current trend: BTC is in a short-term pullback/consolidation after recently reaching the $86K–$87K area. Recent data shows BTC around $84K–$85K. �
CoinStats +1
Key levels:
🟢 Support: $83,000–$84,000
🟡 Resistance: $86,500–$87,500
🚀 If BTC breaks and holds above $87,500, bullish momentum could strengthen.
🔻 If it loses $83,000, downside pressure could increase. �
CoinMarketCap +1
Market view: Neutral to slightly bullish, but BTC needs to reclaim the $87K zone for a stronger breakout. ETF flows have become mixed, while macro factors such as U.S. yields and Fed expectations remain important. �
CoinStats +1
🚨 BTC MARKET UPDATE
Bitcoin is currently consolidating around the $84K–$85K zone after facing rejection near $87K. Bulls need a strong break above $87.5K to regain momentum, while $83K remains an important support.
📈 Bullish above $87.5K
⚠️ Bearish below $83K
#Bitcoin #BTC #Crypto #Binance #BTCAnalysis
{spot}(BTCUSDT)
$BTC
#BinanceLaunchesBinanceIntelligence #EvernorthXRPTreasuryCompletesSPACMerger #StrategyMarketCapSurpassesRumble
BTC Latest Analysis — 7 Oct 2026
Current trend: BTC is in a short-term pullback/consolidation after recently reaching the $86K–$87K area. Recent data shows BTC around $84K–$85K. �
CoinStats +1
Key levels:
🟢 Support: $83,000–$84,000
🟡 Resistance: $86,500–$87,500
🚀 If BTC breaks and holds above $87,500, bullish momentum could strengthen.
🔻 If it loses $83,000, downside pressure could increase. �
CoinMarketCap +1
Market view: Neutral to slightly bullish, but BTC needs to reclaim the $87K zone for a stronger breakout. ETF flows have become mixed, while macro factors such as U.S. yields and Fed expectations remain important. �
CoinStats +1
🚨 BTC MARKET UPDATE
Bitcoin is currently consolidating around the $84K–$85K zone after facing rejection near $87K. Bulls need a strong break above $87.5K to regain momentum, while $83K remains an important support.
📈 Bullish above $87.5K
⚠️ Bearish below $83K
#Bitcoin #BTC #Crypto #Binance #BTCAnalysis
#BinanceLaunchesBinanceIntelligence #EvernorthXRPTreasuryCompletesSPACMerger #StrategyMarketCapSurpassesRumble
BTC Latest Analysis — 7 Oct 2026
Current trend: BTC is in a short-term pullback/consolidation after recently reaching the $86K–$87K area. Recent data shows BTC around $84K–$85K. �
CoinStats +1
Key levels:
🟢 Support: $83,000–$84,000
🟡 Resistance: $86,500–$87,500
🚀 If BTC breaks and holds above $87,500, bullish momentum could strengthen.
🔻 If it loses $83,000, downside pressure could increase. �
CoinMarketCap +1
Market view: Neutral to slightly bullish, but BTC needs to reclaim the $87K zone for a stronger breakout. ETF flows have become mixed, while macro factors such as U.S. yields and Fed expectations remain important. �
CoinStats +1
🚨 BTC MARKET UPDATE
Bitcoin is currently consolidating around the $84K–$85K zone after facing rejection near $87K. Bulls need a strong break above $87.5K to regain momentum, while $83K remains an important support.
📈 Bullish above $87.5K
⚠️ Bearish below $83K
#Bitcoin #BTC #Crypto #Binance #BTCAnalysis
88

·
--
See translation
🚨 BTC UPDATE — 12:28 AM ₿
$BITCOIN is holding around $85.4K after another rejection near $87K.
🔥 $87K = BIG BREAKOUT ZONE
🟢 Above $87K → bullish momentum could accelerate
🔴 Below $85K → more downside pressure possible
$BTC is at a decision point… 👀
Breakout or another rejection?
$BITCOIN #BTC☀️ #BinanceSquare #crypto #BitcoinUpdate #BTCAnalysis
🚨 BTC UPDATE — 12:28 AM ₿
$BITCOIN is holding around $85.4K after another rejection near $87K.
🔥 $87K = BIG BREAKOUT ZONE
🟢 Above $87K → bullish momentum could accelerate
🔴 Below $85K → more downside pressure possible
$BTC is at a decision point… 👀
Breakout or another rejection?
$BITCOIN #BTC☀️ #BinanceSquare #crypto #BitcoinUpdate #BTCAnalysis
$BITCOIN is holding around $85.4K after another rejection near $87K.
🔥 $87K = BIG BREAKOUT ZONE
🟢 Above $87K → bullish momentum could accelerate
🔴 Below $85K → more downside pressure possible
$BTC is at a decision point… 👀
Breakout or another rejection?
$BITCOIN #BTC☀️ #BinanceSquare #crypto #BitcoinUpdate #BTCAnalysis
53
Article
See translation
Bitcoin at a Turning Point: $87K Breakout or a Pullback Toward $85K?$BTC
{future}(BTCUSDT)
Bitcoin is approaching a key resistance zone, and its reaction here could shape the next move.
At the October 6 chart snapshot, Binance BTC/USDT perpetuals were trading around $86,241, with daily RSI near 66.04. Buyers retain momentum, but price is still below the marked $86,606 resistance.
My outlook: The broader recovery remains constructive, while the immediate trade depends on whether BTC breaks resistance or rejects it.
The supplied daily chart shows a rising channel following the strong recovery from the August lows. More recently, BTC has consolidated between approximately $82,823 and $86,606. Trading near the top of this range creates an important decision point: buyers need to establish support above resistance to sustain the advance.
RSI above 60 supports positive momentum, but it does not guarantee a breakout. The current daily candle is unfinished, so its volume should not be compared directly with completed daily candles to confirm strength or weakness.
📍 The levels that matter
$86,606: Immediate chart resistance and the first breakout checkpoint.$86,917–$87,170: Potential overhead liquidity area identified in the supplied dashboard.$85,245: First downside liquidity reference.$84,303: Secondary downside liquidity reference.$82,823: Major support at the bottom of the current consolidation.$80,963–$79,719: Deeper chart support if the consolidation breaks down.
Liquidity estimates change quickly. These areas are potential reaction zones, not guaranteed destinations.
The accompanying dashboard reports positive funding and rising open interest. Together, these suggest leveraged positioning deserves attention, but they do not independently establish the next direction. Positive funding can accompany a continuing rally or leave crowded longs vulnerable to a sharp pullback.
The same dashboard lists roughly $89.9 million in daily BTC spot ETF net outflows. Treat that as a supplied dashboard reading whose reporting session needs checking, rather than proof that institutions will sell today.
🟢 Conditional Long Signal — Breakout and Retest
A bullish continuation setup becomes more convincing if BTC clears the overhead resistance and liquidity area.
Trigger: A completed 1-hour candle above $87,200, followed by a successful retest.Potential entry: $87,000–$87,200, only after that area holds as support.Stop-loss: $86,450.Target 1: $88,300.Target 2: $89,500.Target 3: $90,400.
The final target is an approximate measured-move projection: adding the current consolidation’s roughly $3,783 height to its $86,606 ceiling. It is a projection, not an existing confirmed resistance level.
At a $87,100 example entry, the risk-to-reward is approximately 1:1.85 to Target 1 and 1:3.69 to Target 2, before fees and slippage.
🔴 Conditional Short Signal — Failed Breakout
A rejection setup becomes relevant if BTC tests $86,917–$87,170, fails to hold the move, and then closes back below $86,600 on the 1-hour timeframe.
Trigger: That rejection, followed by a failed retest of $86,600 from below.Potential entry: $86,550–$86,650 after the failed retest.Stop-loss: $87,350.Target 1: $85,245.Target 2: $84,303.Target 3: $82,823.
At a $86,600 example entry, risk-to-reward is approximately 1:1.81 to Target 1 and 1:3.06 to Target 2, before costs.
This is a countertrend rejection trade. A sustained breakout above $87,200 would invalidate its premise.
For today, I am watching whether BTC can convert $86,606–$87,200 into support. Success would strengthen the continuation case; rejection would bring $85,245 and $84,303 back into focus. The daily chart supplies the context—lower-timeframe confirmation is still required before either entry.
Both signals are conditional plans, not active market orders. If neither trigger appears, there is no trade. Keep risk small, size positions around the stop-loss, and reassess if price has already moved beyond these levels.
Educational analysis only. No setup guarantees a profit.
#bitcoin #BTCanalysis #CryptoTradingInsights #BinanceSquareTalks #muhammadranarizwan
Bitcoin at a Turning Point: $87K Breakout or a Pullback Toward $85K?
$BTC
Bitcoin is approaching a key resistance zone, and its reaction here could shape the next move.
At the October 6 chart snapshot, Binance BTC/USDT perpetuals were trading around $86,241, with daily RSI near 66.04. Buyers retain momentum, but price is still below the marked $86,606 resistance.
My outlook: The broader recovery remains constructive, while the immediate trade depends on whether BTC breaks resistance or rejects it.
The supplied daily chart shows a rising channel following the strong recovery from the August lows. More recently, BTC has consolidated between approximately $82,823 and $86,606. Trading near the top of this range creates an important decision point: buyers need to establish support above resistance to sustain the advance.
RSI above 60 supports positive momentum, but it does not guarantee a breakout. The current daily candle is unfinished, so its volume should not be compared directly with completed daily candles to confirm strength or weakness.
📍 The levels that matter
$86,606: Immediate chart resistance and the first breakout checkpoint.$86,917–$87,170: Potential overhead liquidity area identified in the supplied dashboard.$85,245: First downside liquidity reference.$84,303: Secondary downside liquidity reference.$82,823: Major support at the bottom of the current consolidation.$80,963–$79,719: Deeper chart support if the consolidation breaks down.
Liquidity estimates change quickly. These areas are potential reaction zones, not guaranteed destinations.
The accompanying dashboard reports positive funding and rising open interest. Together, these suggest leveraged positioning deserves attention, but they do not independently establish the next direction. Positive funding can accompany a continuing rally or leave crowded longs vulnerable to a sharp pullback.
The same dashboard lists roughly $89.9 million in daily BTC spot ETF net outflows. Treat that as a supplied dashboard reading whose reporting session needs checking, rather than proof that institutions will sell today.
🟢 Conditional Long Signal — Breakout and Retest
A bullish continuation setup becomes more convincing if BTC clears the overhead resistance and liquidity area.
Trigger: A completed 1-hour candle above $87,200, followed by a successful retest.Potential entry: $87,000–$87,200, only after that area holds as support.Stop-loss: $86,450.Target 1: $88,300.Target 2: $89,500.Target 3: $90,400.
The final target is an approximate measured-move projection: adding the current consolidation’s roughly $3,783 height to its $86,606 ceiling. It is a projection, not an existing confirmed resistance level.
At a $87,100 example entry, the risk-to-reward is approximately 1:1.85 to Target 1 and 1:3.69 to Target 2, before fees and slippage.
🔴 Conditional Short Signal — Failed Breakout
A rejection setup becomes relevant if BTC tests $86,917–$87,170, fails to hold the move, and then closes back below $86,600 on the 1-hour timeframe.
Trigger: That rejection, followed by a failed retest of $86,600 from below.Potential entry: $86,550–$86,650 after the failed retest.Stop-loss: $87,350.Target 1: $85,245.Target 2: $84,303.Target 3: $82,823.
At a $86,600 example entry, risk-to-reward is approximately 1:1.81 to Target 1 and 1:3.06 to Target 2, before costs.
This is a countertrend rejection trade. A sustained breakout above $87,200 would invalidate its premise.
For today, I am watching whether BTC can convert $86,606–$87,200 into support. Success would strengthen the continuation case; rejection would bring $85,245 and $84,303 back into focus. The daily chart supplies the context—lower-timeframe confirmation is still required before either entry.
Both signals are conditional plans, not active market orders. If neither trigger appears, there is no trade. Keep risk small, size positions around the stop-loss, and reassess if price has already moved beyond these levels.
Educational analysis only. No setup guarantees a profit.
#bitcoin #BTCanalysis #CryptoTradingInsights #BinanceSquareTalks #muhammadranarizwan
Bitcoin is approaching a key resistance zone, and its reaction here could shape the next move.
At the October 6 chart snapshot, Binance BTC/USDT perpetuals were trading around $86,241, with daily RSI near 66.04. Buyers retain momentum, but price is still below the marked $86,606 resistance.
My outlook: The broader recovery remains constructive, while the immediate trade depends on whether BTC breaks resistance or rejects it.
The supplied daily chart shows a rising channel following the strong recovery from the August lows. More recently, BTC has consolidated between approximately $82,823 and $86,606. Trading near the top of this range creates an important decision point: buyers need to establish support above resistance to sustain the advance.
RSI above 60 supports positive momentum, but it does not guarantee a breakout. The current daily candle is unfinished, so its volume should not be compared directly with completed daily candles to confirm strength or weakness.
📍 The levels that matter
$86,606: Immediate chart resistance and the first breakout checkpoint.$86,917–$87,170: Potential overhead liquidity area identified in the supplied dashboard.$85,245: First downside liquidity reference.$84,303: Secondary downside liquidity reference.$82,823: Major support at the bottom of the current consolidation.$80,963–$79,719: Deeper chart support if the consolidation breaks down.
Liquidity estimates change quickly. These areas are potential reaction zones, not guaranteed destinations.
The accompanying dashboard reports positive funding and rising open interest. Together, these suggest leveraged positioning deserves attention, but they do not independently establish the next direction. Positive funding can accompany a continuing rally or leave crowded longs vulnerable to a sharp pullback.
The same dashboard lists roughly $89.9 million in daily BTC spot ETF net outflows. Treat that as a supplied dashboard reading whose reporting session needs checking, rather than proof that institutions will sell today.
🟢 Conditional Long Signal — Breakout and Retest
A bullish continuation setup becomes more convincing if BTC clears the overhead resistance and liquidity area.
Trigger: A completed 1-hour candle above $87,200, followed by a successful retest.Potential entry: $87,000–$87,200, only after that area holds as support.Stop-loss: $86,450.Target 1: $88,300.Target 2: $89,500.Target 3: $90,400.
The final target is an approximate measured-move projection: adding the current consolidation’s roughly $3,783 height to its $86,606 ceiling. It is a projection, not an existing confirmed resistance level.
At a $87,100 example entry, the risk-to-reward is approximately 1:1.85 to Target 1 and 1:3.69 to Target 2, before fees and slippage.
🔴 Conditional Short Signal — Failed Breakout
A rejection setup becomes relevant if BTC tests $86,917–$87,170, fails to hold the move, and then closes back below $86,600 on the 1-hour timeframe.
Trigger: That rejection, followed by a failed retest of $86,600 from below.Potential entry: $86,550–$86,650 after the failed retest.Stop-loss: $87,350.Target 1: $85,245.Target 2: $84,303.Target 3: $82,823.
At a $86,600 example entry, risk-to-reward is approximately 1:1.81 to Target 1 and 1:3.06 to Target 2, before costs.
This is a countertrend rejection trade. A sustained breakout above $87,200 would invalidate its premise.
For today, I am watching whether BTC can convert $86,606–$87,200 into support. Success would strengthen the continuation case; rejection would bring $85,245 and $84,303 back into focus. The daily chart supplies the context—lower-timeframe confirmation is still required before either entry.
Both signals are conditional plans, not active market orders. If neither trigger appears, there is no trade. Keep risk small, size positions around the stop-loss, and reassess if price has already moved beyond these levels.
Educational analysis only. No setup guarantees a profit.
#bitcoin #BTCanalysis #CryptoTradingInsights #BinanceSquareTalks #muhammadranarizwan
68

·
--
Bullish
See translation
Bitcoin Is Stuck at a Critical Level — Here's My BTC Map
$BTC is trading around $86.3K right now, but the important question isn't whether Bitcoin is green or red today.
It's what happens around the $86.5K–$87.5K resistance zone.
📈 Bullish scenario:
A strong daily close above $87.5K with convincing buying volume could open the door toward $90K+.
📉 Bearish scenario:
If BTC repeatedly fails around $87K and loses $84.8K, downside pressure could increase toward the $83K area.
For now, I don't want to chase the middle of the range.
Let BTC confirm the direction first.
Would you rather see a $90K breakout or another dip toward support? 👇
$BTC #Bitcoin #Crypto #BTCAnalysis #BinanceSquare $BTC
{spot}(BTCUSDT)
Bitcoin Is Stuck at a Critical Level — Here's My BTC Map
$BTC is trading around $86.3K right now, but the important question isn't whether Bitcoin is green or red today.
It's what happens around the $86.5K–$87.5K resistance zone.
📈 Bullish scenario:
A strong daily close above $87.5K with convincing buying volume could open the door toward $90K+.
📉 Bearish scenario:
If BTC repeatedly fails around $87K and loses $84.8K, downside pressure could increase toward the $83K area.
For now, I don't want to chase the middle of the range.
Let BTC confirm the direction first.
Would you rather see a $90K breakout or another dip toward support? 👇
$BTC #Bitcoin #Crypto #BTCAnalysis #BinanceSquare $BTC
$BTC is trading around $86.3K right now, but the important question isn't whether Bitcoin is green or red today.
It's what happens around the $86.5K–$87.5K resistance zone.
📈 Bullish scenario:
A strong daily close above $87.5K with convincing buying volume could open the door toward $90K+.
📉 Bearish scenario:
If BTC repeatedly fails around $87K and loses $84.8K, downside pressure could increase toward the $83K area.
For now, I don't want to chase the middle of the range.
Let BTC confirm the direction first.
Would you rather see a $90K breakout or another dip toward support? 👇
$BTC #Bitcoin #Crypto #BTCAnalysis #BinanceSquare $BTC
94

See translation
📊 #BTC Update | Oct 6, 2026
Exactly one year ago today, Bitcoin hit its all-time high of about $126K. Today it's trading around $85.5K, up 3% on the week, after a strong summer rebound of about 44% from the early-July low near $57.8K. 💪
🔑 Levels I'm watching
🔴 Resistance: $87,397 → then $90,000
🟢 Support: $82,281–$82,800 → $81,731 (20-day EMA) → $80,875 → $75,585
📈 Trend: Price is still about 11.7% above the 200-day EMA ($74.3K), so the broader structure remains bullish. Short-term momentum is cooling, though, so a retest of support wouldn't be a surprise.
🗓️ What's ahead
Fed meeting in October. Oil prices and the unresolved Strait situation are a key swing factor, before or after the meeting. October scenarios (not predictions):
Base case: ~$87K Bullish: ~$92K Floor: ~$81.7K
💭 My take (12 years in BTC): Don't chase candles. Know your levels, size your positions, and let the market come to you. A clean break above $87.4K opens the road to $90K. A loss of $81.7K means I'd get cautious.
⚠️ Not financial advice. Forecasts miss often. Always DYOR and manage your risk.
#BTC #BinanceSquareTalks #CryptoUpdate #BTCAnalysis
📊 #BTC Update | Oct 6, 2026
Exactly one year ago today, Bitcoin hit its all-time high of about $126K. Today it's trading around $85.5K, up 3% on the week, after a strong summer rebound of about 44% from the early-July low near $57.8K. 💪
🔑 Levels I'm watching
🔴 Resistance: $87,397 → then $90,000
🟢 Support: $82,281–$82,800 → $81,731 (20-day EMA) → $80,875 → $75,585
📈 Trend: Price is still about 11.7% above the 200-day EMA ($74.3K), so the broader structure remains bullish. Short-term momentum is cooling, though, so a retest of support wouldn't be a surprise.
🗓️ What's ahead
Fed meeting in October. Oil prices and the unresolved Strait situation are a key swing factor, before or after the meeting. October scenarios (not predictions):
Base case: ~$87K Bullish: ~$92K Floor: ~$81.7K
💭 My take (12 years in BTC): Don't chase candles. Know your levels, size your positions, and let the market come to you. A clean break above $87.4K opens the road to $90K. A loss of $81.7K means I'd get cautious.
⚠️ Not financial advice. Forecasts miss often. Always DYOR and manage your risk.
#BTC #BinanceSquareTalks #CryptoUpdate #BTCAnalysis
Exactly one year ago today, Bitcoin hit its all-time high of about $126K. Today it's trading around $85.5K, up 3% on the week, after a strong summer rebound of about 44% from the early-July low near $57.8K. 💪
🔑 Levels I'm watching
🔴 Resistance: $87,397 → then $90,000
🟢 Support: $82,281–$82,800 → $81,731 (20-day EMA) → $80,875 → $75,585
📈 Trend: Price is still about 11.7% above the 200-day EMA ($74.3K), so the broader structure remains bullish. Short-term momentum is cooling, though, so a retest of support wouldn't be a surprise.
🗓️ What's ahead
Fed meeting in October. Oil prices and the unresolved Strait situation are a key swing factor, before or after the meeting. October scenarios (not predictions):
Base case: ~$87K Bullish: ~$92K Floor: ~$81.7K
💭 My take (12 years in BTC): Don't chase candles. Know your levels, size your positions, and let the market come to you. A clean break above $87.4K opens the road to $90K. A loss of $81.7K means I'd get cautious.
⚠️ Not financial advice. Forecasts miss often. Always DYOR and manage your risk.
#BTC #BinanceSquareTalks #CryptoUpdate #BTCAnalysis
1
80

Article
THE 83.7K TRAPBTC $83,740 (+0.5%) — ETH $2,691 (+0.96%) — F&G 71 (Greed) — Vol $35B — ETF +9d — Liquidations $121M
🤯 83,740. The level no one dared to target. BTC broke through the 84K resistance without institutional volume — a false breakout?
• BTC $83,740 (+0.5% / 24h) — range $82,950 / $85,518 — volume $35.3B (+34% 24h) — 9 consecutive days of ETF inflows
• ETH $2,691 (+0.96%) — BTC dominance 56.8% — ETH underperforming (-15% over 30d) — $121M in liquidations over 24h
• Macro: CPI expected next week — FOMC in 5 days — 3.75–4.00% rate likely — market is anticipating a pivot
THE 83.7K TRAP
BTC $83,740 (+0.5%) — ETH $2,691 (+0.96%) — F&G 71 (Greed) — Vol $35B — ETF +9d — Liquidations $121M
🤯 83,740. The level no one dared to target. BTC broke through the 84K resistance without institutional volume — a false breakout?
• BTC $83,740 (+0.5% / 24h) — range $82,950 / $85,518 — volume $35.3B (+34% 24h) — 9 consecutive days of ETF inflows
• ETH $2,691 (+0.96%) — BTC dominance 56.8% — ETH underperforming (-15% over 30d) — $121M in liquidations over 24h
• Macro: CPI expected next week — FOMC in 5 days — 3.75–4.00% rate likely — market is anticipating a pivot
🤯 83,740. The level no one dared to target. BTC broke through the 84K resistance without institutional volume — a false breakout?
• BTC $83,740 (+0.5% / 24h) — range $82,950 / $85,518 — volume $35.3B (+34% 24h) — 9 consecutive days of ETF inflows
• ETH $2,691 (+0.96%) — BTC dominance 56.8% — ETH underperforming (-15% over 30d) — $121M in liquidations over 24h
• Macro: CPI expected next week — FOMC in 5 days — 3.75–4.00% rate likely — market is anticipating a pivot
68

·
--
See translation
🚨 $BTC Live Market Analysis
$BTC is currently trading around $86.1K, with bulls still holding the short-term structure. The main battle right now is around the $87K–$87.5K resistance zone. BTC has tested this area but has struggled to break and hold above it.
📈 Bullish Scenario:
A clean breakout and 4H/daily close above $87.5K could open the way toward $88.5K → $90K → $92K. ETF inflows and reduced expectations for another Fed hike are currently providing some support.
📉 Bearish Scenario:
If BTC gets rejected again from $87K–$87.5K, I’d watch $85.5K → $84.2K → $82K. Losing the $84K area would weaken the current bullish structure significantly.
🎯 My Take:
I’m bullish but not chasing here. The confirmation I want is a strong breakout above $87.5K with volume. Until then, BTC can remain choppy around the resistance.
Key Levels:
🟢 Support: $85.5K / $84.2K / $82K
🔴 Resistance: $87K–$87.5K
🚀 Breakout target: $90K → $92K
BTC is at the decision zone now. Breakout or rejection? 👀
#BTC #Bitcoin #Crypto #BTCAnalysis #BinanceSquare
🚨 $BTC Live Market Analysis
$BTC is currently trading around $86.1K, with bulls still holding the short-term structure. The main battle right now is around the $87K–$87.5K resistance zone. BTC has tested this area but has struggled to break and hold above it.
📈 Bullish Scenario:
A clean breakout and 4H/daily close above $87.5K could open the way toward $88.5K → $90K → $92K. ETF inflows and reduced expectations for another Fed hike are currently providing some support.
📉 Bearish Scenario:
If BTC gets rejected again from $87K–$87.5K, I’d watch $85.5K → $84.2K → $82K. Losing the $84K area would weaken the current bullish structure significantly.
🎯 My Take:
I’m bullish but not chasing here. The confirmation I want is a strong breakout above $87.5K with volume. Until then, BTC can remain choppy around the resistance.
Key Levels:
🟢 Support: $85.5K / $84.2K / $82K
🔴 Resistance: $87K–$87.5K
🚀 Breakout target: $90K → $92K
BTC is at the decision zone now. Breakout or rejection? 👀
#BTC #Bitcoin #Crypto #BTCAnalysis #BinanceSquare
$BTC is currently trading around $86.1K, with bulls still holding the short-term structure. The main battle right now is around the $87K–$87.5K resistance zone. BTC has tested this area but has struggled to break and hold above it.
📈 Bullish Scenario:
A clean breakout and 4H/daily close above $87.5K could open the way toward $88.5K → $90K → $92K. ETF inflows and reduced expectations for another Fed hike are currently providing some support.
📉 Bearish Scenario:
If BTC gets rejected again from $87K–$87.5K, I’d watch $85.5K → $84.2K → $82K. Losing the $84K area would weaken the current bullish structure significantly.
🎯 My Take:
I’m bullish but not chasing here. The confirmation I want is a strong breakout above $87.5K with volume. Until then, BTC can remain choppy around the resistance.
Key Levels:
🟢 Support: $85.5K / $84.2K / $82K
🔴 Resistance: $87K–$87.5K
🚀 Breakout target: $90K → $92K
BTC is at the decision zone now. Breakout or rejection? 👀
#BTC #Bitcoin #Crypto #BTCAnalysis #BinanceSquare
69

·
--
Bullish
See translation
(BTC) Quick Analysis
BTC is showing strong bullish momentum and is holding above key support levels.
📈 Resistance: $87.4K–$88.8K
🛡️ Support: $85K
🎯 Bullish Target: $95K
If BTC breaks and holds above $88.8K, the next major move could be toward $95K.
But if it loses $85K, a pullback toward $81K is possible.
🔥 BTC is at a key decision zone — breakout or pullback
#BTC
$🚨 BITCOIN BREAKOUT WATCH 🚨
#BTC🔥🔥🔥🔥🔥 $ is back around the $86K zone and the next move could be important.
🔥 $86K–$88K = key resistance 🛡️ $84K = important support 🎯 $90K = next psychological target
If Bitcoin breaks resistance with strong momentum, the bulls could take control.
But will BTC break $90K… or get rejected again? 👀
#Bitcoin #BTC #BTCAnalysis
{spot}(BTCUSDT)
(BTC) Quick Analysis
BTC is showing strong bullish momentum and is holding above key support levels.
📈 Resistance: $87.4K–$88.8K
🛡️ Support: $85K
🎯 Bullish Target: $95K
If BTC breaks and holds above $88.8K, the next major move could be toward $95K.
But if it loses $85K, a pullback toward $81K is possible.
🔥 BTC is at a key decision zone — breakout or pullback
#BTC
$🚨 BITCOIN BREAKOUT WATCH 🚨
#BTC🔥🔥🔥🔥🔥 $ is back around the $86K zone and the next move could be important.
🔥 $86K–$88K = key resistance 🛡️ $84K = important support 🎯 $90K = next psychological target
If Bitcoin breaks resistance with strong momentum, the bulls could take control.
But will BTC break $90K… or get rejected again? 👀
#Bitcoin #BTC #BTCAnalysis
BTC is showing strong bullish momentum and is holding above key support levels.
📈 Resistance: $87.4K–$88.8K
🛡️ Support: $85K
🎯 Bullish Target: $95K
If BTC breaks and holds above $88.8K, the next major move could be toward $95K.
But if it loses $85K, a pullback toward $81K is possible.
🔥 BTC is at a key decision zone — breakout or pullback
#BTC
$🚨 BITCOIN BREAKOUT WATCH 🚨
#BTC🔥🔥🔥🔥🔥 $ is back around the $86K zone and the next move could be important.
🔥 $86K–$88K = key resistance 🛡️ $84K = important support 🎯 $90K = next psychological target
If Bitcoin breaks resistance with strong momentum, the bulls could take control.
But will BTC break $90K… or get rejected again? 👀
#Bitcoin #BTC #BTCAnalysis
145

See translation
🚀 $BTC — Bulls Still in Control?
$BTC is holding around the $84K–$85K zone after briefly pushing above $87K following weak U.S. jobs data. The move shows strong buying interest, but sellers are still defending the $87K area.
📈 Bullish scenario: A clean break above $87K could open the way toward $90K.
⚠️ Risk zone: Losing $82.5K could bring another correction.
October has started with renewed BTC momentum, but leverage is also elevated, so volatility can remain high. Watch the breakout, don’t chase blindly. 👀
DYOR — not financial advice.
#bitcoin #BTC #crypto #BinanceSquare #BTCAnalysis
{spot}(BTCUSDT)
🚀 $BTC — Bulls Still in Control?
$BTC is holding around the $84K–$85K zone after briefly pushing above $87K following weak U.S. jobs data. The move shows strong buying interest, but sellers are still defending the $87K area.
📈 Bullish scenario: A clean break above $87K could open the way toward $90K.
⚠️ Risk zone: Losing $82.5K could bring another correction.
October has started with renewed BTC momentum, but leverage is also elevated, so volatility can remain high. Watch the breakout, don’t chase blindly. 👀
DYOR — not financial advice.
#bitcoin #BTC #crypto #BinanceSquare #BTCAnalysis
$BTC is holding around the $84K–$85K zone after briefly pushing above $87K following weak U.S. jobs data. The move shows strong buying interest, but sellers are still defending the $87K area.
📈 Bullish scenario: A clean break above $87K could open the way toward $90K.
⚠️ Risk zone: Losing $82.5K could bring another correction.
October has started with renewed BTC momentum, but leverage is also elevated, so volatility can remain high. Watch the breakout, don’t chase blindly. 👀
DYOR — not financial advice.
#bitcoin #BTC #crypto #BinanceSquare #BTCAnalysis
1
79
·
--
🌙 BTC NIGHT SETUP — $85K Key Area Determiner?
Bitcoin still looks worth watching tonight after rejecting the $87K area and falling back to around $85K. The previous rally briefly triggered a short-term breakout, but sellers took control and sparked a liquidation cascade. Latest data reports that more than $570 million in crypto positions were liquidated within 24 hours, mostly long positions.
📊 BTC Price Action is now in a decision zone:
🔴 Resistance: $86K–$87K
🟡 Pivot: $84K–$85K
🟢 Support: $82.2K–$82.8K
What’s interesting is the possibility of a liquidity sweep on both sides. BTC already swept liquidity above $87K and then rejected. If $84K gets swept again but quickly reclaimed, it could be a reversal signal.
🟢 BULLISH SCENARIO
If BTC sweeps $84K–$82.8K, then reclaims $85K as buyer volume increases:
Entry: $84.2K–$85K after confirmation
TP1: $86K
TP2: $87K
TP3: $88.5K–$90K
Invalidation: strong close below $82K
🔻 BEARISH SCENARIO
If BTC returns to $86K–$87K but rejection appears and seller volume increases:
Entry: $86K–$86.8K after rejection
TP1: $84K
TP2: $82.8K
TP3: $80K–$81K
Invalidation: breakout & hold above $87.5K
⚠️ Don’t chase candles. After a large liquidation, volatility can be extremely high. What matters most tonight is watching the sequence: sweep → reclaim/rejection → volume confirmation.
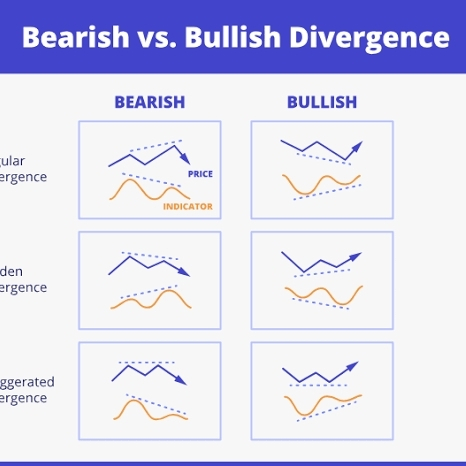
In terms of momentum, BTC still needs to maintain its structure around the $82K area, while the RSI and moving-average structure remain key indicators to judge whether the pullback is only a retracement or starts turning into a reversal.
What do you think: will BTC sweep $82K first before returning to $87K, or will $87K become the rejection zone for the next drop? 👀
#BTCUSDT. #TechnicalAnalysis #PriceActionAnalysis #LiquiditySweep #BTCAnalysis
🌙 BTC NIGHT SETUP — $85K Key Area Determiner?
Bitcoin still looks worth watching tonight after rejecting the $87K area and falling back to around $85K. The previous rally briefly triggered a short-term breakout, but sellers took control and sparked a liquidation cascade. Latest data reports that more than $570 million in crypto positions were liquidated within 24 hours, mostly long positions.
📊 BTC Price Action is now in a decision zone:
🔴 Resistance: $86K–$87K
🟡 Pivot: $84K–$85K
🟢 Support: $82.2K–$82.8K
What’s interesting is the possibility of a liquidity sweep on both sides. BTC already swept liquidity above $87K and then rejected. If $84K gets swept again but quickly reclaimed, it could be a reversal signal.
🟢 BULLISH SCENARIO
If BTC sweeps $84K–$82.8K, then reclaims $85K as buyer volume increases:
Entry: $84.2K–$85K after confirmation
TP1: $86K
TP2: $87K
TP3: $88.5K–$90K
Invalidation: strong close below $82K
🔻 BEARISH SCENARIO
If BTC returns to $86K–$87K but rejection appears and seller volume increases:
Entry: $86K–$86.8K after rejection
TP1: $84K
TP2: $82.8K
TP3: $80K–$81K
Invalidation: breakout & hold above $87.5K
⚠️ Don’t chase candles. After a large liquidation, volatility can be extremely high. What matters most tonight is watching the sequence: sweep → reclaim/rejection → volume confirmation.
In terms of momentum, BTC still needs to maintain its structure around the $82K area, while the RSI and moving-average structure remain key indicators to judge whether the pullback is only a retracement or starts turning into a reversal.
What do you think: will BTC sweep $82K first before returning to $87K, or will $87K become the rejection zone for the next drop? 👀
#BTCUSDT. #TechnicalAnalysis #PriceActionAnalysis #LiquiditySweep #BTCAnalysis
Bitcoin still looks worth watching tonight after rejecting the $87K area and falling back to around $85K. The previous rally briefly triggered a short-term breakout, but sellers took control and sparked a liquidation cascade. Latest data reports that more than $570 million in crypto positions were liquidated within 24 hours, mostly long positions.
📊 BTC Price Action is now in a decision zone:
🔴 Resistance: $86K–$87K
🟡 Pivot: $84K–$85K
🟢 Support: $82.2K–$82.8K
What’s interesting is the possibility of a liquidity sweep on both sides. BTC already swept liquidity above $87K and then rejected. If $84K gets swept again but quickly reclaimed, it could be a reversal signal.
🟢 BULLISH SCENARIO
If BTC sweeps $84K–$82.8K, then reclaims $85K as buyer volume increases:
Entry: $84.2K–$85K after confirmation
TP1: $86K
TP2: $87K
TP3: $88.5K–$90K
Invalidation: strong close below $82K
🔻 BEARISH SCENARIO
If BTC returns to $86K–$87K but rejection appears and seller volume increases:
Entry: $86K–$86.8K after rejection
TP1: $84K
TP2: $82.8K
TP3: $80K–$81K
Invalidation: breakout & hold above $87.5K
⚠️ Don’t chase candles. After a large liquidation, volatility can be extremely high. What matters most tonight is watching the sequence: sweep → reclaim/rejection → volume confirmation.
In terms of momentum, BTC still needs to maintain its structure around the $82K area, while the RSI and moving-average structure remain key indicators to judge whether the pullback is only a retracement or starts turning into a reversal.
What do you think: will BTC sweep $82K first before returning to $87K, or will $87K become the rejection zone for the next drop? 👀
#BTCUSDT. #TechnicalAnalysis #PriceActionAnalysis #LiquiditySweep #BTCAnalysis
532

See translation
Bitcoin enters the new week around $85K with momentum still on the bulls’ side.
$BTC recently pushed toward $87K as weaker U.S. jobs data reduced expectations for another Fed rate hike, while ETF demand has started to recover.
For the week ahead, $85K is the key zone to hold. If $BTC stays above it and breaks $87K–$88K, the next target could be around $90K–$95K.
But if $85K fails, a pullback toward $82K–$83K would be the level I’d watch for a potential retest.
My view: cautiously bullish, but confirmation above $87K matters.
$BTC #Bitcoin #Crypto #BTCAnalysis #CryptoMarket
Bitcoin enters the new week around $85K with momentum still on the bulls’ side.
$BTC recently pushed toward $87K as weaker U.S. jobs data reduced expectations for another Fed rate hike, while ETF demand has started to recover.
For the week ahead, $85K is the key zone to hold. If $BTC stays above it and breaks $87K–$88K, the next target could be around $90K–$95K.
But if $85K fails, a pullback toward $82K–$83K would be the level I’d watch for a potential retest.
My view: cautiously bullish, but confirmation above $87K matters.
$BTC #Bitcoin #Crypto #BTCAnalysis #CryptoMarket
$BTC recently pushed toward $87K as weaker U.S. jobs data reduced expectations for another Fed rate hike, while ETF demand has started to recover.
For the week ahead, $85K is the key zone to hold. If $BTC stays above it and breaks $87K–$88K, the next target could be around $90K–$95K.
But if $85K fails, a pullback toward $82K–$83K would be the level I’d watch for a potential retest.
My view: cautiously bullish, but confirmation above $87K matters.
$BTC #Bitcoin #Crypto #BTCAnalysis #CryptoMarket
1
135

·
--
$BTC 🚨 BTC STUCK AT $84,820 - Breakout when? 🚨
Bitcoin is currently stuck in a narrow range!
📊 TODAY:
Current: $84,820
24H High: $85,021 | Low: $84,512
Volume: Very Low (Sunday Effect)
🎯 LEVELS:
Resistance: $87,395 🔴
Support: $74,967 🔵
📈 Technical:
ADX 44 = Strong Trend
M30: BUY | H4: SELL
The market is confused!
My take: Once $85k is crossed, straight to $87k. If $84.5k breaks down, expect a correction till $83k.
What do you think? $87K or $74K?
#BTC #Bitcoin #BinanceSquare #CryptoNews #BTCanalysis #SECHaltsCryptoETFReviewsAmidFundingLapse #FedOctoberRateHikeOddsFallTo17% #NvidiaHitsRecordHighUp2.4%
{spot}(BTCUSDT)
$BTC 🚨 BTC STUCK AT $84,820 - Breakout when? 🚨
Bitcoin is currently stuck in a narrow range!
📊 TODAY:
Current: $84,820
24H High: $85,021 | Low: $84,512
Volume: Very Low (Sunday Effect)
🎯 LEVELS:
Resistance: $87,395 🔴
Support: $74,967 🔵
📈 Technical:
ADX 44 = Strong Trend
M30: BUY | H4: SELL
The market is confused!
My take: Once $85k is crossed, straight to $87k. If $84.5k breaks down, expect a correction till $83k.
What do you think? $87K or $74K?
#BTC #Bitcoin #BinanceSquare #CryptoNews #BTCanalysis #SECHaltsCryptoETFReviewsAmidFundingLapse #FedOctoberRateHikeOddsFallTo17% #NvidiaHitsRecordHighUp2.4%
Bitcoin is currently stuck in a narrow range!
📊 TODAY:
Current: $84,820
24H High: $85,021 | Low: $84,512
Volume: Very Low (Sunday Effect)
🎯 LEVELS:
Resistance: $87,395 🔴
Support: $74,967 🔵
📈 Technical:
ADX 44 = Strong Trend
M30: BUY | H4: SELL
The market is confused!
My take: Once $85k is crossed, straight to $87k. If $84.5k breaks down, expect a correction till $83k.
What do you think? $87K or $74K?
#BTC #Bitcoin #BinanceSquare #CryptoNews #BTCanalysis #SECHaltsCryptoETFReviewsAmidFundingLapse #FedOctoberRateHikeOddsFallTo17% #NvidiaHitsRecordHighUp2.4%
83
Log in to explore more content
Join global crypto users on Binance Square
⚡️ Get latest and useful information about crypto.
💬 Trusted by the world’s largest crypto exchange.
👍 Discover real insights from verified creators.
Email / Phone number
Trending Topics
1
#EthereumSurpasses$2500
2,503 views
45 Discussing
2
#SolanaPlansToCutBlockTimesTo200ms
9,620 views
324 Discussing
3
#ReusedBitcoinAddressesHold4.33MBTC
27,281 views
484 Discussing
4
#BitcoinDipsBelow$81K
62,601 views
123 Discussing
5
#SenBlumenthalProbesCantorFitzgeraldTetherTies
14,642 views
473 Discussing
6
#SecuritizeSharesRiseOver10%AfterTokenizedStocksLaunch
1,385 views
24 Discussing
7
#BitcoinLifeInsurerMeanwhileRaises$37.5M
1,389 views
34 Discussing
8
#IMFSaysTokenizedMarketsSmall
365,254 views
2,165 Discussing
9
#FedMinutesFocusOnOctoberPause
939,879 views
4,818 Discussing
10
#VitalikWarnsAICouldWeakenCryptographySecurity
123,617 views
1,369 Discussing