
#render
render
3.3M views
11,104 Discussing
Hot
Latest

·
--
See translation
I almost bought $RENDER today. Then I checked the volume at 0.7x average
Sitting this one out at $1.3480 because $2.1M of daily volume is way too thin for size
Exits get messy in illiquid books when the tape slows down
I need an hourly close and hold above $1.4520 to show real demand
Or I want a pullback that holds $1.3360 and bounces cleanly
It could keep running without me and a bad entry costs more than a missed move
Chasing $RENDER here, or waiting for 1.3360
#RENDER #RiskManagement
I almost bought $RENDER today. Then I checked the volume at 0.7x average
Sitting this one out at $1.3480 because $2.1M of daily volume is way too thin for size
Exits get messy in illiquid books when the tape slows down
I need an hourly close and hold above $1.4520 to show real demand
Or I want a pullback that holds $1.3360 and bounces cleanly
It could keep running without me and a bad entry costs more than a missed move
Chasing $RENDER here, or waiting for 1.3360
#RENDER #RiskManagement
Sitting this one out at $1.3480 because $2.1M of daily volume is way too thin for size
Exits get messy in illiquid books when the tape slows down
I need an hourly close and hold above $1.4520 to show real demand
Or I want a pullback that holds $1.3360 and bounces cleanly
It could keep running without me and a bad entry costs more than a missed move
Chasing $RENDER here, or waiting for 1.3360
#RENDER #RiskManagement
23

·
--
See translation
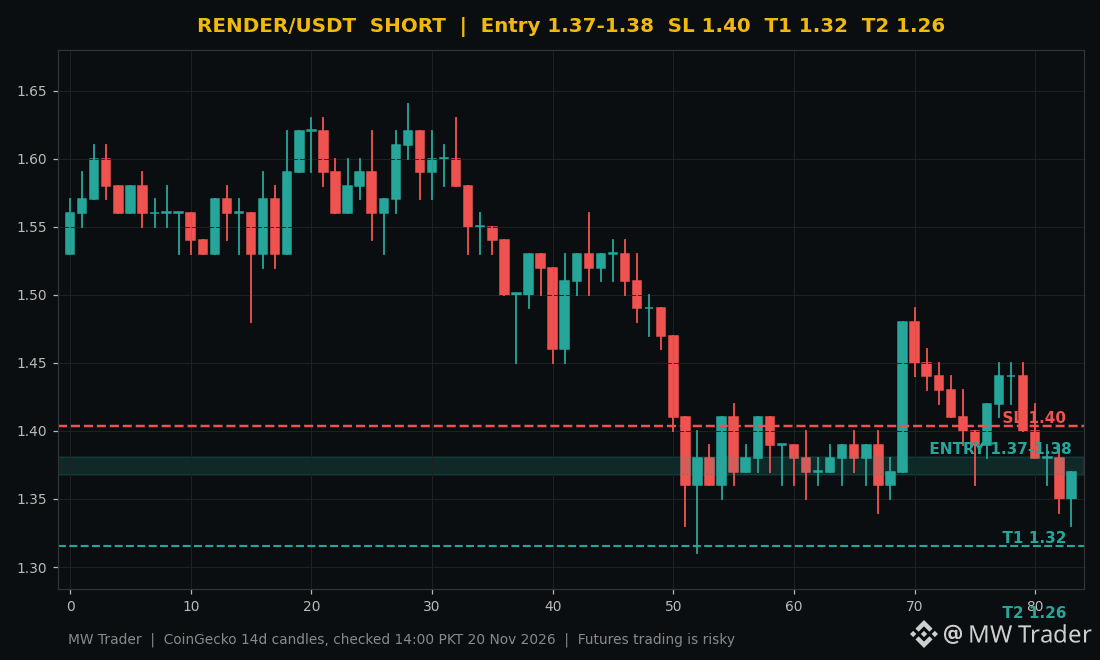
$RENDER #RENDER 📉 Render is down 4.39 percent today, breaking lower with the market, and I am shorting it.
Direction: SHORT 🔴
Entry zone: 1.37 to 1.38
Stop loss: 1.40
Target 1: 1.32
Target 2: 1.26
Render is trading near $1.37 after losing 4.39 percent in 24 hours, according to CoinGecko, and the live price sits right inside my entry zone of 1.37 to 1.38. I last posted RENDER on November 18, and the setup has genuinely changed, the coin has lost its short term range and is now pressing lower with Bitcoin under $62,000. My plan is short the zone, stop above $1.40, take the first profit at $1.32, with $1.26 as the second target. 📉
Would you short RENDER here, or wait for a reclaim of $1.40 first? 🤔
Futures trading is risky, trade small, manage risk, do your own research. ⚠️
Follow for more trades.
#Render #Crypto #FuturesTrading #TradingSignals
$RENDER #RENDER 📉 Render is down 4.39 percent today, breaking lower with the market, and I am shorting it.
Direction: SHORT 🔴
Entry zone: 1.37 to 1.38
Stop loss: 1.40
Target 1: 1.32
Target 2: 1.26
Render is trading near $1.37 after losing 4.39 percent in 24 hours, according to CoinGecko, and the live price sits right inside my entry zone of 1.37 to 1.38. I last posted RENDER on November 18, and the setup has genuinely changed, the coin has lost its short term range and is now pressing lower with Bitcoin under $62,000. My plan is short the zone, stop above $1.40, take the first profit at $1.32, with $1.26 as the second target. 📉
Would you short RENDER here, or wait for a reclaim of $1.40 first? 🤔
Futures trading is risky, trade small, manage risk, do your own research. ⚠️
Follow for more trades.
#Render #Crypto #FuturesTrading #TradingSignals
Direction: SHORT 🔴
Entry zone: 1.37 to 1.38
Stop loss: 1.40
Target 1: 1.32
Target 2: 1.26
Render is trading near $1.37 after losing 4.39 percent in 24 hours, according to CoinGecko, and the live price sits right inside my entry zone of 1.37 to 1.38. I last posted RENDER on November 18, and the setup has genuinely changed, the coin has lost its short term range and is now pressing lower with Bitcoin under $62,000. My plan is short the zone, stop above $1.40, take the first profit at $1.32, with $1.26 as the second target. 📉
Would you short RENDER here, or wait for a reclaim of $1.40 first? 🤔
Futures trading is risky, trade small, manage risk, do your own research. ⚠️
Follow for more trades.
#Render #Crypto #FuturesTrading #TradingSignals
16


·
--
Partly True
See translation
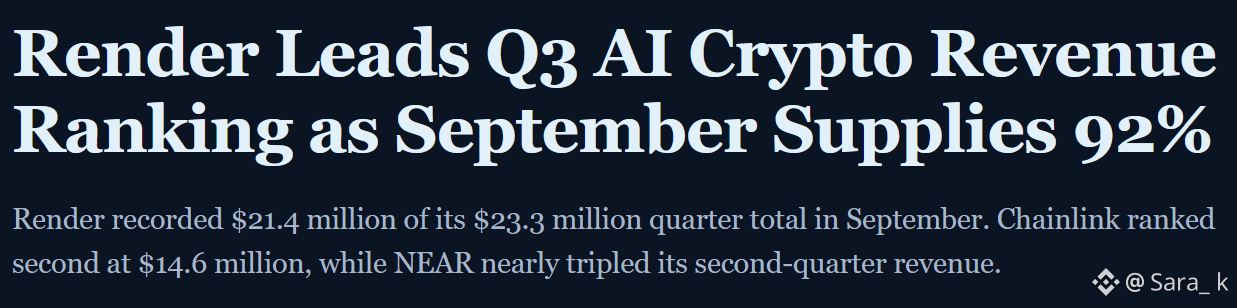
$TAO is at $197. $RENDER is at $1.44
But Render just reported $23.3M in Q3 revenue, 92% of it in September alone.
Which AI token actually has revenue backing the narrative?
#TAO #RenderToken #render #Near
{future}(TAOUSDT)
{future}(RENDERUSDT)
{future}(NEARUSDT)
$TAO is at $197. $RENDER is at $1.44
But Render just reported $23.3M in Q3 revenue, 92% of it in September alone.
Which AI token actually has revenue backing the narrative?
#TAO #RenderToken #render #Near
But Render just reported $23.3M in Q3 revenue, 92% of it in September alone.
Which AI token actually has revenue backing the narrative?
#TAO #RenderToken #render #Near

Abu Fahadأ:
💛
1
2
1.6k

·
--
See translation
🚨 $RENDER SUPPLY CONTRACTION WIPES OUT 133 PERCENT OF DAILY EMISSIONS IN TWO TRANSACTIONS! 💥
Institutional order flow mechanics are shifting dramatically as over twenty-one thousand tokens valued at thirty-one thousand dollars were permanently removed from circulation across just two execution prints. 📊 This aggressive supply shock effectively eclipses the daily network emission rate by over one hundred thirty percent, fundamentally altering circulating float dynamics. ⚡
When structural supply contraction aligns with resting liquidity pools, smart money typically initiates pre-expansion accumulation phases ahead of breakout velocity. 🔍 Are you positioning for an institutional markup leg here, or anticipating further range consolidation? 👇
⚠️ Not financial advice. Always manage your risk. 🛡️
🏷️ #RENDER #SupplyShock #MarketStructure #Crypto
🔥 💎
🚨 $RENDER SUPPLY CONTRACTION WIPES OUT 133 PERCENT OF DAILY EMISSIONS IN TWO TRANSACTIONS! 💥
Institutional order flow mechanics are shifting dramatically as over twenty-one thousand tokens valued at thirty-one thousand dollars were permanently removed from circulation across just two execution prints. 📊 This aggressive supply shock effectively eclipses the daily network emission rate by over one hundred thirty percent, fundamentally altering circulating float dynamics. ⚡
When structural supply contraction aligns with resting liquidity pools, smart money typically initiates pre-expansion accumulation phases ahead of breakout velocity. 🔍 Are you positioning for an institutional markup leg here, or anticipating further range consolidation? 👇
⚠️ Not financial advice. Always manage your risk. 🛡️
🏷️ #RENDER #SupplyShock #MarketStructure #Crypto
🔥 💎
Institutional order flow mechanics are shifting dramatically as over twenty-one thousand tokens valued at thirty-one thousand dollars were permanently removed from circulation across just two execution prints. 📊 This aggressive supply shock effectively eclipses the daily network emission rate by over one hundred thirty percent, fundamentally altering circulating float dynamics. ⚡
When structural supply contraction aligns with resting liquidity pools, smart money typically initiates pre-expansion accumulation phases ahead of breakout velocity. 🔍 Are you positioning for an institutional markup leg here, or anticipating further range consolidation? 👇
⚠️ Not financial advice. Always manage your risk. 🛡️
🏷️ #RENDER #SupplyShock #MarketStructure #Crypto
🔥 💎
2

See translation
🚨 MASSIVE SUPPLY SHOCK AS $RENDER BURNS MORE THAN 100% OF DAILY EMISSIONS! 💥
Over twenty-one thousand tokens vanished in a flash across two direct transactions, completely deleting over one hundred percent of daily network emissions. ⚡ When structural issuance drops into negative net territory while demand quietly accumulates, sellers are walking into a brick wall. 📊
This is textbook supply constraint mechanics playing out in real time before the broader market wakes up to the order book imbalance. 🔍 Are you positioning ahead of the expansion or waiting for confirmation on the reclaim? 👇
⚠️ Not financial advice. Always manage your risk. 🛡️
🏷️ #RENDER #TokenBurn #SupplyShock #Altcoins #Crypto
🔥 💎
🚨 MASSIVE SUPPLY SHOCK AS $RENDER BURNS MORE THAN 100% OF DAILY EMISSIONS! 💥
Over twenty-one thousand tokens vanished in a flash across two direct transactions, completely deleting over one hundred percent of daily network emissions. ⚡ When structural issuance drops into negative net territory while demand quietly accumulates, sellers are walking into a brick wall. 📊
This is textbook supply constraint mechanics playing out in real time before the broader market wakes up to the order book imbalance. 🔍 Are you positioning ahead of the expansion or waiting for confirmation on the reclaim? 👇
⚠️ Not financial advice. Always manage your risk. 🛡️
🏷️ #RENDER #TokenBurn #SupplyShock #Altcoins #Crypto
🔥 💎
Over twenty-one thousand tokens vanished in a flash across two direct transactions, completely deleting over one hundred percent of daily network emissions. ⚡ When structural issuance drops into negative net territory while demand quietly accumulates, sellers are walking into a brick wall. 📊
This is textbook supply constraint mechanics playing out in real time before the broader market wakes up to the order book imbalance. 🔍 Are you positioning ahead of the expansion or waiting for confirmation on the reclaim? 👇
⚠️ Not financial advice. Always manage your risk. 🛡️
🏷️ #RENDER #TokenBurn #SupplyShock #Altcoins #Crypto
🔥 💎
22

·
--
See translation
🤖 Your AI token bounced 10%. How much ground did it actually win back?
Imagine an AI token falls from 100 to 80 and then bounces 10%. The green candle looks great. Price is still at 88.
That’s the chart test I’d run after Ash Crypto’s Nov. 18 recap of the Fed minutes, which highlighted concerns around AI valuations, leverage and financing. How do crypto’s AI names behave when that trade comes under pressure?
🔍 Open $TAO and $RENDER . Choose one sell-off window and write down where each coin started, where it bottomed and where it ended after the first rebound. The token with the biggest green candle could still be the furthest from where it started.
📊 Bring in $BTC and ETH. Use the same timestamps. If TAO and RENDER both lose more ground than Bitcoin and Ethereum, you have a reason to watch the AI names more closely. If only one of them lags, open that chart again and check whether it had already broken support before the wider move.
One last check: advance both AI charts to the next pullback. Which one puts in a higher low? That’s where two rebounds that looked nearly identical can start to tell different stories.
You get one AI chart on your screen for the next session. TAO or RENDER, and what level are you watching?
#AICrypto #TAO #RENDER #RelativeStrength
🤖 Your AI token bounced 10%. How much ground did it actually win back?
Imagine an AI token falls from 100 to 80 and then bounces 10%. The green candle looks great. Price is still at 88.
That’s the chart test I’d run after Ash Crypto’s Nov. 18 recap of the Fed minutes, which highlighted concerns around AI valuations, leverage and financing. How do crypto’s AI names behave when that trade comes under pressure?
🔍 Open $TAO and $RENDER . Choose one sell-off window and write down where each coin started, where it bottomed and where it ended after the first rebound. The token with the biggest green candle could still be the furthest from where it started.
📊 Bring in $BTC and ETH. Use the same timestamps. If TAO and RENDER both lose more ground than Bitcoin and Ethereum, you have a reason to watch the AI names more closely. If only one of them lags, open that chart again and check whether it had already broken support before the wider move.
One last check: advance both AI charts to the next pullback. Which one puts in a higher low? That’s where two rebounds that looked nearly identical can start to tell different stories.
You get one AI chart on your screen for the next session. TAO or RENDER, and what level are you watching?
#AICrypto #TAO #RENDER #RelativeStrength
Imagine an AI token falls from 100 to 80 and then bounces 10%. The green candle looks great. Price is still at 88.
That’s the chart test I’d run after Ash Crypto’s Nov. 18 recap of the Fed minutes, which highlighted concerns around AI valuations, leverage and financing. How do crypto’s AI names behave when that trade comes under pressure?
🔍 Open $TAO and $RENDER . Choose one sell-off window and write down where each coin started, where it bottomed and where it ended after the first rebound. The token with the biggest green candle could still be the furthest from where it started.
📊 Bring in $BTC and ETH. Use the same timestamps. If TAO and RENDER both lose more ground than Bitcoin and Ethereum, you have a reason to watch the AI names more closely. If only one of them lags, open that chart again and check whether it had already broken support before the wider move.
One last check: advance both AI charts to the next pullback. Which one puts in a higher low? That’s where two rebounds that looked nearly identical can start to tell different stories.
You get one AI chart on your screen for the next session. TAO or RENDER, and what level are you watching?
#AICrypto #TAO #RENDER #RelativeStrength
1
215

See translation
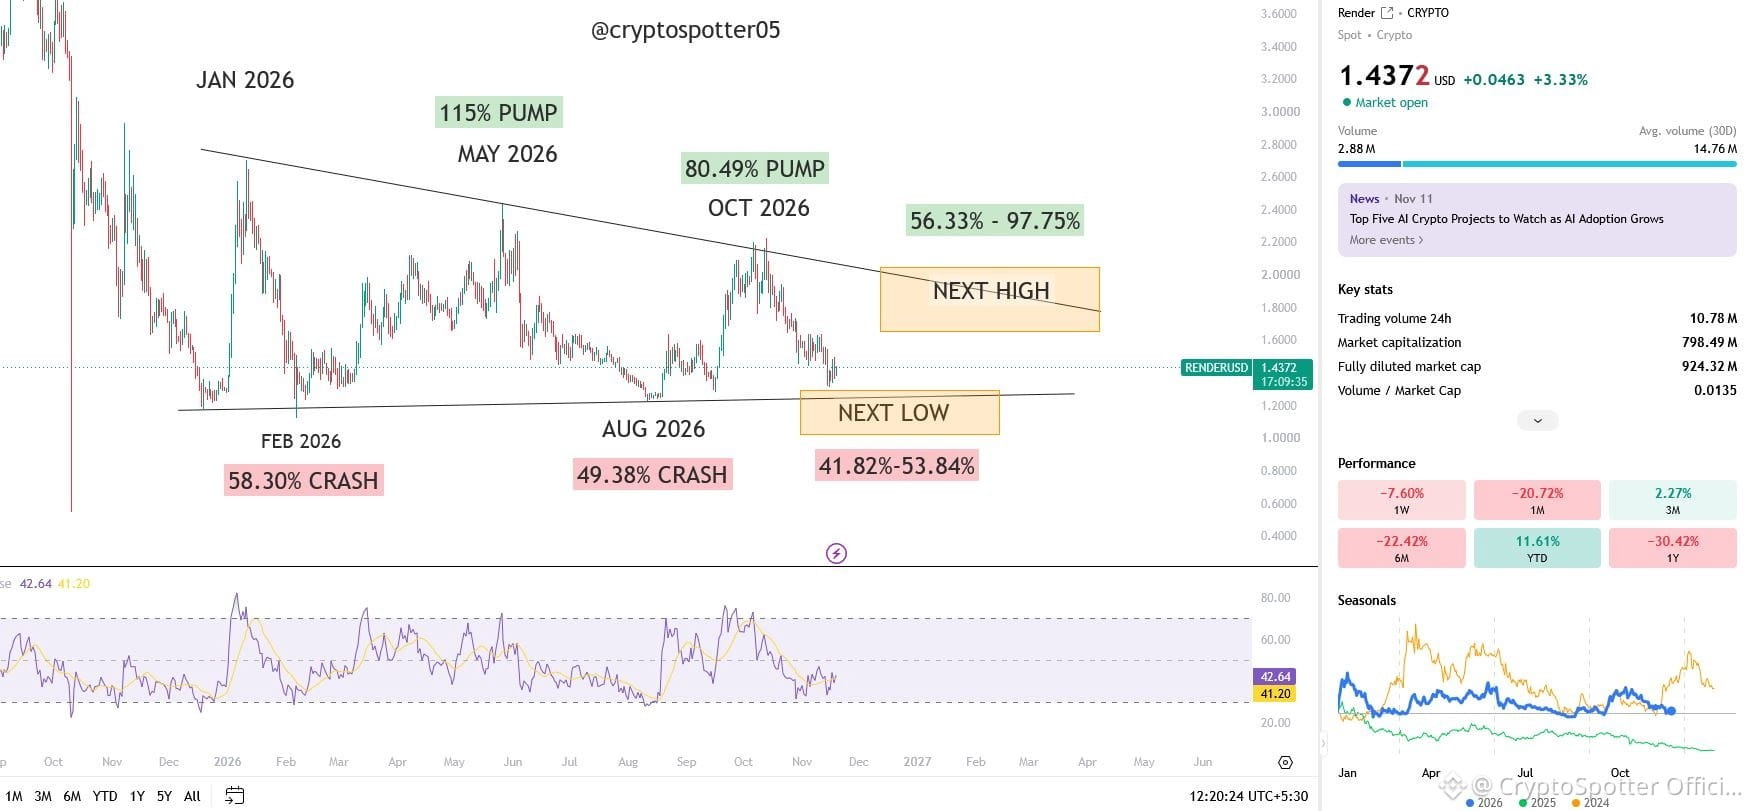
🚨 What's Next for $RENDER
I get this question quite often,And i have already explained this in my Recent video,
Uploaded 2 days ago, so let's break it down.
The chart shared below is based on my Percentage-Based Model, using price movements from 2026.
Let's look at the numbers:
Our first low came with a 58.30% drawdown, followed by a second low at 49.38%.
Now, applying the drawdown and average method, our projected next low comes in around 41.82%–53.84%.
This is our expected downside zone.
Once this area is tapped, I am expecting a gradual recovery towards the upside.
Based on the same drawdown and average methodology, the next upside wave is estimated to be around 56.33%–97.75%.
But here's the catch:
I expect $RENDER to remain bearish until the end of 2026.
My expectation is that we could start seeing gradual growth from Q1 2027 onwards.
Let's see how this model plays out. 🎯
Disclaimer: This is not financial advice. All charts and analysis I share are for educational purposes only.
#RENDER #RenderNetwork
🚨 What's Next for $RENDER
I get this question quite often,And i have already explained this in my Recent video,
Uploaded 2 days ago, so let's break it down.
The chart shared below is based on my Percentage-Based Model, using price movements from 2026.
Let's look at the numbers:
Our first low came with a 58.30% drawdown, followed by a second low at 49.38%.
Now, applying the drawdown and average method, our projected next low comes in around 41.82%–53.84%.
This is our expected downside zone.
Once this area is tapped, I am expecting a gradual recovery towards the upside.
Based on the same drawdown and average methodology, the next upside wave is estimated to be around 56.33%–97.75%.
But here's the catch:
I expect $RENDER to remain bearish until the end of 2026.
My expectation is that we could start seeing gradual growth from Q1 2027 onwards.
Let's see how this model plays out. 🎯
Disclaimer: This is not financial advice. All charts and analysis I share are for educational purposes only.
#RENDER #RenderNetwork
I get this question quite often,And i have already explained this in my Recent video,
Uploaded 2 days ago, so let's break it down.
The chart shared below is based on my Percentage-Based Model, using price movements from 2026.
Let's look at the numbers:
Our first low came with a 58.30% drawdown, followed by a second low at 49.38%.
Now, applying the drawdown and average method, our projected next low comes in around 41.82%–53.84%.
This is our expected downside zone.
Once this area is tapped, I am expecting a gradual recovery towards the upside.
Based on the same drawdown and average methodology, the next upside wave is estimated to be around 56.33%–97.75%.
But here's the catch:
I expect $RENDER to remain bearish until the end of 2026.
My expectation is that we could start seeing gradual growth from Q1 2027 onwards.
Let's see how this model plays out. 🎯
Disclaimer: This is not financial advice. All charts and analysis I share are for educational purposes only.
#RENDER #RenderNetwork
1
1
4.3k
·
--
See translation
$RENDER at 1.3830 is sitting at the bottom of its range and I am passing on it today
Volume is running at half of average which means nobody with real size is backing this move
The 24 hour volume is just 1.8M dollars so an exit at market could easily slip against you
I need to see an hourly close and hold above 1.4520 before taking it seriously
Or I want to watch a pullback that holds 1.3630 and bounces firmly
It could keep running without you and a bad entry costs more than a missed move
Chasing $RENDER here or waiting for 1.3630
#RENDER #RiskManagement
$RENDER at 1.3830 is sitting at the bottom of its range and I am passing on it today
Volume is running at half of average which means nobody with real size is backing this move
The 24 hour volume is just 1.8M dollars so an exit at market could easily slip against you
I need to see an hourly close and hold above 1.4520 before taking it seriously
Or I want to watch a pullback that holds 1.3630 and bounces firmly
It could keep running without you and a bad entry costs more than a missed move
Chasing $RENDER here or waiting for 1.3630
#RENDER #RiskManagement
Volume is running at half of average which means nobody with real size is backing this move
The 24 hour volume is just 1.8M dollars so an exit at market could easily slip against you
I need to see an hourly close and hold above 1.4520 before taking it seriously
Or I want to watch a pullback that holds 1.3630 and bounces firmly
It could keep running without you and a bad entry costs more than a missed move
Chasing $RENDER here or waiting for 1.3630
#RENDER #RiskManagement
6

See translation
AI coins had their moment this morning. RENDER just... didn't get the invite.
It's sitting at $1.41, flat on the day, down 22% this month. And here's the part that caught my eye — it's trading almost 20% below its 200-day average of $1.67. That's a big gap. Either the market's sleeping on it, or it just doesn't believe the story right now.
The story itself isn't dead though. Render's network pulled in $834K in GPU job payments in October. Real usage, real demand for compute while the token bleeds.
$1.36 is the floor underneath, $1.45 the ceiling above. Take back $1.45 with some volume and the chart starts looking a lot friendlier.
$BTC is still stuck under $64K too, so RENDER isn't breaking out on its own either way.
#Render #Crypto #AI
Not financial advice. DYOR.
AI coins had their moment this morning. RENDER just... didn't get the invite.
It's sitting at $1.41, flat on the day, down 22% this month. And here's the part that caught my eye — it's trading almost 20% below its 200-day average of $1.67. That's a big gap. Either the market's sleeping on it, or it just doesn't believe the story right now.
The story itself isn't dead though. Render's network pulled in $834K in GPU job payments in October. Real usage, real demand for compute while the token bleeds.
$1.36 is the floor underneath, $1.45 the ceiling above. Take back $1.45 with some volume and the chart starts looking a lot friendlier.
$BTC is still stuck under $64K too, so RENDER isn't breaking out on its own either way.
#Render #Crypto #AI
Not financial advice. DYOR.
It's sitting at $1.41, flat on the day, down 22% this month. And here's the part that caught my eye — it's trading almost 20% below its 200-day average of $1.67. That's a big gap. Either the market's sleeping on it, or it just doesn't believe the story right now.
The story itself isn't dead though. Render's network pulled in $834K in GPU job payments in October. Real usage, real demand for compute while the token bleeds.
$1.36 is the floor underneath, $1.45 the ceiling above. Take back $1.45 with some volume and the chart starts looking a lot friendlier.
$BTC is still stuck under $64K too, so RENDER isn't breaking out on its own either way.
#Render #Crypto #AI
Not financial advice. DYOR.
6
·
--
See translation
Your stop on $RENDER at 1.4390 is likely in the exact wrong spot
Most traders just pick a round five percent loss and hope for the best
That is a donation to the order book
The 24h swing low on $RENDER sits right down at 1.3630
The hourly ATR is 1.4 percent which means normal noise swings past tight arbitrary guesses instantly
If your protection sits inside that normal hourly chop you get wicked out before the move even starts
A proper stop goes under the actual invalidation level that proves the thesis dead
Where do you normally set yours
#RENDER #TradingTips
Your stop on $RENDER at 1.4390 is likely in the exact wrong spot
Most traders just pick a round five percent loss and hope for the best
That is a donation to the order book
The 24h swing low on $RENDER sits right down at 1.3630
The hourly ATR is 1.4 percent which means normal noise swings past tight arbitrary guesses instantly
If your protection sits inside that normal hourly chop you get wicked out before the move even starts
A proper stop goes under the actual invalidation level that proves the thesis dead
Where do you normally set yours
#RENDER #TradingTips
Most traders just pick a round five percent loss and hope for the best
That is a donation to the order book
The 24h swing low on $RENDER sits right down at 1.3630
The hourly ATR is 1.4 percent which means normal noise swings past tight arbitrary guesses instantly
If your protection sits inside that normal hourly chop you get wicked out before the move even starts
A proper stop goes under the actual invalidation level that proves the thesis dead
Where do you normally set yours
#RENDER #TradingTips
3

See translation
Nvidia beat — and the stock still fell. But look at the AI coins now.
Nvidia closed down 2.9% at $150.96 on Wednesday, its fifth straight down day. This morning the AI coins were falling with it. By the evening, they flipped.
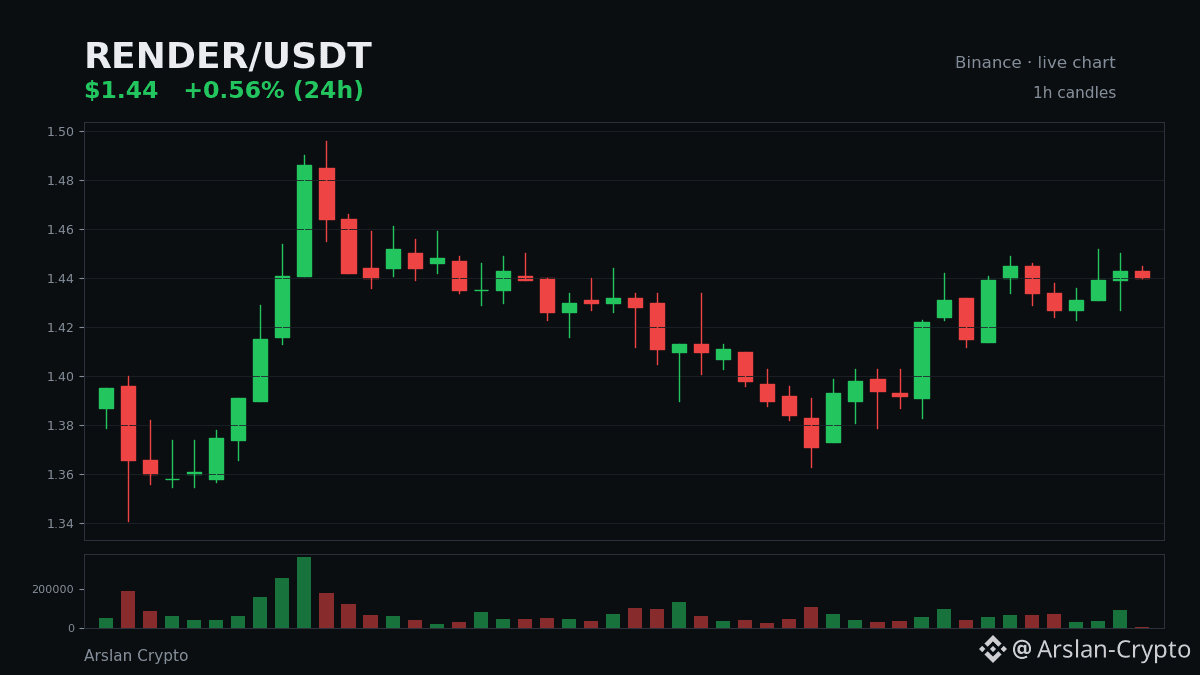
$RENDER is $1.44, +0.56% in 24h — after being -6.1% this morning
High $1.452, low $1.363, volume $2.1M
$TAO flipped too: $199.00, +2.10% — it was -2.4% this morning.
FET is nearly flat now at $0.1296, -0.23%, after being down 3.2%.
RENDER bounced off $1.363 and has held $1.42–$1.44 all evening. The hourly closes climbed $1.392 → $1.44 since midday.
The strange part: Nvidia's rivals rallied anyway. Broadcom rose 4%, AMD rose 5%. The market is not selling AI — it is selling Nvidia's leadership mess.
Can the AI coins stay green if Nvidia keeps falling?
#RENDER #Nvidia #AI #Crypto
Not financial advice.
Nvidia beat — and the stock still fell. But look at the AI coins now.
Nvidia closed down 2.9% at $150.96 on Wednesday, its fifth straight down day. This morning the AI coins were falling with it. By the evening, they flipped.
$RENDER is $1.44, +0.56% in 24h — after being -6.1% this morning
High $1.452, low $1.363, volume $2.1M
$TAO flipped too: $199.00, +2.10% — it was -2.4% this morning.
FET is nearly flat now at $0.1296, -0.23%, after being down 3.2%.
RENDER bounced off $1.363 and has held $1.42–$1.44 all evening. The hourly closes climbed $1.392 → $1.44 since midday.
The strange part: Nvidia's rivals rallied anyway. Broadcom rose 4%, AMD rose 5%. The market is not selling AI — it is selling Nvidia's leadership mess.
Can the AI coins stay green if Nvidia keeps falling?
#RENDER #Nvidia #AI #Crypto
Not financial advice.
Nvidia closed down 2.9% at $150.96 on Wednesday, its fifth straight down day. This morning the AI coins were falling with it. By the evening, they flipped.
$RENDER is $1.44, +0.56% in 24h — after being -6.1% this morning
High $1.452, low $1.363, volume $2.1M
$TAO flipped too: $199.00, +2.10% — it was -2.4% this morning.
FET is nearly flat now at $0.1296, -0.23%, after being down 3.2%.
RENDER bounced off $1.363 and has held $1.42–$1.44 all evening. The hourly closes climbed $1.392 → $1.44 since midday.
The strange part: Nvidia's rivals rallied anyway. Broadcom rose 4%, AMD rose 5%. The market is not selling AI — it is selling Nvidia's leadership mess.
Can the AI coins stay green if Nvidia keeps falling?
#RENDER #Nvidia #AI #Crypto
Not financial advice.
4

See translation
🚨 WHAT'S NEXT FOR $RENDER? BEARISH NOW, RECOVERY LATER? 👀
Let's take a closer look at the possible next move for $RENDER using a percentage-based market model.
📉 Downside Outlook:
Previous corrections recorded drawdowns of 58.30% and 49.38%. Based on this model, the next potential downside zone is estimated at 41.82%–53.84%.
📈 Recovery Potential:
After this correction phase, a gradual recovery could bring a potential upside move of 56.33%–97.75%.
🔍 My Outlook:
$RENDER could remain under bearish pressure through the end of 2026, while Q1 2027 may bring opportunities for gradual recovery.
Will this projection play out? Time will tell! 🎯
Not financial advice. This is a technical model, not a guaranteed prediction.
{spot}(RENDERUSDT)
#RENDER #RenderNetwork #CryptoAnalysis #BinanceSquare
🚨 WHAT'S NEXT FOR $RENDER ? BEARISH NOW, RECOVERY LATER? 👀
Let's take a closer look at the possible next move for $RENDER using a percentage-based market model.
📉 Downside Outlook:
Previous corrections recorded drawdowns of 58.30% and 49.38%. Based on this model, the next potential downside zone is estimated at 41.82%–53.84%.
📈 Recovery Potential:
After this correction phase, a gradual recovery could bring a potential upside move of 56.33%–97.75%.
🔍 My Outlook:
$RENDER could remain under bearish pressure through the end of 2026, while Q1 2027 may bring opportunities for gradual recovery.
Will this projection play out? Time will tell! 🎯
Not financial advice. This is a technical model, not a guaranteed prediction.
#RENDER #RenderNetwork #CryptoAnalysis #BinanceSquare
Let's take a closer look at the possible next move for $RENDER using a percentage-based market model.
📉 Downside Outlook:
Previous corrections recorded drawdowns of 58.30% and 49.38%. Based on this model, the next potential downside zone is estimated at 41.82%–53.84%.
📈 Recovery Potential:
After this correction phase, a gradual recovery could bring a potential upside move of 56.33%–97.75%.
🔍 My Outlook:
$RENDER could remain under bearish pressure through the end of 2026, while Q1 2027 may bring opportunities for gradual recovery.
Will this projection play out? Time will tell! 🎯
Not financial advice. This is a technical model, not a guaranteed prediction.
#RENDER #RenderNetwork #CryptoAnalysis #BinanceSquare
214

·
--
Bullish
See translation
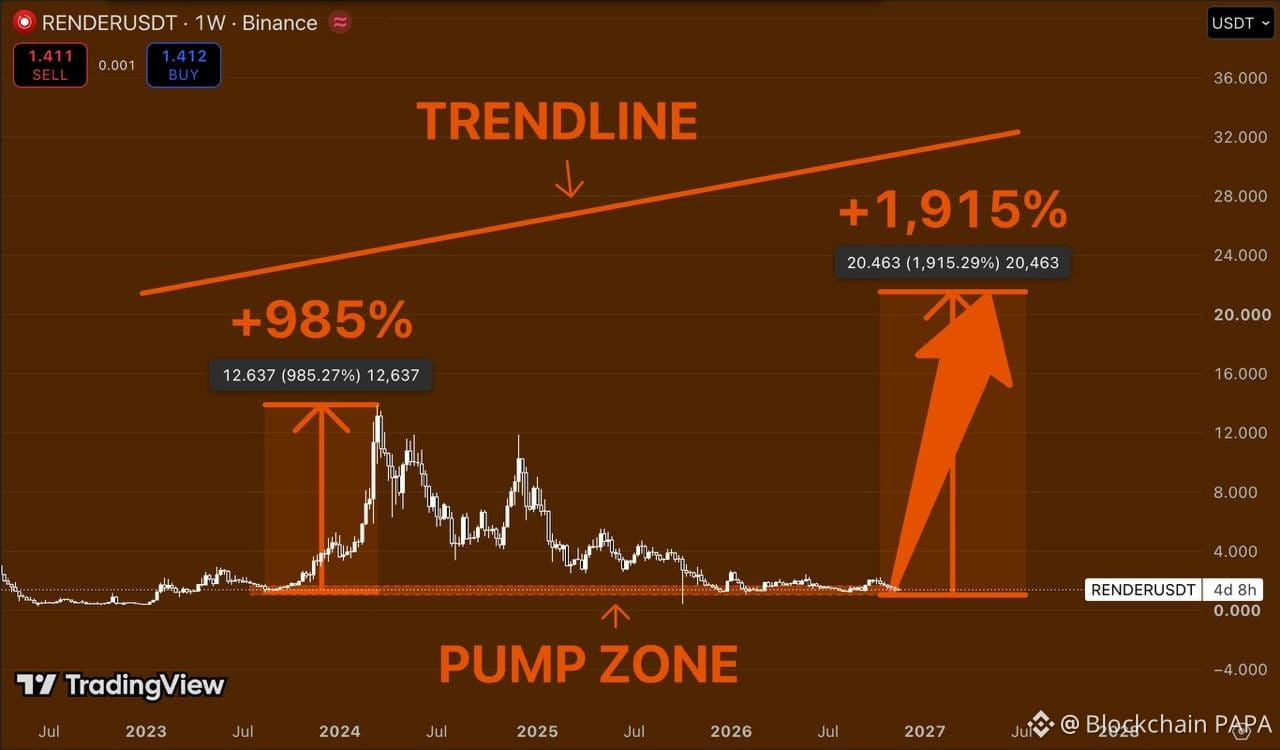
🚨 𝐑𝐄𝐍𝐃𝐄𝐑 𝐂𝐎𝐔𝐋𝐃 𝐁𝐄 𝐏𝐑𝐄𝐏𝐀𝐑𝐈𝐍𝐆 𝐅𝐎𝐑 𝐀 𝟏,𝟗𝟏𝟓% 𝐄𝐗𝐏𝐋𝐎𝐒𝐈𝐕𝐄 𝐑𝐔𝐍!
$RENDER is trading near $1.41, back around its historical accumulation zone the token previously rallied 985% from a similar area but could history repeat
Bulls need to reclaim $2 to strengthen the reversal setup and unlock the next major move
BULLISH TARGETS
TP2: $8
🔥 IS RENDER'S NEXT BIG COMEBACK LOADING
#render
The 1,915% projection is highly speculative Confirmation is everything
🚨 𝐑𝐄𝐍𝐃𝐄𝐑 𝐂𝐎𝐔𝐋𝐃 𝐁𝐄 𝐏𝐑𝐄𝐏𝐀𝐑𝐈𝐍𝐆 𝐅𝐎𝐑 𝐀 𝟏,𝟗𝟏𝟓% 𝐄𝐗𝐏𝐋𝐎𝐒𝐈𝐕𝐄 𝐑𝐔𝐍!
$RENDER is trading near $1.41, back around its historical accumulation zone the token previously rallied 985% from a similar area but could history repeat
Bulls need to reclaim $2 to strengthen the reversal setup and unlock the next major move
BULLISH TARGETS
TP2: $8
🔥 IS RENDER'S NEXT BIG COMEBACK LOADING
#render
The 1,915% projection is highly speculative Confirmation is everything
$RENDER is trading near $1.41, back around its historical accumulation zone the token previously rallied 985% from a similar area but could history repeat
Bulls need to reclaim $2 to strengthen the reversal setup and unlock the next major move
BULLISH TARGETS
TP2: $8
🔥 IS RENDER'S NEXT BIG COMEBACK LOADING
#render
The 1,915% projection is highly speculative Confirmation is everything
关德赞:
btc上涨,render才能上涨,脱离btc的影响,走出独立行情,价格才能创新高!!
2
4
428
·
--
See translation
$RENDER has one level that matters right now at $1.4610
It sits 3.8 percent higher than the current price of $1.4080
Clear that resistance and momentum shifts upward fast
Fail here and $1.3630 becomes the floor to watch
Open $RENDER and set an alert at that level
Break or reject 👀
#RENDER #PriceAction
$RENDER has one level that matters right now at $1.4610
It sits 3.8 percent higher than the current price of $1.4080
Clear that resistance and momentum shifts upward fast
Fail here and $1.3630 becomes the floor to watch
Open $RENDER and set an alert at that level
Break or reject 👀
#RENDER #PriceAction
It sits 3.8 percent higher than the current price of $1.4080
Clear that resistance and momentum shifts upward fast
Fail here and $1.3630 becomes the floor to watch
Open $RENDER and set an alert at that level
Break or reject 👀
#RENDER #PriceAction
1

·
--
See translation
$RENDER
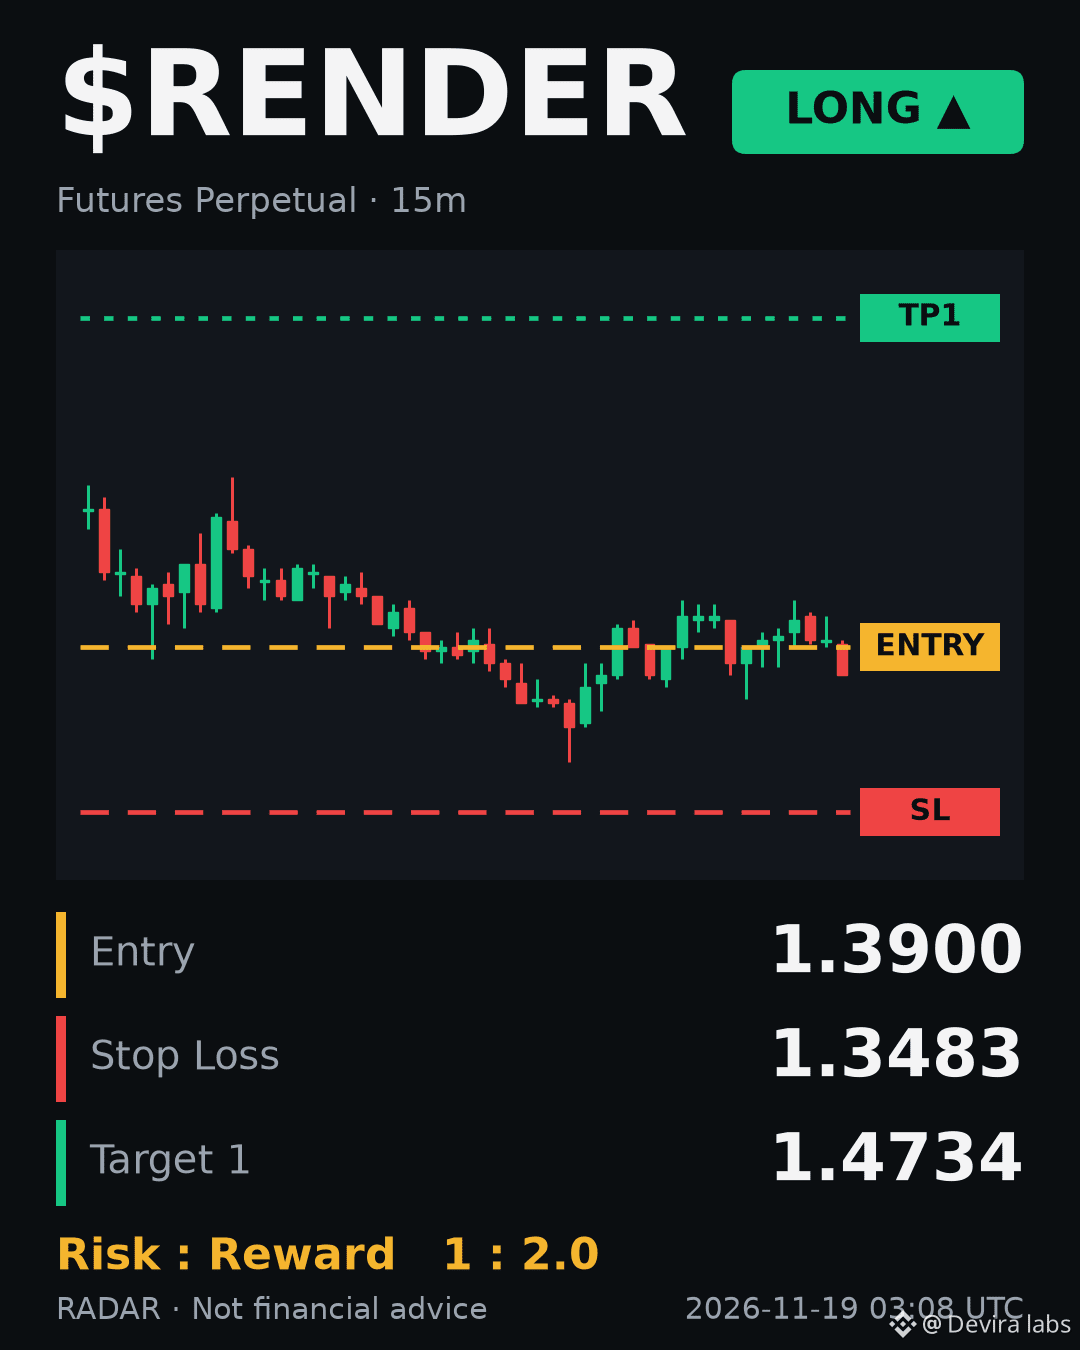
Price is setting up an interesting test around 1.39, showing moderate upside potential as buyers attempt to step in.
With the broader market still moving inside a range, follow-through could stay limited until clearer directional confirmation appears.
Entry: 1.39
SL: 1.3483
TP: 1.4734
R:R: 1:2.0
Risk:
• Range-bound conditions cap upside potential, requiring additional confirmation before continuation.
Are you taking the setup at 1.39 or waiting for a confirmed breakout first?
This is my personal trading plan, not financial advice. Risk management comes first.
#RADAR #Crypto #RENDER
$RENDER
Price is setting up an interesting test around 1.39, showing moderate upside potential as buyers attempt to step in.
With the broader market still moving inside a range, follow-through could stay limited until clearer directional confirmation appears.
Entry: 1.39
SL: 1.3483
TP: 1.4734
R:R: 1:2.0
Risk:
• Range-bound conditions cap upside potential, requiring additional confirmation before continuation.
Are you taking the setup at 1.39 or waiting for a confirmed breakout first?
This is my personal trading plan, not financial advice. Risk management comes first.
#RADAR #Crypto #RENDER
Price is setting up an interesting test around 1.39, showing moderate upside potential as buyers attempt to step in.
With the broader market still moving inside a range, follow-through could stay limited until clearer directional confirmation appears.
Entry: 1.39
SL: 1.3483
TP: 1.4734
R:R: 1:2.0
Risk:
• Range-bound conditions cap upside potential, requiring additional confirmation before continuation.
Are you taking the setup at 1.39 or waiting for a confirmed breakout first?
This is my personal trading plan, not financial advice. Risk management comes first.
#RADAR #Crypto #RENDER
32

See translation
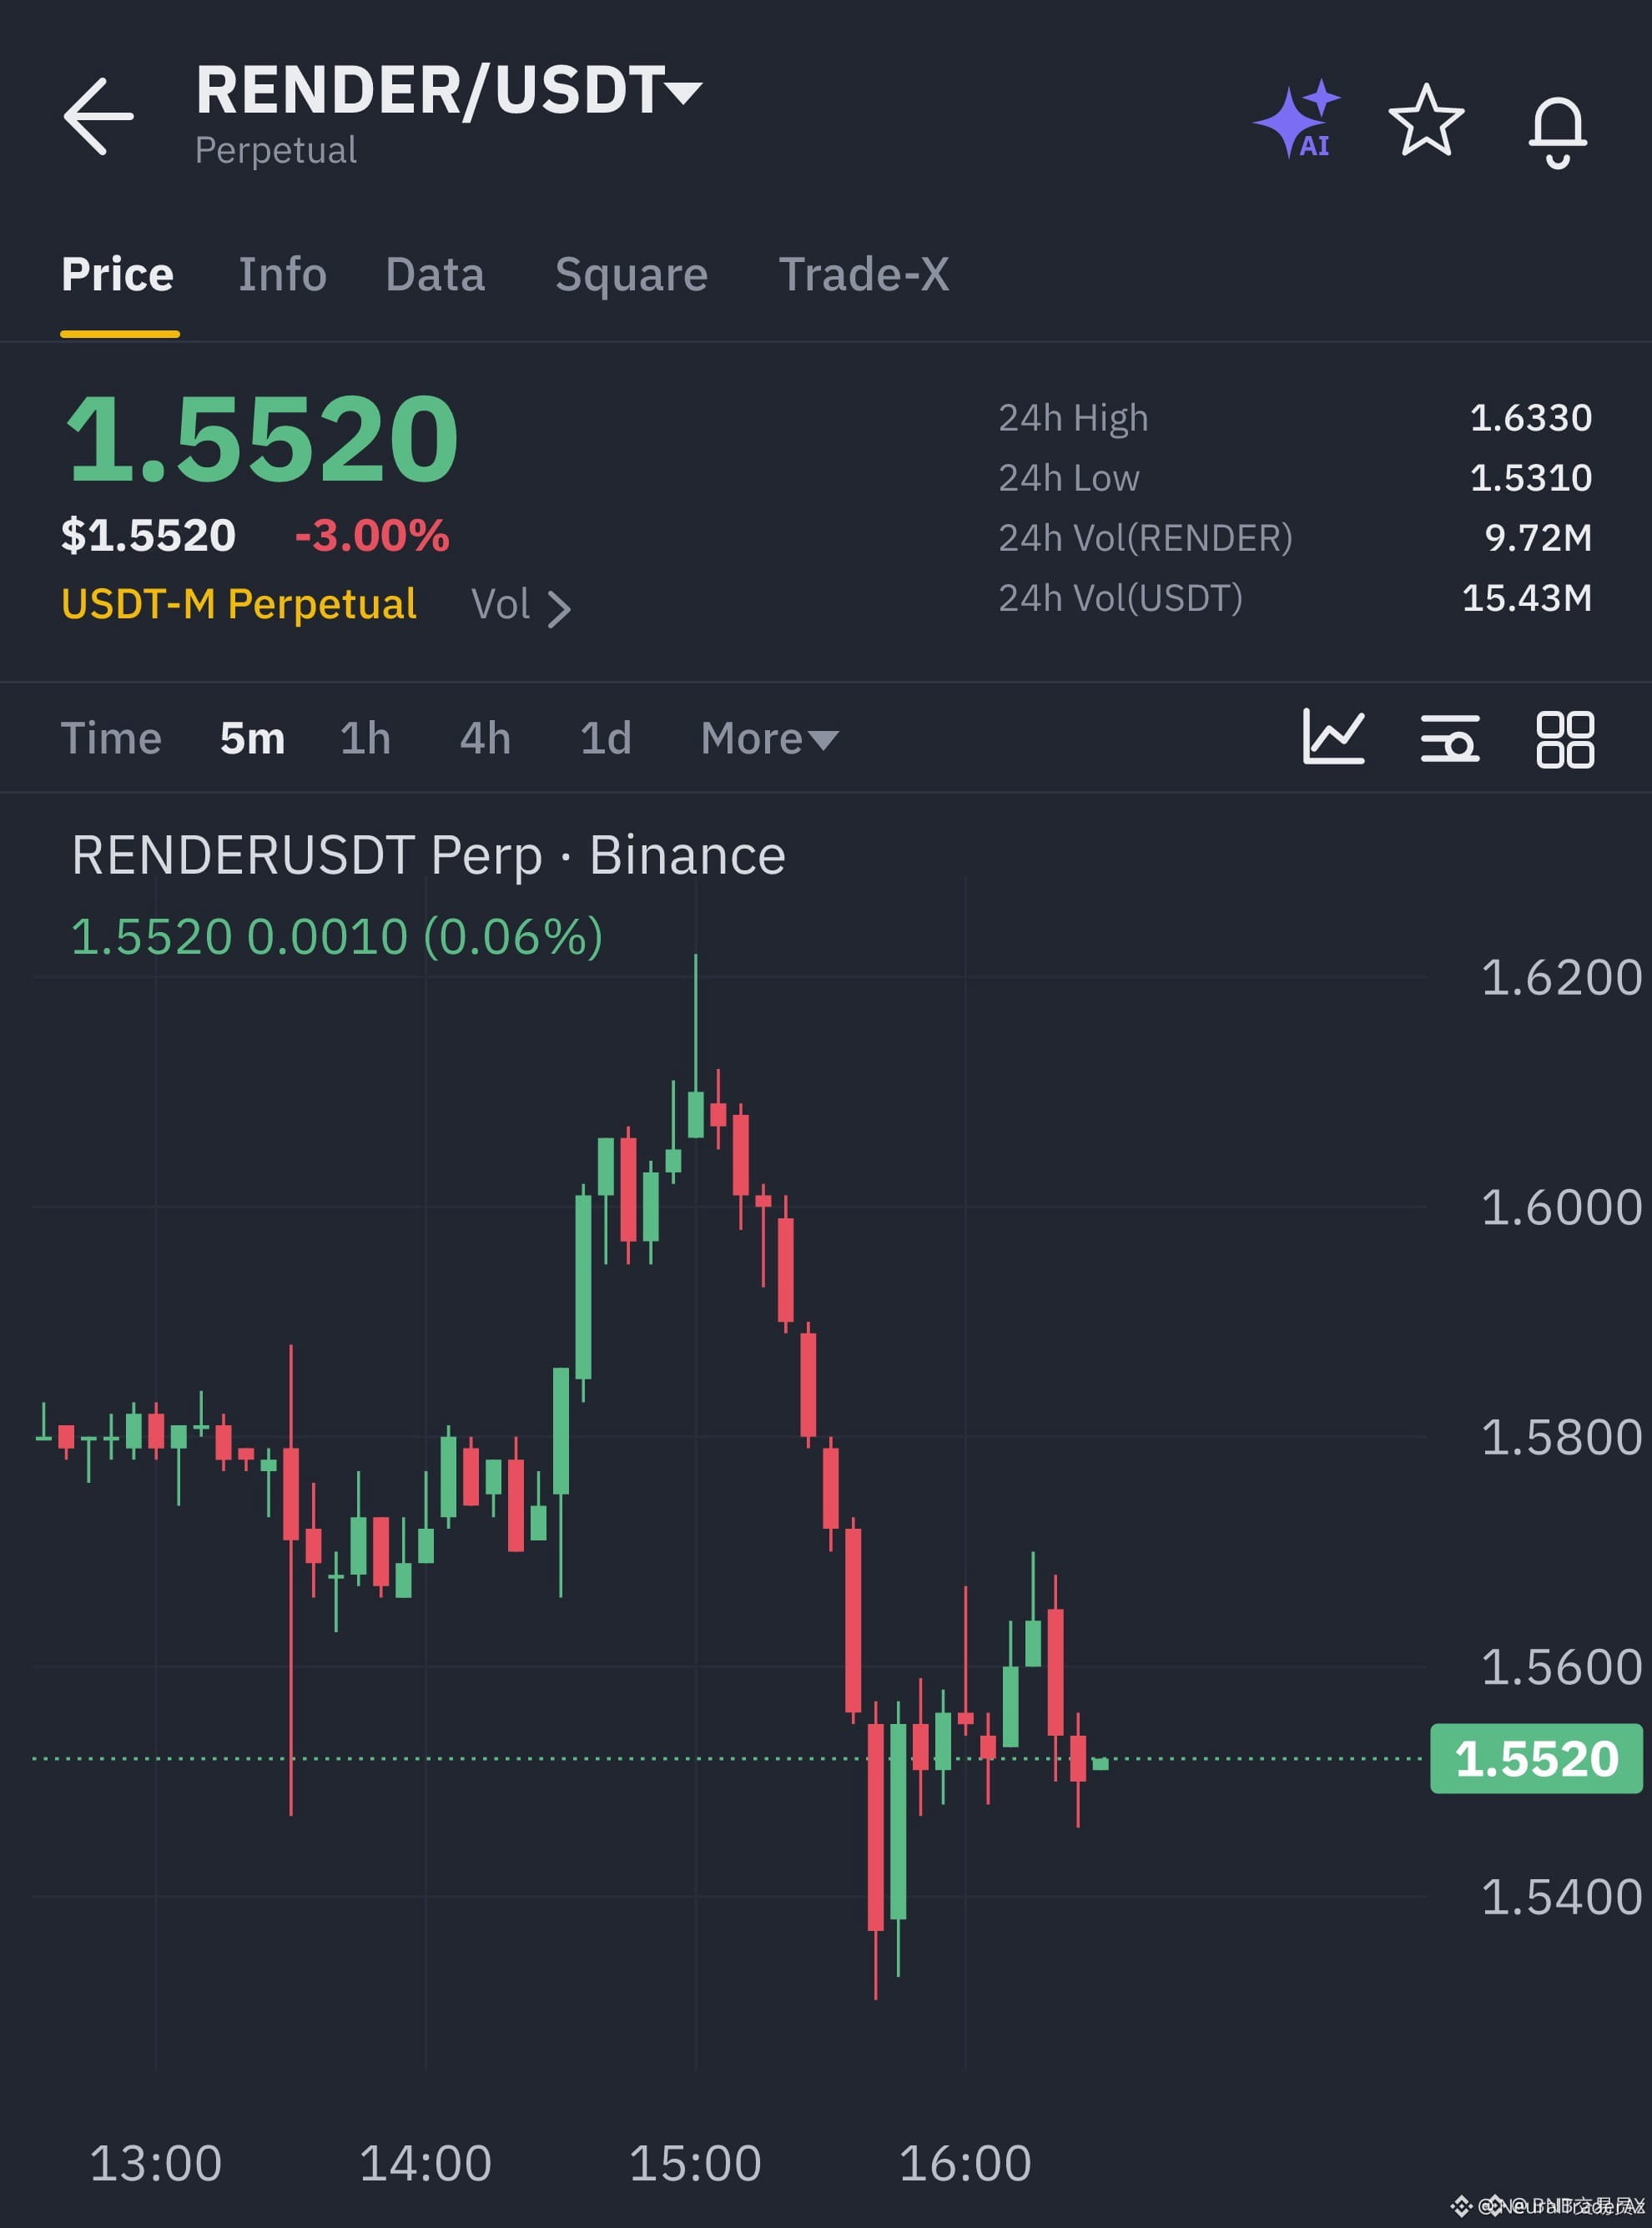
🚨 $RENDER REJECTED AT 1.6220 RESISTANCE AS BEARS SWEEP THE LOCAL LIQUIDITY ZONE! 📉
Entry: 1.5457–1.5523 ⚡
Target: 1.5012 🚀
Stop Loss: 1.5756 ⚠️
The overhead resistance at 1.6220 continues to act as an impenetrable ceiling, rejecting recent recovery attempts and leaving market structure structurally compromised. 📊 With consecutive red candles printing below this threshold, institutional order flow favors further downside expansion toward deeper liquidity pockets. ⚡
A decisive breakdown beneath 1.5310 will likely accelerate selling velocity as trapped longs capitulate into the move. 🔍 Are you looking to short this distribution phase or waiting for a structural sweep before positioning? 👇
⚠️ Not financial advice. Always manage your risk. 🛡️
🏷️ #RENDER #MOVR #JUP #ShortSetup
📉 🦈
🚨 $RENDER REJECTED AT 1.6220 RESISTANCE AS BEARS SWEEP THE LOCAL LIQUIDITY ZONE! 📉
Entry: 1.5457–1.5523 ⚡
Target: 1.5012 🚀
Stop Loss: 1.5756 ⚠️
The overhead resistance at 1.6220 continues to act as an impenetrable ceiling, rejecting recent recovery attempts and leaving market structure structurally compromised. 📊 With consecutive red candles printing below this threshold, institutional order flow favors further downside expansion toward deeper liquidity pockets. ⚡
A decisive breakdown beneath 1.5310 will likely accelerate selling velocity as trapped longs capitulate into the move. 🔍 Are you looking to short this distribution phase or waiting for a structural sweep before positioning? 👇
⚠️ Not financial advice. Always manage your risk. 🛡️
🏷️ #RENDER #MOVR #JUP #ShortSetup
📉 🦈
Entry: 1.5457–1.5523 ⚡
Target: 1.5012 🚀
Stop Loss: 1.5756 ⚠️
The overhead resistance at 1.6220 continues to act as an impenetrable ceiling, rejecting recent recovery attempts and leaving market structure structurally compromised. 📊 With consecutive red candles printing below this threshold, institutional order flow favors further downside expansion toward deeper liquidity pockets. ⚡
A decisive breakdown beneath 1.5310 will likely accelerate selling velocity as trapped longs capitulate into the move. 🔍 Are you looking to short this distribution phase or waiting for a structural sweep before positioning? 👇
⚠️ Not financial advice. Always manage your risk. 🛡️
🏷️ #RENDER #MOVR #JUP #ShortSetup
📉 🦈
3
·
--
See translation
🦈 $RENDER RETURNS TO THE LEGENDARY ACCUMULATION ZONE THAT SPARKED A 985% RALLY! 💥
Entry: 1.41 ⚡
Smart money is re-engaging the exact historical demand base where institutional accumulation preceded the massive 2023-2024 expansion phase. 📊 Price is currently probing structural lows around this major inflection point, testing whether long-term holders are defending their positions or yielding to late-stage distribution pressure. 🌊
Market structure suggests we are testing a critical institutional footprint rather than a random retail bottom-fishing attempt. 💡 Are you scaling into spot inventory here or waiting for confirmation on lower timeframes? 👇
⚠️ Not financial advice. Always manage your risk. 🛡️
🏷️ #RENDER #SmartMoney #Accumulation #Crypto
🦈 ⚖️
🦈 $RENDER RETURNS TO THE LEGENDARY ACCUMULATION ZONE THAT SPARKED A 985% RALLY! 💥
Entry: 1.41 ⚡
Smart money is re-engaging the exact historical demand base where institutional accumulation preceded the massive 2023-2024 expansion phase. 📊 Price is currently probing structural lows around this major inflection point, testing whether long-term holders are defending their positions or yielding to late-stage distribution pressure. 🌊
Market structure suggests we are testing a critical institutional footprint rather than a random retail bottom-fishing attempt. 💡 Are you scaling into spot inventory here or waiting for confirmation on lower timeframes? 👇
⚠️ Not financial advice. Always manage your risk. 🛡️
🏷️ #RENDER #SmartMoney #Accumulation #Crypto
🦈 ⚖️
Entry: 1.41 ⚡
Smart money is re-engaging the exact historical demand base where institutional accumulation preceded the massive 2023-2024 expansion phase. 📊 Price is currently probing structural lows around this major inflection point, testing whether long-term holders are defending their positions or yielding to late-stage distribution pressure. 🌊
Market structure suggests we are testing a critical institutional footprint rather than a random retail bottom-fishing attempt. 💡 Are you scaling into spot inventory here or waiting for confirmation on lower timeframes? 👇
⚠️ Not financial advice. Always manage your risk. 🛡️
🏷️ #RENDER #SmartMoney #Accumulation #Crypto
🦈 ⚖️
16

See translation
🦈 $RENDER RETURNS TO THE HISTORIC ACCUMULATION ZONE BEHIND THAT 985% RALLY! ⚡
Entry: $1.41 ⚡
Smart money loves returning to the exact footprints of past explosive expansions. This historic demand cluster at the current handle previously acted as the launching pad for a massive 985 percent structural markup. 📊
Patience defines the difference between catching falling knives and acquiring prime real estate during liquidity compression. Volume profiles indicate quiet accumulation while retail sentiment leans overly defensive. 🔍
💬 Are you accumulating this historical support zone or waiting for confirmation? 👇
⚠️ Not financial advice. Always manage your risk. 🛡️
🏷️ #RENDER #Accumulation #Altcoins #Crypto #MarketStructure
🔥 💎
🦈 $RENDER RETURNS TO THE HISTORIC ACCUMULATION ZONE BEHIND THAT 985% RALLY! ⚡
Entry: $1.41 ⚡
Smart money loves returning to the exact footprints of past explosive expansions. This historic demand cluster at the current handle previously acted as the launching pad for a massive 985 percent structural markup. 📊
Patience defines the difference between catching falling knives and acquiring prime real estate during liquidity compression. Volume profiles indicate quiet accumulation while retail sentiment leans overly defensive. 🔍
💬 Are you accumulating this historical support zone or waiting for confirmation? 👇
⚠️ Not financial advice. Always manage your risk. 🛡️
🏷️ #RENDER #Accumulation #Altcoins #Crypto #MarketStructure
🔥 💎
Entry: $1.41 ⚡
Smart money loves returning to the exact footprints of past explosive expansions. This historic demand cluster at the current handle previously acted as the launching pad for a massive 985 percent structural markup. 📊
Patience defines the difference between catching falling knives and acquiring prime real estate during liquidity compression. Volume profiles indicate quiet accumulation while retail sentiment leans overly defensive. 🔍
💬 Are you accumulating this historical support zone or waiting for confirmation? 👇
⚠️ Not financial advice. Always manage your risk. 🛡️
🏷️ #RENDER #Accumulation #Altcoins #Crypto #MarketStructure
🔥 💎
8

See translation
🔥 $RENDER /USDT – Trading Signal
💰 Price: ~$1.43
🔴 Bias: Bearish
🎯 Support: $1.406 / $1.297
🚀 Resistance: $1.516 / $1.566
Entry: Wait for confirmed breakout or rejection.
⚠️ Use Stop-Loss. Manage risk.
#RENDER #Crypto #BinanceSquare #TradingSignals
🔥 $RENDER /USDT – Trading Signal
💰 Price: ~$1.43
🔴 Bias: Bearish
🎯 Support: $1.406 / $1.297
🚀 Resistance: $1.516 / $1.566
Entry: Wait for confirmed breakout or rejection.
⚠️ Use Stop-Loss. Manage risk.
#RENDER #Crypto #BinanceSquare #TradingSignals
💰 Price: ~$1.43
🔴 Bias: Bearish
🎯 Support: $1.406 / $1.297
🚀 Resistance: $1.516 / $1.566
Entry: Wait for confirmed breakout or rejection.
⚠️ Use Stop-Loss. Manage risk.
#RENDER #Crypto #BinanceSquare #TradingSignals
1
52

·
--
🚨 $RENDER: KEY RESISTANCE TEST - ENTRY STRATEGY ⚡
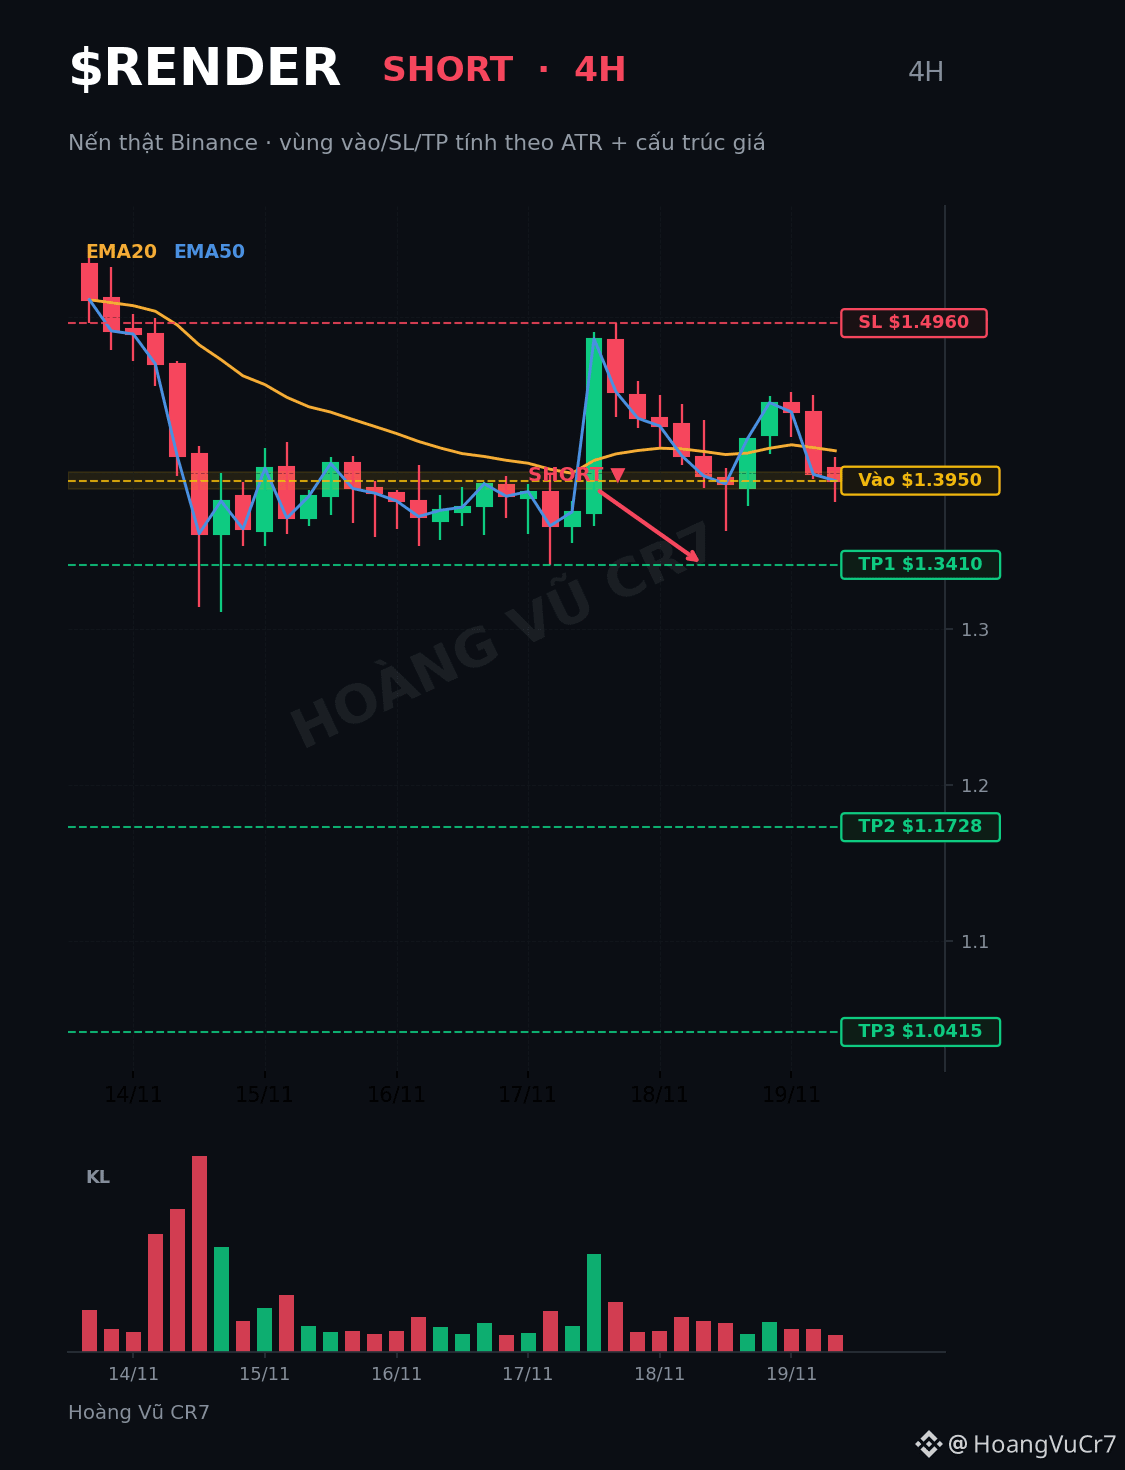
$RENDER is trading around $1.3950 after a 24-hour decline of 9.06%. On the H4 chart, candles are consolidating around the EMA band. Buyers and sellers are locked in a fierce battle, leaving the crowd gripped by fear and potentially leading to a shakeout of weak hands before a new trend takes shape.
Practical strategy: Patiently watch the price reaction at the strong support level of $1.3410 and the key resistance zone at $1.4960. If the price holds above support and volume spikes, this could be a good opportunity to accumulate at a favorable price. Conversely, if it reaches resistance but fails to break through, risk management is essential.
A classic shakeout or a bull trap? Share your thoughts below and follow Hoàng Vũ CR7 so you don’t miss any money flow alerts! 💬
#BinanceSquare #Write2Earn #RENDER #Crypto #TradingSignals
(Personal opinion, not investment advice - DYOR)
🚨 $RENDER : KEY RESISTANCE TEST - ENTRY STRATEGY ⚡
$RENDER is trading around $1.3950 after a 24-hour decline of 9.06%. On the H4 chart, candles are consolidating around the EMA band. Buyers and sellers are locked in a fierce battle, leaving the crowd gripped by fear and potentially leading to a shakeout of weak hands before a new trend takes shape.
Practical strategy: Patiently watch the price reaction at the strong support level of $1.3410 and the key resistance zone at $1.4960. If the price holds above support and volume spikes, this could be a good opportunity to accumulate at a favorable price. Conversely, if it reaches resistance but fails to break through, risk management is essential.
A classic shakeout or a bull trap? Share your thoughts below and follow Hoàng Vũ CR7 so you don’t miss any money flow alerts! 💬
#BinanceSquare #Write2Earn #RENDER #Crypto #TradingSignals
(Personal opinion, not investment advice - DYOR)
$RENDER is trading around $1.3950 after a 24-hour decline of 9.06%. On the H4 chart, candles are consolidating around the EMA band. Buyers and sellers are locked in a fierce battle, leaving the crowd gripped by fear and potentially leading to a shakeout of weak hands before a new trend takes shape.
Practical strategy: Patiently watch the price reaction at the strong support level of $1.3410 and the key resistance zone at $1.4960. If the price holds above support and volume spikes, this could be a good opportunity to accumulate at a favorable price. Conversely, if it reaches resistance but fails to break through, risk management is essential.
A classic shakeout or a bull trap? Share your thoughts below and follow Hoàng Vũ CR7 so you don’t miss any money flow alerts! 💬
#BinanceSquare #Write2Earn #RENDER #Crypto #TradingSignals
(Personal opinion, not investment advice - DYOR)
74
Log in to explore more content
Join global crypto users on Binance Square
⚡️ Get latest and useful information about crypto.
💬 Trusted by the world’s largest crypto exchange.
👍 Discover real insights from verified creators.
Email / Phone number
Trending Topics
1
#CanBTCReboundAfterFallingBelow60K?
88,137 views
486 Discussing
2
#GlobalStocksFaceLongestLosingStreakSince2023
43,509 views
487 Discussing
3
#AnthropicPlungesTowardIPOPriceonDay2
12,329 views
189 Discussing
4
#GaoTengBitcoinETFListsOnHKEX
33,714 views
386 Discussing
5
#TradFiForBeginners
995,952 views
5,802 Discussing
6
#NvidiaBoardReportedlySplitOverHuang’sReturn
385,950 views
2,572 Discussing
7
#TetherBurns8BillionUSDTInPast20Days
36,882 views
155 Discussing
8
#BitcoinWalletSignatureFlawExploitableWithinSeconds
10,573 views
74 Discussing
9
#CanGTA6'sLaunchLiftTTWOShares?
323,881 views
1,802 Discussing
10
#HongKongProposesSFCLicensingForFourVirtualAssetServices
1,981 views
36 Discussing