
#chartsniper
chartsniper
118,444 views
507 Discussing
Hot
Latest

·
--
Article
See translation
Bitcoin Is Coiling Below $77K: The Level That Decides the Next $3,000 Move$BTC
{future}(BTCUSDT)
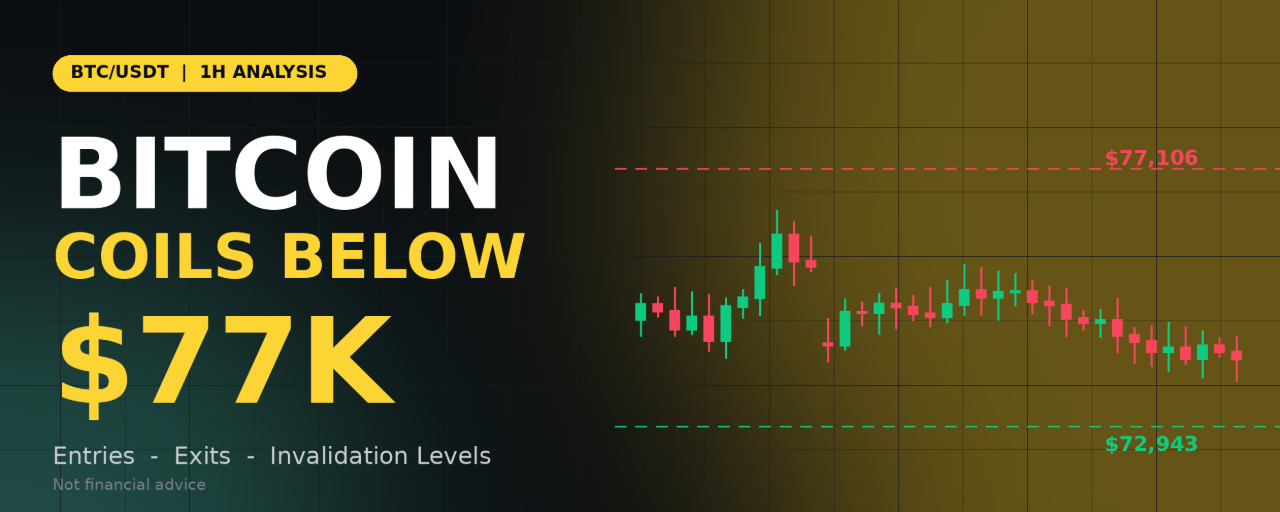
Bitcoin is trading near $75,609, locked in a tight consolidation after one of the sharpest rejections of the month. The market printed a Higher High near $81,000 on November 5, then dropped hard and has since been drifting sideways. Quiet price action after a violent move is rarely the end of the story. This article maps the levels that matter and the scenarios traders should be ready for.
What the 1H Chart Is Telling Us
Structure is still technically intact, but momentum has shifted. The chart shows a sequence of Higher Low, Lower High, Higher High, and then a new Higher Low near $74,700. The latest Higher Low is the most important swing point on the chart. As long as it holds, buyers still have a structural argument. If it breaks, the structure flips bearish.The rejection from $81K was aggressive. The drop from the Higher High came in one strong red move, leaving a stack of bearish Fair Value Gaps (FVGs) between roughly $77,100 and $79,000. These imbalances act as supply zones. Price tends to revisit them before deciding on direction.Price sits below the 38.2% Fibonacci retracement. Measured from the Higher Low (about $74,700) to the Higher High (about $81,000), the key retracement levels are:
38.2% near $77,100 (also a major horizontal level) 50% near $77,850 61.8% near $78,600
Bitcoin has failed to reclaim even the 38.2% level. That is a sign of weak recovery strength.
A tight range is building energy. Price is compressing between about $75,300 and $76,100, with small FVGs forming inside the range. Compression like this usually resolves with an expansion move.
Key Levels to Watch $81,582 – Major resistance. Macro ceiling and the area where the last rally failed. $80,018 – Resistance. Previous breakdown zone and the top of the supply area. $77,106 – Pivot resistance. The 38.2% Fib and the level bulls must reclaim. $75,000 – Psychological support. Sits just above the Higher Low. $74,700 – Structural support. The swing low that protects bullish structure. $72,943 – Major support. The next strong demand zone, marked by the green line. Trade Scenarios Scenario A: Short the Rejection (Primary Setup)
The higher-probability idea while price stays below $77,106 is to sell strength into resistance rather than chase weakness.
Entry: $76,600 to $77,100 on a retest with a visible rejection (upper wicks, bearish 1H close) Stop loss: $77,900 (above the 50% Fib and the FVG cluster) Take profit 1: $75,300 Take profit 2: $74,700 Take profit 3: $72,950
Risk to reward from the middle of the entry zone to the second target is roughly 1:2, improving to better than 1:3 if the third target is reached.
Scenario B: Breakdown Continuation Short
If the range collapses, momentum traders can join the move.
Trigger: A 1H candle close below $74,700 Entry: $74,500 to $74,700 (preferably on a retest of the broken level from below) Stop loss: $75,500 Take profit 1: $73,800 Take profit 2: $72,950
A clean break of the Higher Low would signal a structural shift and open the path to the $72.9K demand zone.
Scenario C: Support Bounce Long
Buyers become interesting only near strong demand.
Entry: $72,900 to $73,400, only after a rejection or reclaim (a wick below support that closes back above it) Stop loss: $72,300 Take profit 1: $74,700 Take profit 2: $75,800 Scenario D: Bullish Reclaim Long
The bullish case needs proof first.
Trigger: Two consecutive 1H closes above $77,106 Entry: Retest of $77,100 to $77,300 holding as support Stop loss: $76,400 Take profit 1: $78,600 Take profit 2: $80,000 Take profit 3: $81,500
If price pushes through $77,106 and then $77,900, the bearish FVG zone is being absorbed and the Higher High at $81K comes back into play.
Invalidation: When to Step Aside The short idea is invalid if price closes above $77,900 on the 1H chart. The bullish structure is invalid if price closes below $74,700. If price stays inside $75,300 to $76,100, the best trade is often no trade. Let the range break first. Risk Management Rules Risk 1% to 2% of your account per trade at most. Use stop losses on every position. Do not move them further away. Take partial profits at the first target and move the stop to break-even. Avoid high leverage in a compression range. Fake breakouts are common before the real move. Watch for volatility around major US economic news and weekend liquidity gaps. Final Thoughts
Bitcoin is at a decision point. Below $77,106 the bias leans cautious, with rallies likely to meet supply. A loss of $74,700 would confirm weakness and target $72,943. A reclaim of $77,106 would shift momentum back toward the bulls. Patience and discipline matter more than prediction here. Let the levels do the talking and trade the reaction, not the guess.
Disclaimer: This article is for educational and informational purposes only and is not financial advice. Cryptocurrency trading carries a high level of risk and may not be suitable for all investors. Entry and exit levels are based on technical analysis of a single chart and can fail. Always do your own research and never risk more than you can afford to lose.
@Binance_Square_Official #BinanceReopensWithdrawalsForHYPE&APT #SouthKoreaDraftLawTargets15To20%ShareholderCap #TradFiForBeginners #Binance #ChartSniper
Bitcoin Is Coiling Below $77K: The Level That Decides the Next $3,000 Move
$BTC
Bitcoin is trading near $75,609, locked in a tight consolidation after one of the sharpest rejections of the month. The market printed a Higher High near $81,000 on November 5, then dropped hard and has since been drifting sideways. Quiet price action after a violent move is rarely the end of the story. This article maps the levels that matter and the scenarios traders should be ready for.
What the 1H Chart Is Telling Us
Structure is still technically intact, but momentum has shifted. The chart shows a sequence of Higher Low, Lower High, Higher High, and then a new Higher Low near $74,700. The latest Higher Low is the most important swing point on the chart. As long as it holds, buyers still have a structural argument. If it breaks, the structure flips bearish.The rejection from $81K was aggressive. The drop from the Higher High came in one strong red move, leaving a stack of bearish Fair Value Gaps (FVGs) between roughly $77,100 and $79,000. These imbalances act as supply zones. Price tends to revisit them before deciding on direction.Price sits below the 38.2% Fibonacci retracement. Measured from the Higher Low (about $74,700) to the Higher High (about $81,000), the key retracement levels are:
38.2% near $77,100 (also a major horizontal level) 50% near $77,850 61.8% near $78,600
Bitcoin has failed to reclaim even the 38.2% level. That is a sign of weak recovery strength.
A tight range is building energy. Price is compressing between about $75,300 and $76,100, with small FVGs forming inside the range. Compression like this usually resolves with an expansion move.
Key Levels to Watch $81,582 – Major resistance. Macro ceiling and the area where the last rally failed. $80,018 – Resistance. Previous breakdown zone and the top of the supply area. $77,106 – Pivot resistance. The 38.2% Fib and the level bulls must reclaim. $75,000 – Psychological support. Sits just above the Higher Low. $74,700 – Structural support. The swing low that protects bullish structure. $72,943 – Major support. The next strong demand zone, marked by the green line. Trade Scenarios Scenario A: Short the Rejection (Primary Setup)
The higher-probability idea while price stays below $77,106 is to sell strength into resistance rather than chase weakness.
Entry: $76,600 to $77,100 on a retest with a visible rejection (upper wicks, bearish 1H close) Stop loss: $77,900 (above the 50% Fib and the FVG cluster) Take profit 1: $75,300 Take profit 2: $74,700 Take profit 3: $72,950
Risk to reward from the middle of the entry zone to the second target is roughly 1:2, improving to better than 1:3 if the third target is reached.
Scenario B: Breakdown Continuation Short
If the range collapses, momentum traders can join the move.
Trigger: A 1H candle close below $74,700 Entry: $74,500 to $74,700 (preferably on a retest of the broken level from below) Stop loss: $75,500 Take profit 1: $73,800 Take profit 2: $72,950
A clean break of the Higher Low would signal a structural shift and open the path to the $72.9K demand zone.
Scenario C: Support Bounce Long
Buyers become interesting only near strong demand.
Entry: $72,900 to $73,400, only after a rejection or reclaim (a wick below support that closes back above it) Stop loss: $72,300 Take profit 1: $74,700 Take profit 2: $75,800 Scenario D: Bullish Reclaim Long
The bullish case needs proof first.
Trigger: Two consecutive 1H closes above $77,106 Entry: Retest of $77,100 to $77,300 holding as support Stop loss: $76,400 Take profit 1: $78,600 Take profit 2: $80,000 Take profit 3: $81,500
If price pushes through $77,106 and then $77,900, the bearish FVG zone is being absorbed and the Higher High at $81K comes back into play.
Invalidation: When to Step Aside The short idea is invalid if price closes above $77,900 on the 1H chart. The bullish structure is invalid if price closes below $74,700. If price stays inside $75,300 to $76,100, the best trade is often no trade. Let the range break first. Risk Management Rules Risk 1% to 2% of your account per trade at most. Use stop losses on every position. Do not move them further away. Take partial profits at the first target and move the stop to break-even. Avoid high leverage in a compression range. Fake breakouts are common before the real move. Watch for volatility around major US economic news and weekend liquidity gaps. Final Thoughts
Bitcoin is at a decision point. Below $77,106 the bias leans cautious, with rallies likely to meet supply. A loss of $74,700 would confirm weakness and target $72,943. A reclaim of $77,106 would shift momentum back toward the bulls. Patience and discipline matter more than prediction here. Let the levels do the talking and trade the reaction, not the guess.
Disclaimer: This article is for educational and informational purposes only and is not financial advice. Cryptocurrency trading carries a high level of risk and may not be suitable for all investors. Entry and exit levels are based on technical analysis of a single chart and can fail. Always do your own research and never risk more than you can afford to lose.
@Binance Square Official #BinanceReopensWithdrawalsForHYPE&APT #SouthKoreaDraftLawTargets15To20%ShareholderCap #TradFiForBeginners #Binance #ChartSniper
Bitcoin is trading near $75,609, locked in a tight consolidation after one of the sharpest rejections of the month. The market printed a Higher High near $81,000 on November 5, then dropped hard and has since been drifting sideways. Quiet price action after a violent move is rarely the end of the story. This article maps the levels that matter and the scenarios traders should be ready for.
What the 1H Chart Is Telling Us
Structure is still technically intact, but momentum has shifted. The chart shows a sequence of Higher Low, Lower High, Higher High, and then a new Higher Low near $74,700. The latest Higher Low is the most important swing point on the chart. As long as it holds, buyers still have a structural argument. If it breaks, the structure flips bearish.The rejection from $81K was aggressive. The drop from the Higher High came in one strong red move, leaving a stack of bearish Fair Value Gaps (FVGs) between roughly $77,100 and $79,000. These imbalances act as supply zones. Price tends to revisit them before deciding on direction.Price sits below the 38.2% Fibonacci retracement. Measured from the Higher Low (about $74,700) to the Higher High (about $81,000), the key retracement levels are:
38.2% near $77,100 (also a major horizontal level) 50% near $77,850 61.8% near $78,600
Bitcoin has failed to reclaim even the 38.2% level. That is a sign of weak recovery strength.
A tight range is building energy. Price is compressing between about $75,300 and $76,100, with small FVGs forming inside the range. Compression like this usually resolves with an expansion move.
Key Levels to Watch $81,582 – Major resistance. Macro ceiling and the area where the last rally failed. $80,018 – Resistance. Previous breakdown zone and the top of the supply area. $77,106 – Pivot resistance. The 38.2% Fib and the level bulls must reclaim. $75,000 – Psychological support. Sits just above the Higher Low. $74,700 – Structural support. The swing low that protects bullish structure. $72,943 – Major support. The next strong demand zone, marked by the green line. Trade Scenarios Scenario A: Short the Rejection (Primary Setup)
The higher-probability idea while price stays below $77,106 is to sell strength into resistance rather than chase weakness.
Entry: $76,600 to $77,100 on a retest with a visible rejection (upper wicks, bearish 1H close) Stop loss: $77,900 (above the 50% Fib and the FVG cluster) Take profit 1: $75,300 Take profit 2: $74,700 Take profit 3: $72,950
Risk to reward from the middle of the entry zone to the second target is roughly 1:2, improving to better than 1:3 if the third target is reached.
Scenario B: Breakdown Continuation Short
If the range collapses, momentum traders can join the move.
Trigger: A 1H candle close below $74,700 Entry: $74,500 to $74,700 (preferably on a retest of the broken level from below) Stop loss: $75,500 Take profit 1: $73,800 Take profit 2: $72,950
A clean break of the Higher Low would signal a structural shift and open the path to the $72.9K demand zone.
Scenario C: Support Bounce Long
Buyers become interesting only near strong demand.
Entry: $72,900 to $73,400, only after a rejection or reclaim (a wick below support that closes back above it) Stop loss: $72,300 Take profit 1: $74,700 Take profit 2: $75,800 Scenario D: Bullish Reclaim Long
The bullish case needs proof first.
Trigger: Two consecutive 1H closes above $77,106 Entry: Retest of $77,100 to $77,300 holding as support Stop loss: $76,400 Take profit 1: $78,600 Take profit 2: $80,000 Take profit 3: $81,500
If price pushes through $77,106 and then $77,900, the bearish FVG zone is being absorbed and the Higher High at $81K comes back into play.
Invalidation: When to Step Aside The short idea is invalid if price closes above $77,900 on the 1H chart. The bullish structure is invalid if price closes below $74,700. If price stays inside $75,300 to $76,100, the best trade is often no trade. Let the range break first. Risk Management Rules Risk 1% to 2% of your account per trade at most. Use stop losses on every position. Do not move them further away. Take partial profits at the first target and move the stop to break-even. Avoid high leverage in a compression range. Fake breakouts are common before the real move. Watch for volatility around major US economic news and weekend liquidity gaps. Final Thoughts
Bitcoin is at a decision point. Below $77,106 the bias leans cautious, with rallies likely to meet supply. A loss of $74,700 would confirm weakness and target $72,943. A reclaim of $77,106 would shift momentum back toward the bulls. Patience and discipline matter more than prediction here. Let the levels do the talking and trade the reaction, not the guess.
Disclaimer: This article is for educational and informational purposes only and is not financial advice. Cryptocurrency trading carries a high level of risk and may not be suitable for all investors. Entry and exit levels are based on technical analysis of a single chart and can fail. Always do your own research and never risk more than you can afford to lose.
@Binance Square Official #BinanceReopensWithdrawalsForHYPE&APT #SouthKoreaDraftLawTargets15To20%ShareholderCap #TradFiForBeginners #Binance #ChartSniper
33
·
--
Article
See translation
IMX Is Balancing on a Trendline: The Break Will Decide Everything$IMX
{future}(IMXUSDT)
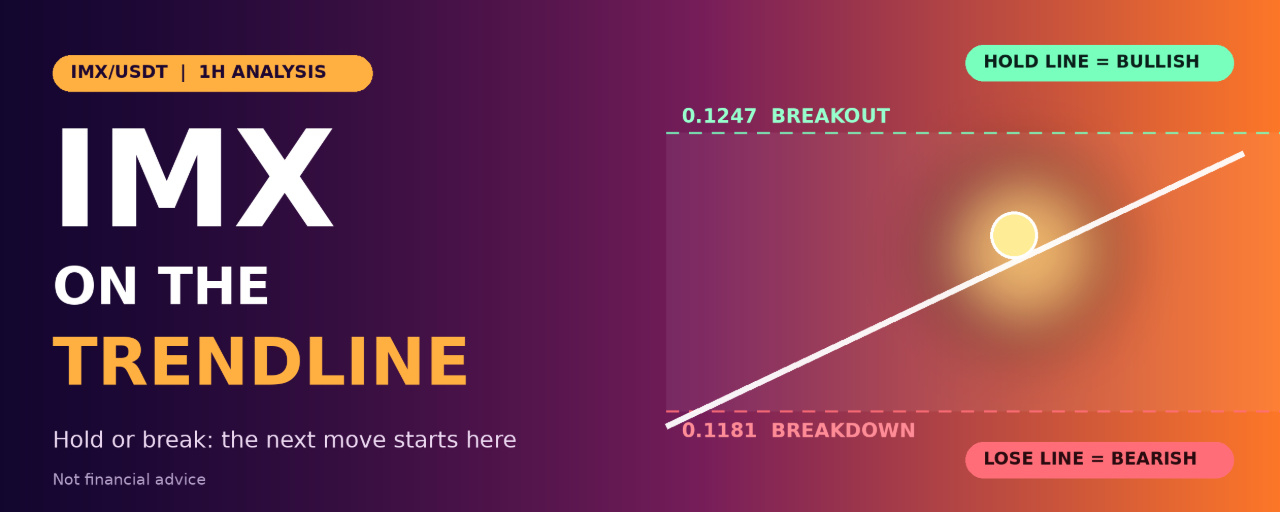
IMX is trading near $0.1199, sitting right on a rising trendline that has guided price since the November 5 low. At the same time, it is testing the 38.2% Fibonacci retracement, and it is trapped inside a box between about $0.1181 and $0.1247. Trendline, Fib level and range edge all meet here, which makes this one of the cleaner decision points on the board. Below is how to read it and how to trade both outcomes.
What the 1H Chart Is Telling Us
1. The trendline is the story. After the sharp drop to the Higher Low near $0.1132, IMX has been making a slow staircase upward along an ascending trendline. Price is touching that line again right now. Each touch that holds strengthens the line, but each touch also makes it more likely to fail.
2. Lower highs cap the upside. Despite the rising support, the highs have been getting rejected near $0.1230 and $0.1247. The latest wick to $0.1247 was sold quickly. This is a classic ascending-triangle style squeeze, with support rising into a ceiling that keeps rejecting price.
3. The 38.2% Fib is acting as the pivot. Measured across the recent move, the retracement levels are:
38.2% near $0.1197 (price is here now)50% near $0.1182 (lines up with the bottom of the box)61.8% near $0.1167
Holding 38.2% keeps momentum with the bulls. Losing it points to 50% and 61.8% as the next stops.
3. A small bullish Fair Value Gap (FVG) sits just below price. It lines up with the trendline and the 50% level, which makes the $0.1181 to $0.1190 area an important demand pocket.
Key Levels to Watch
$0.1265 – Higher High. The major swing high and final upside target.$0.1247 – Range top. Wick high and the ceiling bulls must break.$0.1230 – Lower high. First resistance on the way up.$0.1197 – 38.2% Fib. Current pivot, where price is sitting.$0.1181 – Range bottom and 50% Fib. The last line before the trendline fails.$0.1167 – 61.8% Fib. First downside target.$0.1132 – Higher Low. Structural support and the major downside target.
Scenario 1: Trendline Holds (Bullish Bounce and Breakout)
Buyers defend the line and push price back into the upper half of the range.
Bounce setup
Entry: $0.1190 to $0.1200, after a bullish 1H candle closes on or above the trendlineStop loss: $0.1174 (below the range bottom and 50% Fib)Take profit 1: $0.1230Take profit 2: $0.1247Take profit 3: $0.1265
Risk to reward from the middle of the entry zone to the second target is about 1:2.5.
Breakout setup
Trigger: A 1H close above $0.1247Entry: Retest of $0.1240 to $0.1247 holding as supportStop loss: $0.1222Take profit 1: $0.1265Take profit 2: $0.1290
A confirmed break above the range top would also flip the lower-high structure bullish, which is why the retest entry is worth waiting for.
Scenario 2: Trendline Breaks (Bearish Breakdown)
If sellers push price through the line and the range floor together, the squeeze resolves downward.
Trigger: A 1H candle close below $0.1181Entry: Retest of $0.1178 to $0.1181 from below, showing rejectionStop loss: $0.1198 (back above the trendline and 38.2% Fib)Take profit 1: $0.1167Take profit 2: $0.1150Take profit 3: $0.1132
Risk to reward is roughly 1:1.5 at the second target and 1:2.5 at the third. A trendline break after several touches often brings a fast move, so consider moving the stop to break-even after the first target.
Invalidation: When to Step Aside
The bullish idea is invalid if price closes below $0.1181.The bearish idea is invalid if price closes back above $0.1198 after the breakdown.A wick through the trendline that closes back above it is a fake-out, not a break.If price keeps chopping between $0.1181 and $0.1247, there is no edge. Wait for a close outside the box.
Risk Management Rules
Risk 1% to 2% of your account per trade at most.Always use a stop loss and never widen it.Take partial profits at the first target and move the stop to break-even.IMX is a small-cap altcoin and can spike on thin liquidity, so keep leverage low.Check Bitcoin before entering. A sharp BTC move can override any altcoin setup.
Final Thoughts
IMX has reached the point where the trendline, the 38.2% Fib and the range floor all stack together. If buyers hold this zone, a move toward $0.1247 and the $0.1265 high is on the table. If the line breaks with a close below $0.1181, the path opens toward $0.1167 and the $0.1132 low. Do not predict. Wait for the close, enter on the retest, and let the stop loss do its job.
Disclaimer: This article is for educational and informational purposes only and is not financial advice. Cryptocurrency trading carries a high level of risk and may not be suitable for all investors. Entry and exit levels are based on technical analysis of a single chart and can fail. Always do your own research and never risk more than you can afford to lose.
@Binance_Square_Official #BinanceReopensWithdrawalsForHYPE&APT #SouthKoreaDraftLawTargets15To20%ShareholderCap #TradFiForBeginners #Binance #ChartSniper
IMX Is Balancing on a Trendline: The Break Will Decide Everything
$IMX
IMX is trading near $0.1199, sitting right on a rising trendline that has guided price since the November 5 low. At the same time, it is testing the 38.2% Fibonacci retracement, and it is trapped inside a box between about $0.1181 and $0.1247. Trendline, Fib level and range edge all meet here, which makes this one of the cleaner decision points on the board. Below is how to read it and how to trade both outcomes.
What the 1H Chart Is Telling Us
1. The trendline is the story. After the sharp drop to the Higher Low near $0.1132, IMX has been making a slow staircase upward along an ascending trendline. Price is touching that line again right now. Each touch that holds strengthens the line, but each touch also makes it more likely to fail.
2. Lower highs cap the upside. Despite the rising support, the highs have been getting rejected near $0.1230 and $0.1247. The latest wick to $0.1247 was sold quickly. This is a classic ascending-triangle style squeeze, with support rising into a ceiling that keeps rejecting price.
3. The 38.2% Fib is acting as the pivot. Measured across the recent move, the retracement levels are:
38.2% near $0.1197 (price is here now)50% near $0.1182 (lines up with the bottom of the box)61.8% near $0.1167
Holding 38.2% keeps momentum with the bulls. Losing it points to 50% and 61.8% as the next stops.
3. A small bullish Fair Value Gap (FVG) sits just below price. It lines up with the trendline and the 50% level, which makes the $0.1181 to $0.1190 area an important demand pocket.
Key Levels to Watch
$0.1265 – Higher High. The major swing high and final upside target.$0.1247 – Range top. Wick high and the ceiling bulls must break.$0.1230 – Lower high. First resistance on the way up.$0.1197 – 38.2% Fib. Current pivot, where price is sitting.$0.1181 – Range bottom and 50% Fib. The last line before the trendline fails.$0.1167 – 61.8% Fib. First downside target.$0.1132 – Higher Low. Structural support and the major downside target.
Scenario 1: Trendline Holds (Bullish Bounce and Breakout)
Buyers defend the line and push price back into the upper half of the range.
Bounce setup
Entry: $0.1190 to $0.1200, after a bullish 1H candle closes on or above the trendlineStop loss: $0.1174 (below the range bottom and 50% Fib)Take profit 1: $0.1230Take profit 2: $0.1247Take profit 3: $0.1265
Risk to reward from the middle of the entry zone to the second target is about 1:2.5.
Breakout setup
Trigger: A 1H close above $0.1247Entry: Retest of $0.1240 to $0.1247 holding as supportStop loss: $0.1222Take profit 1: $0.1265Take profit 2: $0.1290
A confirmed break above the range top would also flip the lower-high structure bullish, which is why the retest entry is worth waiting for.
Scenario 2: Trendline Breaks (Bearish Breakdown)
If sellers push price through the line and the range floor together, the squeeze resolves downward.
Trigger: A 1H candle close below $0.1181Entry: Retest of $0.1178 to $0.1181 from below, showing rejectionStop loss: $0.1198 (back above the trendline and 38.2% Fib)Take profit 1: $0.1167Take profit 2: $0.1150Take profit 3: $0.1132
Risk to reward is roughly 1:1.5 at the second target and 1:2.5 at the third. A trendline break after several touches often brings a fast move, so consider moving the stop to break-even after the first target.
Invalidation: When to Step Aside
The bullish idea is invalid if price closes below $0.1181.The bearish idea is invalid if price closes back above $0.1198 after the breakdown.A wick through the trendline that closes back above it is a fake-out, not a break.If price keeps chopping between $0.1181 and $0.1247, there is no edge. Wait for a close outside the box.
Risk Management Rules
Risk 1% to 2% of your account per trade at most.Always use a stop loss and never widen it.Take partial profits at the first target and move the stop to break-even.IMX is a small-cap altcoin and can spike on thin liquidity, so keep leverage low.Check Bitcoin before entering. A sharp BTC move can override any altcoin setup.
Final Thoughts
IMX has reached the point where the trendline, the 38.2% Fib and the range floor all stack together. If buyers hold this zone, a move toward $0.1247 and the $0.1265 high is on the table. If the line breaks with a close below $0.1181, the path opens toward $0.1167 and the $0.1132 low. Do not predict. Wait for the close, enter on the retest, and let the stop loss do its job.
Disclaimer: This article is for educational and informational purposes only and is not financial advice. Cryptocurrency trading carries a high level of risk and may not be suitable for all investors. Entry and exit levels are based on technical analysis of a single chart and can fail. Always do your own research and never risk more than you can afford to lose.
@Binance Square Official #BinanceReopensWithdrawalsForHYPE&APT #SouthKoreaDraftLawTargets15To20%ShareholderCap #TradFiForBeginners #Binance #ChartSniper
IMX is trading near $0.1199, sitting right on a rising trendline that has guided price since the November 5 low. At the same time, it is testing the 38.2% Fibonacci retracement, and it is trapped inside a box between about $0.1181 and $0.1247. Trendline, Fib level and range edge all meet here, which makes this one of the cleaner decision points on the board. Below is how to read it and how to trade both outcomes.
What the 1H Chart Is Telling Us
1. The trendline is the story. After the sharp drop to the Higher Low near $0.1132, IMX has been making a slow staircase upward along an ascending trendline. Price is touching that line again right now. Each touch that holds strengthens the line, but each touch also makes it more likely to fail.
2. Lower highs cap the upside. Despite the rising support, the highs have been getting rejected near $0.1230 and $0.1247. The latest wick to $0.1247 was sold quickly. This is a classic ascending-triangle style squeeze, with support rising into a ceiling that keeps rejecting price.
3. The 38.2% Fib is acting as the pivot. Measured across the recent move, the retracement levels are:
38.2% near $0.1197 (price is here now)50% near $0.1182 (lines up with the bottom of the box)61.8% near $0.1167
Holding 38.2% keeps momentum with the bulls. Losing it points to 50% and 61.8% as the next stops.
3. A small bullish Fair Value Gap (FVG) sits just below price. It lines up with the trendline and the 50% level, which makes the $0.1181 to $0.1190 area an important demand pocket.
Key Levels to Watch
$0.1265 – Higher High. The major swing high and final upside target.$0.1247 – Range top. Wick high and the ceiling bulls must break.$0.1230 – Lower high. First resistance on the way up.$0.1197 – 38.2% Fib. Current pivot, where price is sitting.$0.1181 – Range bottom and 50% Fib. The last line before the trendline fails.$0.1167 – 61.8% Fib. First downside target.$0.1132 – Higher Low. Structural support and the major downside target.
Scenario 1: Trendline Holds (Bullish Bounce and Breakout)
Buyers defend the line and push price back into the upper half of the range.
Bounce setup
Entry: $0.1190 to $0.1200, after a bullish 1H candle closes on or above the trendlineStop loss: $0.1174 (below the range bottom and 50% Fib)Take profit 1: $0.1230Take profit 2: $0.1247Take profit 3: $0.1265
Risk to reward from the middle of the entry zone to the second target is about 1:2.5.
Breakout setup
Trigger: A 1H close above $0.1247Entry: Retest of $0.1240 to $0.1247 holding as supportStop loss: $0.1222Take profit 1: $0.1265Take profit 2: $0.1290
A confirmed break above the range top would also flip the lower-high structure bullish, which is why the retest entry is worth waiting for.
Scenario 2: Trendline Breaks (Bearish Breakdown)
If sellers push price through the line and the range floor together, the squeeze resolves downward.
Trigger: A 1H candle close below $0.1181Entry: Retest of $0.1178 to $0.1181 from below, showing rejectionStop loss: $0.1198 (back above the trendline and 38.2% Fib)Take profit 1: $0.1167Take profit 2: $0.1150Take profit 3: $0.1132
Risk to reward is roughly 1:1.5 at the second target and 1:2.5 at the third. A trendline break after several touches often brings a fast move, so consider moving the stop to break-even after the first target.
Invalidation: When to Step Aside
The bullish idea is invalid if price closes below $0.1181.The bearish idea is invalid if price closes back above $0.1198 after the breakdown.A wick through the trendline that closes back above it is a fake-out, not a break.If price keeps chopping between $0.1181 and $0.1247, there is no edge. Wait for a close outside the box.
Risk Management Rules
Risk 1% to 2% of your account per trade at most.Always use a stop loss and never widen it.Take partial profits at the first target and move the stop to break-even.IMX is a small-cap altcoin and can spike on thin liquidity, so keep leverage low.Check Bitcoin before entering. A sharp BTC move can override any altcoin setup.
Final Thoughts
IMX has reached the point where the trendline, the 38.2% Fib and the range floor all stack together. If buyers hold this zone, a move toward $0.1247 and the $0.1265 high is on the table. If the line breaks with a close below $0.1181, the path opens toward $0.1167 and the $0.1132 low. Do not predict. Wait for the close, enter on the retest, and let the stop loss do its job.
Disclaimer: This article is for educational and informational purposes only and is not financial advice. Cryptocurrency trading carries a high level of risk and may not be suitable for all investors. Entry and exit levels are based on technical analysis of a single chart and can fail. Always do your own research and never risk more than you can afford to lose.
@Binance Square Official #BinanceReopensWithdrawalsForHYPE&APT #SouthKoreaDraftLawTargets15To20%ShareholderCap #TradFiForBeginners #Binance #ChartSniper
56
·
--
Article
See translation
GMX at the Crossroads: One Break Decides the Next Big Move$GMX
{future}(GMXUSDT)
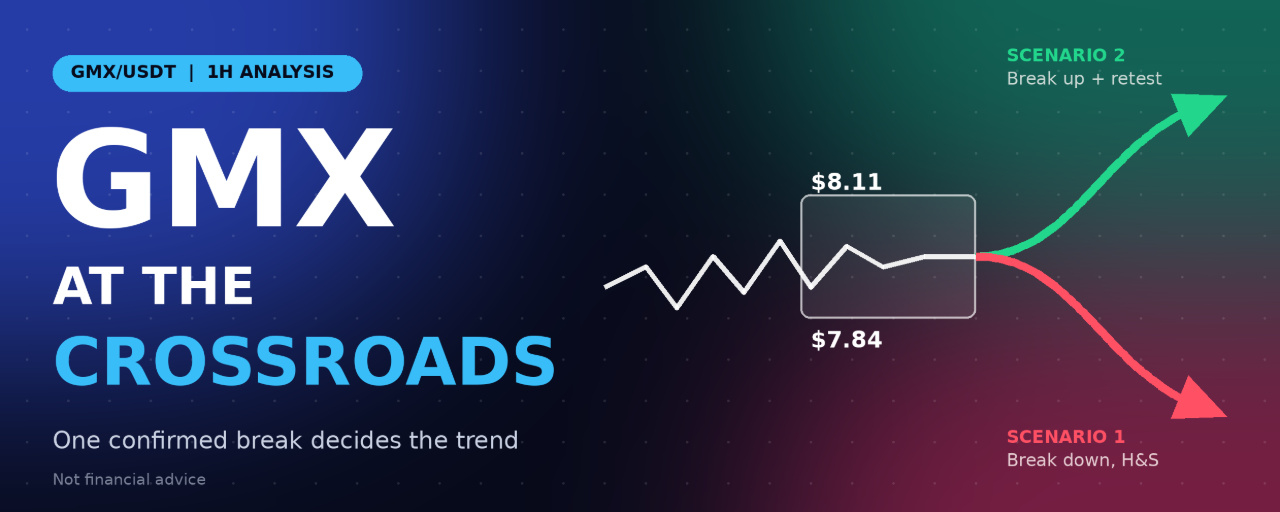
GMX is trading near $7.93, pinned just above a support line that has held since November 2. After a rally to a Higher High near $9.30 and a steady slide of lower highs, price is now squeezed inside a tight box between roughly $7.75 and $8.11. Traders should not guess the direction. The smarter approach is to wait for a confirmed break and trade the reaction. Here are both paths.
What the 1H Chart Is Telling Us
1. A head-and-shoulders style structure is visible. The chart shows a lower high near $8.35, a sharp rally to the Higher High near $9.30 (the head), then a lower high near $8.60 (the right shoulder). The flat green support near $7.84 acts as the neckline. The pattern only counts as confirmed if the neckline breaks.
2. Sellers are in control of the short-term trend. Since the head, the market has printed lower highs and lower lows, with stacked bearish Fair Value Gaps (FVGs) between $8.20 and $9.10 acting as supply. The latest bounce topped near $8.11 and was rejected.
3. Support is being tested repeatedly. Price has touched the $7.84 area several times. Each retest weakens a support level, and a wick already dipped near $7.76 before recovering. Repeated tests often precede a decisive break.
4. The range is the decision zone. The box from about $7.75 to $8.11 shows compression. A confirmed 1H close outside it should start an expansion move in one direction.
Key Levels to Watch
$9.30 – Head (Higher High). Major resistance, far above current price.$8.60 – Right shoulder (Lower High). Key upside target in a recovery.$8.11 – Range top. The level bulls must close above.$7.84 – Neckline and support. The line in the sand.$7.75 – Range bottom. Wick low and last defense inside the box.$7.46 – Chart target. First major downside objective if support fails.
Scenario 1: Downside Confirmation (Bearish Head-and-Shoulders Continuation)
If price breaks and closes below support, the pattern is confirmed and the downtrend continues.
Trigger: A 1H candle close below $7.75Entry: Retest of $7.78 to $7.84 from below, showing rejection (long upper wicks, red 1H close)Stop loss: $8.02 (back inside the range, above the broken neckline)Take profit 1: $7.60Take profit 2: $7.46Take profit 3: $7.33
Risk to reward on the second target is about 1:2.2 from the middle of the entry zone. The measured move of the pattern (head to neckline, about $1.48) projects a much deeper extension, so consider trailing the stop on the last portion rather than closing everything at once.
Why it works: A neckline break after repeated support tests shows buyers have run out of strength. The retest entry gives a tighter stop than selling the breakdown candle itself.
Scenario 2: Upside Confirmation (Bullish Break With Retracement)
If buyers reclaim the range, the head-and-shoulders idea fails and a recovery toward the lower highs opens up.
Trigger: A 1H candle close above $8.11Entry: Pullback (retracement) into $8.05 to $8.12 that holds as new supportStop loss: $7.92 (back inside the range)Take profit 1: $8.35Take profit 2: $8.60Take profit 3: $9.00
Risk to reward on the second target is above 1:3. Be aware that bearish FVGs sit around $8.20 and above, so expect resistance and consider taking partial profit at the first target.
Why it works: Entering on the retest instead of the breakout candle avoids chasing and tests whether the old resistance has truly flipped into support.
Invalidation: When to Step Aside
Scenario 1 is invalid if price closes back above $8.11.Scenario 2 is invalid if price closes back below $7.84 after breaking out.If price keeps chopping inside $7.75 to $8.11, there is no edge. Wait for the close.A wick outside the range that closes back inside is a fake-out, not a confirmation.
Risk Management Rules
Risk 1% to 2% of your account per trade at most.Always use a stop loss and do not move it further away.Take partial profits at the first target and shift the stop to break-even.GMX is a mid-cap altcoin and can move sharply on thin liquidity, so keep leverage low.Bitcoin leads the market. Check BTC direction before entering any altcoin trade.
Final Thoughts
GMX is at a clear decision point. A close below $7.75 favors the bearish head-and-shoulders continuation toward $7.46 and lower. A close above $8.11 followed by a successful retest favors a recovery toward $8.60. Until one of them happens, patience is the best position. Wait for confirmation, enter on the retest, and let the stop loss protect you.
Disclaimer: This article is for educational and informational purposes only and is not financial advice. Cryptocurrency trading carries a high level of risk and may not be suitable for all investors. Entry and exit levels are based on technical analysis of a single chart and can fail. Always do your own research and never risk more than you can afford to lose.
@Binance_Square_Official #BinanceReopensWithdrawalsForHYPE&APT #SouthKoreaDraftLawTargets15To20%ShareholderCap #TradFiForBeginners #Binance #ChartSniper
GMX at the Crossroads: One Break Decides the Next Big Move
$GMX
GMX is trading near $7.93, pinned just above a support line that has held since November 2. After a rally to a Higher High near $9.30 and a steady slide of lower highs, price is now squeezed inside a tight box between roughly $7.75 and $8.11. Traders should not guess the direction. The smarter approach is to wait for a confirmed break and trade the reaction. Here are both paths.
What the 1H Chart Is Telling Us
1. A head-and-shoulders style structure is visible. The chart shows a lower high near $8.35, a sharp rally to the Higher High near $9.30 (the head), then a lower high near $8.60 (the right shoulder). The flat green support near $7.84 acts as the neckline. The pattern only counts as confirmed if the neckline breaks.
2. Sellers are in control of the short-term trend. Since the head, the market has printed lower highs and lower lows, with stacked bearish Fair Value Gaps (FVGs) between $8.20 and $9.10 acting as supply. The latest bounce topped near $8.11 and was rejected.
3. Support is being tested repeatedly. Price has touched the $7.84 area several times. Each retest weakens a support level, and a wick already dipped near $7.76 before recovering. Repeated tests often precede a decisive break.
4. The range is the decision zone. The box from about $7.75 to $8.11 shows compression. A confirmed 1H close outside it should start an expansion move in one direction.
Key Levels to Watch
$9.30 – Head (Higher High). Major resistance, far above current price.$8.60 – Right shoulder (Lower High). Key upside target in a recovery.$8.11 – Range top. The level bulls must close above.$7.84 – Neckline and support. The line in the sand.$7.75 – Range bottom. Wick low and last defense inside the box.$7.46 – Chart target. First major downside objective if support fails.
Scenario 1: Downside Confirmation (Bearish Head-and-Shoulders Continuation)
If price breaks and closes below support, the pattern is confirmed and the downtrend continues.
Trigger: A 1H candle close below $7.75Entry: Retest of $7.78 to $7.84 from below, showing rejection (long upper wicks, red 1H close)Stop loss: $8.02 (back inside the range, above the broken neckline)Take profit 1: $7.60Take profit 2: $7.46Take profit 3: $7.33
Risk to reward on the second target is about 1:2.2 from the middle of the entry zone. The measured move of the pattern (head to neckline, about $1.48) projects a much deeper extension, so consider trailing the stop on the last portion rather than closing everything at once.
Why it works: A neckline break after repeated support tests shows buyers have run out of strength. The retest entry gives a tighter stop than selling the breakdown candle itself.
Scenario 2: Upside Confirmation (Bullish Break With Retracement)
If buyers reclaim the range, the head-and-shoulders idea fails and a recovery toward the lower highs opens up.
Trigger: A 1H candle close above $8.11Entry: Pullback (retracement) into $8.05 to $8.12 that holds as new supportStop loss: $7.92 (back inside the range)Take profit 1: $8.35Take profit 2: $8.60Take profit 3: $9.00
Risk to reward on the second target is above 1:3. Be aware that bearish FVGs sit around $8.20 and above, so expect resistance and consider taking partial profit at the first target.
Why it works: Entering on the retest instead of the breakout candle avoids chasing and tests whether the old resistance has truly flipped into support.
Invalidation: When to Step Aside
Scenario 1 is invalid if price closes back above $8.11.Scenario 2 is invalid if price closes back below $7.84 after breaking out.If price keeps chopping inside $7.75 to $8.11, there is no edge. Wait for the close.A wick outside the range that closes back inside is a fake-out, not a confirmation.
Risk Management Rules
Risk 1% to 2% of your account per trade at most.Always use a stop loss and do not move it further away.Take partial profits at the first target and shift the stop to break-even.GMX is a mid-cap altcoin and can move sharply on thin liquidity, so keep leverage low.Bitcoin leads the market. Check BTC direction before entering any altcoin trade.
Final Thoughts
GMX is at a clear decision point. A close below $7.75 favors the bearish head-and-shoulders continuation toward $7.46 and lower. A close above $8.11 followed by a successful retest favors a recovery toward $8.60. Until one of them happens, patience is the best position. Wait for confirmation, enter on the retest, and let the stop loss protect you.
Disclaimer: This article is for educational and informational purposes only and is not financial advice. Cryptocurrency trading carries a high level of risk and may not be suitable for all investors. Entry and exit levels are based on technical analysis of a single chart and can fail. Always do your own research and never risk more than you can afford to lose.
@Binance Square Official #BinanceReopensWithdrawalsForHYPE&APT #SouthKoreaDraftLawTargets15To20%ShareholderCap #TradFiForBeginners #Binance #ChartSniper
GMX is trading near $7.93, pinned just above a support line that has held since November 2. After a rally to a Higher High near $9.30 and a steady slide of lower highs, price is now squeezed inside a tight box between roughly $7.75 and $8.11. Traders should not guess the direction. The smarter approach is to wait for a confirmed break and trade the reaction. Here are both paths.
What the 1H Chart Is Telling Us
1. A head-and-shoulders style structure is visible. The chart shows a lower high near $8.35, a sharp rally to the Higher High near $9.30 (the head), then a lower high near $8.60 (the right shoulder). The flat green support near $7.84 acts as the neckline. The pattern only counts as confirmed if the neckline breaks.
2. Sellers are in control of the short-term trend. Since the head, the market has printed lower highs and lower lows, with stacked bearish Fair Value Gaps (FVGs) between $8.20 and $9.10 acting as supply. The latest bounce topped near $8.11 and was rejected.
3. Support is being tested repeatedly. Price has touched the $7.84 area several times. Each retest weakens a support level, and a wick already dipped near $7.76 before recovering. Repeated tests often precede a decisive break.
4. The range is the decision zone. The box from about $7.75 to $8.11 shows compression. A confirmed 1H close outside it should start an expansion move in one direction.
Key Levels to Watch
$9.30 – Head (Higher High). Major resistance, far above current price.$8.60 – Right shoulder (Lower High). Key upside target in a recovery.$8.11 – Range top. The level bulls must close above.$7.84 – Neckline and support. The line in the sand.$7.75 – Range bottom. Wick low and last defense inside the box.$7.46 – Chart target. First major downside objective if support fails.
Scenario 1: Downside Confirmation (Bearish Head-and-Shoulders Continuation)
If price breaks and closes below support, the pattern is confirmed and the downtrend continues.
Trigger: A 1H candle close below $7.75Entry: Retest of $7.78 to $7.84 from below, showing rejection (long upper wicks, red 1H close)Stop loss: $8.02 (back inside the range, above the broken neckline)Take profit 1: $7.60Take profit 2: $7.46Take profit 3: $7.33
Risk to reward on the second target is about 1:2.2 from the middle of the entry zone. The measured move of the pattern (head to neckline, about $1.48) projects a much deeper extension, so consider trailing the stop on the last portion rather than closing everything at once.
Why it works: A neckline break after repeated support tests shows buyers have run out of strength. The retest entry gives a tighter stop than selling the breakdown candle itself.
Scenario 2: Upside Confirmation (Bullish Break With Retracement)
If buyers reclaim the range, the head-and-shoulders idea fails and a recovery toward the lower highs opens up.
Trigger: A 1H candle close above $8.11Entry: Pullback (retracement) into $8.05 to $8.12 that holds as new supportStop loss: $7.92 (back inside the range)Take profit 1: $8.35Take profit 2: $8.60Take profit 3: $9.00
Risk to reward on the second target is above 1:3. Be aware that bearish FVGs sit around $8.20 and above, so expect resistance and consider taking partial profit at the first target.
Why it works: Entering on the retest instead of the breakout candle avoids chasing and tests whether the old resistance has truly flipped into support.
Invalidation: When to Step Aside
Scenario 1 is invalid if price closes back above $8.11.Scenario 2 is invalid if price closes back below $7.84 after breaking out.If price keeps chopping inside $7.75 to $8.11, there is no edge. Wait for the close.A wick outside the range that closes back inside is a fake-out, not a confirmation.
Risk Management Rules
Risk 1% to 2% of your account per trade at most.Always use a stop loss and do not move it further away.Take partial profits at the first target and shift the stop to break-even.GMX is a mid-cap altcoin and can move sharply on thin liquidity, so keep leverage low.Bitcoin leads the market. Check BTC direction before entering any altcoin trade.
Final Thoughts
GMX is at a clear decision point. A close below $7.75 favors the bearish head-and-shoulders continuation toward $7.46 and lower. A close above $8.11 followed by a successful retest favors a recovery toward $8.60. Until one of them happens, patience is the best position. Wait for confirmation, enter on the retest, and let the stop loss protect you.
Disclaimer: This article is for educational and informational purposes only and is not financial advice. Cryptocurrency trading carries a high level of risk and may not be suitable for all investors. Entry and exit levels are based on technical analysis of a single chart and can fail. Always do your own research and never risk more than you can afford to lose.
@Binance Square Official #BinanceReopensWithdrawalsForHYPE&APT #SouthKoreaDraftLawTargets15To20%ShareholderCap #TradFiForBeginners #Binance #ChartSniper
30
·
--
Article
See translation
Gold Boxed In: Bulls and Bears Stuck at 4,070, Which Way Is the Breakout?$XAU
{future}(XAUUSDT)
Chart: Gold (XAU), 1H, TradingView TVC. Last price 4,069.63, which matches Friday’s (Nov 6) close of about 4,069–4,070. Chart captured Nov 8, 21:26 UTC, while the market was closed.
Short answer: cautiously bullish above 4,022, but gold is range-bound and the macro backdrop is a headwind. The best trade is a buy near the bottom of the range, not a chase in the middle.
Note: this is TVC spot gold. On Binance, gold trades as XAUUSDT, so check that contract’s price, since it can differ slightly from spot.
What the chart shows
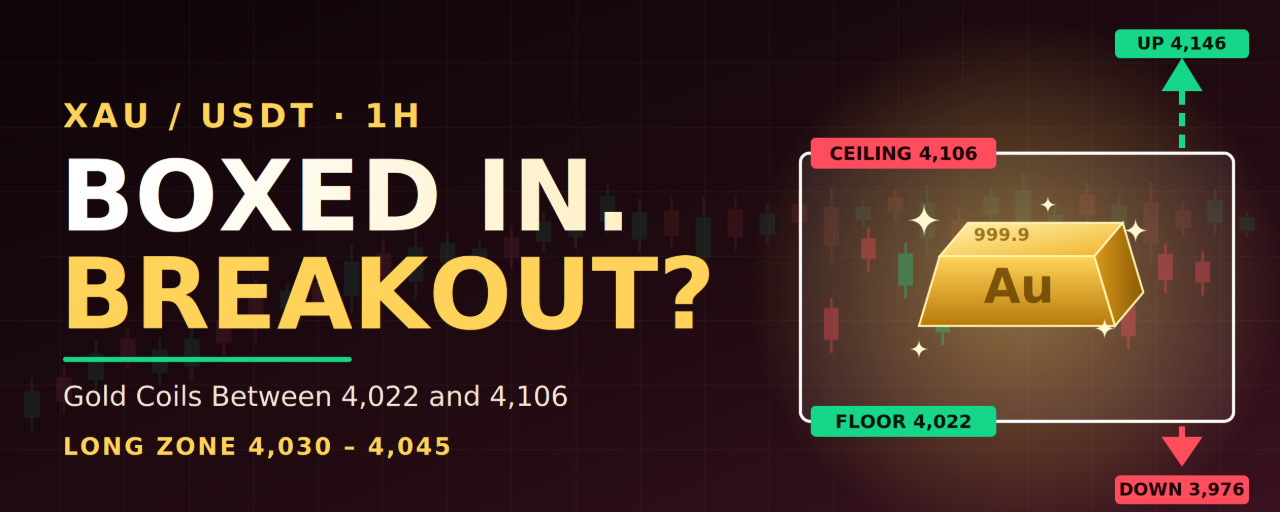
Rally from the low: gold bottomed near 3,870 at the start of November, then climbed in a series of higher highs and higher lows.Peak at the trendline: price topped at 4,146 on November 5, right at the rising white trendline, and got rejected.Range since Friday: after the jobs report, gold fell and has been moving in a box between about 4,022 and 4,106. Friday’s low was near 4,030 and the high was about 4,107.Retracement levels: measured from the 4,146 high to the 3,870 low, they sit at about 4,041 (38.2%), 4,008 (50%) and 3,976 (61.8%). Price at 4,070 is above all three.Bullish FVGs: several gaps sit under the range, around 4,010–4,030 and further down near 3,940–3,990.
Why it isn’t simply bullish
Gold gained about 4–5% on the week, but Friday erased part of it. The October jobs report came in at 165K versus about 65K expected, which pushed the odds of a Fed rate hike in December to roughly 67–77% according to CME FedWatch. The dollar index is back near 102, and higher rates make non-yielding gold less attractive. Goldman Sachs cut its gold target to $4,150 and called the outlook bearish, while the World Gold Council is more balanced.
There was also a technical wrinkle on Friday. Gold fell about 1% as stocks sold off sharply, with some selling tied to margin calls. Normally gold rises in a stock rout, so the safe-haven role was overridden. Gold sits near its 20-day average of about 4,064, below its 50-day average of about 4,214, and its RSI is around 43, which is neutral to soft.
Trade plan
Setup A: buy the range low (preferred)
Entry zone: 4,030–4,045, the 38.2% retracement, the range floor and the FVGStop loss: 4,005, below the range floor and the 50% levelTP1: 4,070TP2: 4,106, the range ceilingTP3: 4,146, the recent highTP4: 4,210, near the 50-day average
Setup B: breakout entry
Entry: a 1H candle close above 4,108, then a retest as support, at about 4,110–4,115Stop loss: 4,075Targets: 4,146, then 4,200, then 4,226, the 20-session high
Bearish contingency: if the floor breaks
Trigger: a 1H candle close below 4,022, then a failed retestEntry: 4,022–4,030Stop loss: 4,058Targets: 3,976, then 3,940, then 3,870
Measured from 4,038 to the 4,005 stop, Setup A pays about 1R at TP1, 2.1R at TP2, 3.3R at TP3 and 5.2R at TP4. After TP1, consider moving the stop to breakeven. The bearish setup pays about 1.5R at its first target and 4.7R at 3,870.
Key risk events
Sunday-night gap: gold reopens Sunday evening, so check the open before acting on these levels.October CPI on Tuesday, November 10, at 8:30 a.m. ET. A hot print would raise hike odds and likely push gold toward the floor. A cool print could break the range higher.Oil and equities. Lower oil has helped gold recently by easing inflation fears, while violent equity selloffs can force gold selling.
What invalidates the bullish idea
A 1H close below 4,005 (the 50% level) weakens the setup.A close below 4,022 and then 3,976 turns the structure bearish, with 3,870 as the next key low.A failed breakout above 4,106 that closes back inside the range would favor sellers.
Live cross-check
The chart matches live data. Several sources report spot gold closing Friday near 4,069–4,070, with an intraday low near 4,030 and a high near 4,107, the same range your chart marks. I could not find a post-weekend quote, so check the open before acting.
Bottom line
Bullish, but conditional. Gold is range-bound between 4,022 and 4,106, so the better long is a pullback to 4,030–4,045, or a confirmed close above 4,108. A close below 4,022 flips the bias. Watch Tuesday’s CPI, since hike odds are the main thing driving gold right now.
⚠️ Disclaimer: This is not financial advice. This analysis is for educational and informational purposes only. Gold and financial markets are volatile, and you can lose your capital. Always do your own research, manage your risk, and never trade with money you can’t afford to lose.
@Binance_Square_Official #BinanceReopensWithdrawalsForHYPE&APT #SouthKoreaDraftLawTargets15To20%ShareholderCap #TradFiForBeginners #Binance #ChartSniper
Gold Boxed In: Bulls and Bears Stuck at 4,070, Which Way Is the Breakout?
$XAU
Chart: Gold (XAU), 1H, TradingView TVC. Last price 4,069.63, which matches Friday’s (Nov 6) close of about 4,069–4,070. Chart captured Nov 8, 21:26 UTC, while the market was closed.
Short answer: cautiously bullish above 4,022, but gold is range-bound and the macro backdrop is a headwind. The best trade is a buy near the bottom of the range, not a chase in the middle.
Note: this is TVC spot gold. On Binance, gold trades as XAUUSDT, so check that contract’s price, since it can differ slightly from spot.
What the chart shows
Rally from the low: gold bottomed near 3,870 at the start of November, then climbed in a series of higher highs and higher lows.Peak at the trendline: price topped at 4,146 on November 5, right at the rising white trendline, and got rejected.Range since Friday: after the jobs report, gold fell and has been moving in a box between about 4,022 and 4,106. Friday’s low was near 4,030 and the high was about 4,107.Retracement levels: measured from the 4,146 high to the 3,870 low, they sit at about 4,041 (38.2%), 4,008 (50%) and 3,976 (61.8%). Price at 4,070 is above all three.Bullish FVGs: several gaps sit under the range, around 4,010–4,030 and further down near 3,940–3,990.
Why it isn’t simply bullish
Gold gained about 4–5% on the week, but Friday erased part of it. The October jobs report came in at 165K versus about 65K expected, which pushed the odds of a Fed rate hike in December to roughly 67–77% according to CME FedWatch. The dollar index is back near 102, and higher rates make non-yielding gold less attractive. Goldman Sachs cut its gold target to $4,150 and called the outlook bearish, while the World Gold Council is more balanced.
There was also a technical wrinkle on Friday. Gold fell about 1% as stocks sold off sharply, with some selling tied to margin calls. Normally gold rises in a stock rout, so the safe-haven role was overridden. Gold sits near its 20-day average of about 4,064, below its 50-day average of about 4,214, and its RSI is around 43, which is neutral to soft.
Trade plan
Setup A: buy the range low (preferred)
Entry zone: 4,030–4,045, the 38.2% retracement, the range floor and the FVGStop loss: 4,005, below the range floor and the 50% levelTP1: 4,070TP2: 4,106, the range ceilingTP3: 4,146, the recent highTP4: 4,210, near the 50-day average
Setup B: breakout entry
Entry: a 1H candle close above 4,108, then a retest as support, at about 4,110–4,115Stop loss: 4,075Targets: 4,146, then 4,200, then 4,226, the 20-session high
Bearish contingency: if the floor breaks
Trigger: a 1H candle close below 4,022, then a failed retestEntry: 4,022–4,030Stop loss: 4,058Targets: 3,976, then 3,940, then 3,870
Measured from 4,038 to the 4,005 stop, Setup A pays about 1R at TP1, 2.1R at TP2, 3.3R at TP3 and 5.2R at TP4. After TP1, consider moving the stop to breakeven. The bearish setup pays about 1.5R at its first target and 4.7R at 3,870.
Key risk events
Sunday-night gap: gold reopens Sunday evening, so check the open before acting on these levels.October CPI on Tuesday, November 10, at 8:30 a.m. ET. A hot print would raise hike odds and likely push gold toward the floor. A cool print could break the range higher.Oil and equities. Lower oil has helped gold recently by easing inflation fears, while violent equity selloffs can force gold selling.
What invalidates the bullish idea
A 1H close below 4,005 (the 50% level) weakens the setup.A close below 4,022 and then 3,976 turns the structure bearish, with 3,870 as the next key low.A failed breakout above 4,106 that closes back inside the range would favor sellers.
Live cross-check
The chart matches live data. Several sources report spot gold closing Friday near 4,069–4,070, with an intraday low near 4,030 and a high near 4,107, the same range your chart marks. I could not find a post-weekend quote, so check the open before acting.
Bottom line
Bullish, but conditional. Gold is range-bound between 4,022 and 4,106, so the better long is a pullback to 4,030–4,045, or a confirmed close above 4,108. A close below 4,022 flips the bias. Watch Tuesday’s CPI, since hike odds are the main thing driving gold right now.
⚠️ Disclaimer: This is not financial advice. This analysis is for educational and informational purposes only. Gold and financial markets are volatile, and you can lose your capital. Always do your own research, manage your risk, and never trade with money you can’t afford to lose.
@Binance Square Official #BinanceReopensWithdrawalsForHYPE&APT #SouthKoreaDraftLawTargets15To20%ShareholderCap #TradFiForBeginners #Binance #ChartSniper
Chart: Gold (XAU), 1H, TradingView TVC. Last price 4,069.63, which matches Friday’s (Nov 6) close of about 4,069–4,070. Chart captured Nov 8, 21:26 UTC, while the market was closed.
Short answer: cautiously bullish above 4,022, but gold is range-bound and the macro backdrop is a headwind. The best trade is a buy near the bottom of the range, not a chase in the middle.
Note: this is TVC spot gold. On Binance, gold trades as XAUUSDT, so check that contract’s price, since it can differ slightly from spot.
What the chart shows
Rally from the low: gold bottomed near 3,870 at the start of November, then climbed in a series of higher highs and higher lows.Peak at the trendline: price topped at 4,146 on November 5, right at the rising white trendline, and got rejected.Range since Friday: after the jobs report, gold fell and has been moving in a box between about 4,022 and 4,106. Friday’s low was near 4,030 and the high was about 4,107.Retracement levels: measured from the 4,146 high to the 3,870 low, they sit at about 4,041 (38.2%), 4,008 (50%) and 3,976 (61.8%). Price at 4,070 is above all three.Bullish FVGs: several gaps sit under the range, around 4,010–4,030 and further down near 3,940–3,990.
Why it isn’t simply bullish
Gold gained about 4–5% on the week, but Friday erased part of it. The October jobs report came in at 165K versus about 65K expected, which pushed the odds of a Fed rate hike in December to roughly 67–77% according to CME FedWatch. The dollar index is back near 102, and higher rates make non-yielding gold less attractive. Goldman Sachs cut its gold target to $4,150 and called the outlook bearish, while the World Gold Council is more balanced.
There was also a technical wrinkle on Friday. Gold fell about 1% as stocks sold off sharply, with some selling tied to margin calls. Normally gold rises in a stock rout, so the safe-haven role was overridden. Gold sits near its 20-day average of about 4,064, below its 50-day average of about 4,214, and its RSI is around 43, which is neutral to soft.
Trade plan
Setup A: buy the range low (preferred)
Entry zone: 4,030–4,045, the 38.2% retracement, the range floor and the FVGStop loss: 4,005, below the range floor and the 50% levelTP1: 4,070TP2: 4,106, the range ceilingTP3: 4,146, the recent highTP4: 4,210, near the 50-day average
Setup B: breakout entry
Entry: a 1H candle close above 4,108, then a retest as support, at about 4,110–4,115Stop loss: 4,075Targets: 4,146, then 4,200, then 4,226, the 20-session high
Bearish contingency: if the floor breaks
Trigger: a 1H candle close below 4,022, then a failed retestEntry: 4,022–4,030Stop loss: 4,058Targets: 3,976, then 3,940, then 3,870
Measured from 4,038 to the 4,005 stop, Setup A pays about 1R at TP1, 2.1R at TP2, 3.3R at TP3 and 5.2R at TP4. After TP1, consider moving the stop to breakeven. The bearish setup pays about 1.5R at its first target and 4.7R at 3,870.
Key risk events
Sunday-night gap: gold reopens Sunday evening, so check the open before acting on these levels.October CPI on Tuesday, November 10, at 8:30 a.m. ET. A hot print would raise hike odds and likely push gold toward the floor. A cool print could break the range higher.Oil and equities. Lower oil has helped gold recently by easing inflation fears, while violent equity selloffs can force gold selling.
What invalidates the bullish idea
A 1H close below 4,005 (the 50% level) weakens the setup.A close below 4,022 and then 3,976 turns the structure bearish, with 3,870 as the next key low.A failed breakout above 4,106 that closes back inside the range would favor sellers.
Live cross-check
The chart matches live data. Several sources report spot gold closing Friday near 4,069–4,070, with an intraday low near 4,030 and a high near 4,107, the same range your chart marks. I could not find a post-weekend quote, so check the open before acting.
Bottom line
Bullish, but conditional. Gold is range-bound between 4,022 and 4,106, so the better long is a pullback to 4,030–4,045, or a confirmed close above 4,108. A close below 4,022 flips the bias. Watch Tuesday’s CPI, since hike odds are the main thing driving gold right now.
⚠️ Disclaimer: This is not financial advice. This analysis is for educational and informational purposes only. Gold and financial markets are volatile, and you can lose your capital. Always do your own research, manage your risk, and never trade with money you can’t afford to lose.
@Binance Square Official #BinanceReopensWithdrawalsForHYPE&APT #SouthKoreaDraftLawTargets15To20%ShareholderCap #TradFiForBeginners #Binance #ChartSniper
42
·
--
Article
See translation
Apple’s Next Step Up? AAPL Sits on Support, and Here Is the Long Plan for the Open$AAPLB
{spot}(AAPLBUSDT)
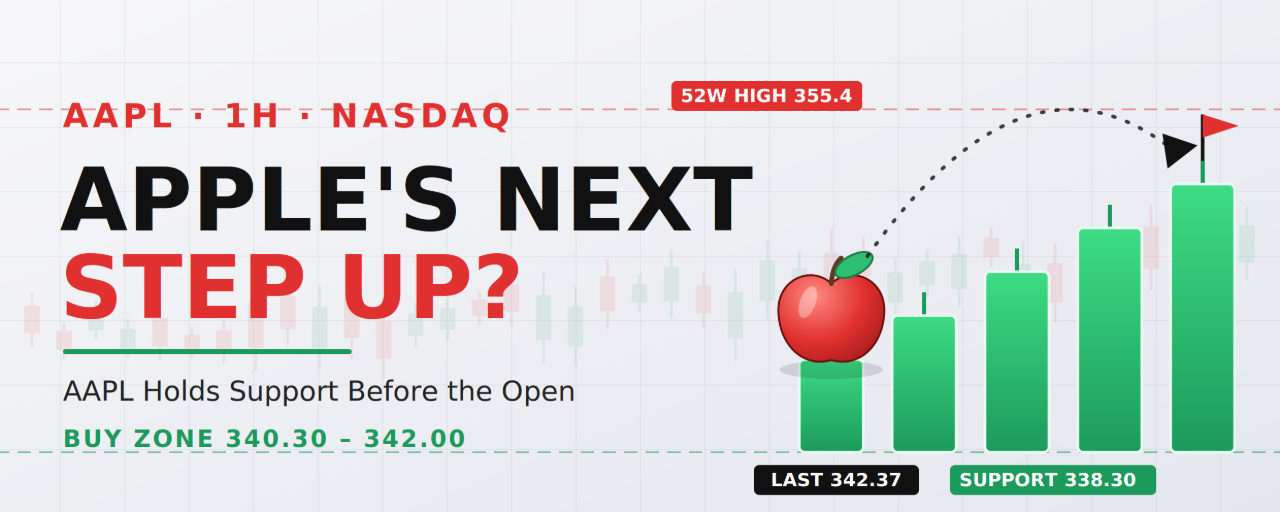
Chart: Apple Inc. (AAPL), 1H, NASDAQ. Last price 342.35, which matches Friday’s (Nov 6) close of 342.37. Chart captured Nov 8, 21:19 UTC, with US markets closed.
Short answer: the long setup is valid, but only on a pullback into support. AAPL is sitting right on a cluster of levels, and Tuesday’s inflation report could move the whole market.
What happened this week
AAPL had a violent week, much of it tied to the broad market. It fell to a low near 325.33 on November 3, then jumped about 5% on November 4 as big tech rallied after the midterms, closing at a record 349.51. On November 5 it hit a new 52-week high at 355.38 but reversed to close at 344.17 as the wider tech selloff hit. On Friday it traded between 338.30 and 345.79 and closed at 342.37.
Volume fell on Friday’s pullback, which is a mildly healthy sign. Several sources keep the daily structure bullish. Bernstein raised its price target from 370 to 380 on November 4. On the cautious side, Daiwa warned Apple could lose momentum next year, and the weak broader market is a headwind.
What the chart shows
Big V-shaped swing: price dropped to a Higher Low near 325.5, then rocketed to the 355 high, with a long gap-up leaving a green FVG between about 332 and 350.Retracement levels: measured from the 355.03 high down to the 325.5 low, they sit at about 343.76 (38.2%), 340.27 (50%) and 336.80 (61.8%). Price at 342.35 is between the first two.Support stack: 341.27 (the white line), the 20-day moving average near 341.97, the 338.56 green line (Friday’s low area), a volume-based support near 336.13, then 332.00 and 321.49.Resistance: 343.8 (the 38.2% level and a daily midpoint near 343.1), 345.79 (Friday’s high), about 347.2 (a daily pivot), 349.51 (record close) and 355.0–355.4 (the 52-week high).
Long trade plan for the open
Setup A: support buy (preferred)
Entry zone: 340.30–342.00, the 50% retracement, the white line and the 20-day averageStop loss: 337.80, below Friday’s low and the 338.56 lineTP1: 345.80, Friday’s highTP2: 349.50, the record closeTP3: 355.00, the 52-week high
Setup B: deeper pullback
Entry zone: 336.10–338.50, the 61.8% level and volume supportStop loss: 331.50, below the 332.00 lineTP1: 343.80TP2: 349.50TP3: 355.00
Setup C: momentum breakout
Entry: a 1H candle close above 346.00, ideally on rising volumeStop loss: 342.80Targets: 349.50, then 355.00, then 360.00 if the 52-week high breaks
Measured from 341.20 to the 337.80 stop, Setup A pays about 1.4R at TP1, 2.4R at TP2 and 4.1R at TP3. Setup B, from 337.30, pays about 1.2R, 2.2R and 3.2R. Setup C pays about 1R, 2.6R and 4R. After TP1, consider moving the stop to breakeven.
Timing and risk for the open
Don’t chase a gap. If AAPL opens well above the entry zones, wait for a pullback. If it opens below 338.30, skip the trade and let it prove support first.CPI is the main risk. October CPI is due Tuesday, November 10, at 8:30 a.m. ET. A hot print would raise Fed hike odds, and a weak market could pull AAPL through support. A cool print could lift tech.Ex-dividend on November 12. The $0.27 dividend will lower the price by about that much on the ex-date. It isn’t a signal, only an adjustment.Market backdrop is shaky. The S&P 500 just had its worst week since April 2025, so keep position sizes modest.
What invalidates the idea
A 1H close below 336.10 means the volume support and 61.8% level failed.A daily close below 332.00 would put the 321.49 level in play and wipe out the bullish structure.A fast rejection at 343.8–345.8 followed by a lower high would suggest the bounce is weak.
Live cross-check
The chart matches live data. Multiple sources report AAPL closed Friday at 342.37, with a day range of 338.30–345.79 and after-hours trading near 342.8. I could not find a Monday quote, so check the pre-market price and the CPI timing before you act.
If you want to trade this on Binance, look in the TradFi tab under Futures for a stock contract. I haven’t verified that an Apple contract is listed, so confirm that in your account.
Bottom line
Yes, a long setup is valid. The best entry is a pullback to 340.30–342.00, with a stop under 337.80 and targets at 345.80, 349.50 and 355.00. Keep size small until CPI is out, and don’t chase a gap.
⚠️ Disclaimer: This is not financial advice. This analysis is for educational and informational purposes only. Stock and financial markets are volatile, and you can lose your capital. Always do your own research, manage your risk, and never trade with money you can’t afford to lose.
@Binance_Square_Official #Apple #BinanceReopensWithdrawalsForHYPE&APT #SouthKoreaDraftLawTargets15To20%ShareholderCap #Binance #ChartSniper
Apple’s Next Step Up? AAPL Sits on Support, and Here Is the Long Plan for the Open
$AAPLB
Chart: Apple Inc. (AAPL), 1H, NASDAQ. Last price 342.35, which matches Friday’s (Nov 6) close of 342.37. Chart captured Nov 8, 21:19 UTC, with US markets closed.
Short answer: the long setup is valid, but only on a pullback into support. AAPL is sitting right on a cluster of levels, and Tuesday’s inflation report could move the whole market.
What happened this week
AAPL had a violent week, much of it tied to the broad market. It fell to a low near 325.33 on November 3, then jumped about 5% on November 4 as big tech rallied after the midterms, closing at a record 349.51. On November 5 it hit a new 52-week high at 355.38 but reversed to close at 344.17 as the wider tech selloff hit. On Friday it traded between 338.30 and 345.79 and closed at 342.37.
Volume fell on Friday’s pullback, which is a mildly healthy sign. Several sources keep the daily structure bullish. Bernstein raised its price target from 370 to 380 on November 4. On the cautious side, Daiwa warned Apple could lose momentum next year, and the weak broader market is a headwind.
What the chart shows
Big V-shaped swing: price dropped to a Higher Low near 325.5, then rocketed to the 355 high, with a long gap-up leaving a green FVG between about 332 and 350.Retracement levels: measured from the 355.03 high down to the 325.5 low, they sit at about 343.76 (38.2%), 340.27 (50%) and 336.80 (61.8%). Price at 342.35 is between the first two.Support stack: 341.27 (the white line), the 20-day moving average near 341.97, the 338.56 green line (Friday’s low area), a volume-based support near 336.13, then 332.00 and 321.49.Resistance: 343.8 (the 38.2% level and a daily midpoint near 343.1), 345.79 (Friday’s high), about 347.2 (a daily pivot), 349.51 (record close) and 355.0–355.4 (the 52-week high).
Long trade plan for the open
Setup A: support buy (preferred)
Entry zone: 340.30–342.00, the 50% retracement, the white line and the 20-day averageStop loss: 337.80, below Friday’s low and the 338.56 lineTP1: 345.80, Friday’s highTP2: 349.50, the record closeTP3: 355.00, the 52-week high
Setup B: deeper pullback
Entry zone: 336.10–338.50, the 61.8% level and volume supportStop loss: 331.50, below the 332.00 lineTP1: 343.80TP2: 349.50TP3: 355.00
Setup C: momentum breakout
Entry: a 1H candle close above 346.00, ideally on rising volumeStop loss: 342.80Targets: 349.50, then 355.00, then 360.00 if the 52-week high breaks
Measured from 341.20 to the 337.80 stop, Setup A pays about 1.4R at TP1, 2.4R at TP2 and 4.1R at TP3. Setup B, from 337.30, pays about 1.2R, 2.2R and 3.2R. Setup C pays about 1R, 2.6R and 4R. After TP1, consider moving the stop to breakeven.
Timing and risk for the open
Don’t chase a gap. If AAPL opens well above the entry zones, wait for a pullback. If it opens below 338.30, skip the trade and let it prove support first.CPI is the main risk. October CPI is due Tuesday, November 10, at 8:30 a.m. ET. A hot print would raise Fed hike odds, and a weak market could pull AAPL through support. A cool print could lift tech.Ex-dividend on November 12. The $0.27 dividend will lower the price by about that much on the ex-date. It isn’t a signal, only an adjustment.Market backdrop is shaky. The S&P 500 just had its worst week since April 2025, so keep position sizes modest.
What invalidates the idea
A 1H close below 336.10 means the volume support and 61.8% level failed.A daily close below 332.00 would put the 321.49 level in play and wipe out the bullish structure.A fast rejection at 343.8–345.8 followed by a lower high would suggest the bounce is weak.
Live cross-check
The chart matches live data. Multiple sources report AAPL closed Friday at 342.37, with a day range of 338.30–345.79 and after-hours trading near 342.8. I could not find a Monday quote, so check the pre-market price and the CPI timing before you act.
If you want to trade this on Binance, look in the TradFi tab under Futures for a stock contract. I haven’t verified that an Apple contract is listed, so confirm that in your account.
Bottom line
Yes, a long setup is valid. The best entry is a pullback to 340.30–342.00, with a stop under 337.80 and targets at 345.80, 349.50 and 355.00. Keep size small until CPI is out, and don’t chase a gap.
⚠️ Disclaimer: This is not financial advice. This analysis is for educational and informational purposes only. Stock and financial markets are volatile, and you can lose your capital. Always do your own research, manage your risk, and never trade with money you can’t afford to lose.
@Binance Square Official #Apple #BinanceReopensWithdrawalsForHYPE&APT #SouthKoreaDraftLawTargets15To20%ShareholderCap #Binance #ChartSniper
Chart: Apple Inc. (AAPL), 1H, NASDAQ. Last price 342.35, which matches Friday’s (Nov 6) close of 342.37. Chart captured Nov 8, 21:19 UTC, with US markets closed.
Short answer: the long setup is valid, but only on a pullback into support. AAPL is sitting right on a cluster of levels, and Tuesday’s inflation report could move the whole market.
What happened this week
AAPL had a violent week, much of it tied to the broad market. It fell to a low near 325.33 on November 3, then jumped about 5% on November 4 as big tech rallied after the midterms, closing at a record 349.51. On November 5 it hit a new 52-week high at 355.38 but reversed to close at 344.17 as the wider tech selloff hit. On Friday it traded between 338.30 and 345.79 and closed at 342.37.
Volume fell on Friday’s pullback, which is a mildly healthy sign. Several sources keep the daily structure bullish. Bernstein raised its price target from 370 to 380 on November 4. On the cautious side, Daiwa warned Apple could lose momentum next year, and the weak broader market is a headwind.
What the chart shows
Big V-shaped swing: price dropped to a Higher Low near 325.5, then rocketed to the 355 high, with a long gap-up leaving a green FVG between about 332 and 350.Retracement levels: measured from the 355.03 high down to the 325.5 low, they sit at about 343.76 (38.2%), 340.27 (50%) and 336.80 (61.8%). Price at 342.35 is between the first two.Support stack: 341.27 (the white line), the 20-day moving average near 341.97, the 338.56 green line (Friday’s low area), a volume-based support near 336.13, then 332.00 and 321.49.Resistance: 343.8 (the 38.2% level and a daily midpoint near 343.1), 345.79 (Friday’s high), about 347.2 (a daily pivot), 349.51 (record close) and 355.0–355.4 (the 52-week high).
Long trade plan for the open
Setup A: support buy (preferred)
Entry zone: 340.30–342.00, the 50% retracement, the white line and the 20-day averageStop loss: 337.80, below Friday’s low and the 338.56 lineTP1: 345.80, Friday’s highTP2: 349.50, the record closeTP3: 355.00, the 52-week high
Setup B: deeper pullback
Entry zone: 336.10–338.50, the 61.8% level and volume supportStop loss: 331.50, below the 332.00 lineTP1: 343.80TP2: 349.50TP3: 355.00
Setup C: momentum breakout
Entry: a 1H candle close above 346.00, ideally on rising volumeStop loss: 342.80Targets: 349.50, then 355.00, then 360.00 if the 52-week high breaks
Measured from 341.20 to the 337.80 stop, Setup A pays about 1.4R at TP1, 2.4R at TP2 and 4.1R at TP3. Setup B, from 337.30, pays about 1.2R, 2.2R and 3.2R. Setup C pays about 1R, 2.6R and 4R. After TP1, consider moving the stop to breakeven.
Timing and risk for the open
Don’t chase a gap. If AAPL opens well above the entry zones, wait for a pullback. If it opens below 338.30, skip the trade and let it prove support first.CPI is the main risk. October CPI is due Tuesday, November 10, at 8:30 a.m. ET. A hot print would raise Fed hike odds, and a weak market could pull AAPL through support. A cool print could lift tech.Ex-dividend on November 12. The $0.27 dividend will lower the price by about that much on the ex-date. It isn’t a signal, only an adjustment.Market backdrop is shaky. The S&P 500 just had its worst week since April 2025, so keep position sizes modest.
What invalidates the idea
A 1H close below 336.10 means the volume support and 61.8% level failed.A daily close below 332.00 would put the 321.49 level in play and wipe out the bullish structure.A fast rejection at 343.8–345.8 followed by a lower high would suggest the bounce is weak.
Live cross-check
The chart matches live data. Multiple sources report AAPL closed Friday at 342.37, with a day range of 338.30–345.79 and after-hours trading near 342.8. I could not find a Monday quote, so check the pre-market price and the CPI timing before you act.
If you want to trade this on Binance, look in the TradFi tab under Futures for a stock contract. I haven’t verified that an Apple contract is listed, so confirm that in your account.
Bottom line
Yes, a long setup is valid. The best entry is a pullback to 340.30–342.00, with a stop under 337.80 and targets at 345.80, 349.50 and 355.00. Keep size small until CPI is out, and don’t chase a gap.
⚠️ Disclaimer: This is not financial advice. This analysis is for educational and informational purposes only. Stock and financial markets are volatile, and you can lose your capital. Always do your own research, manage your risk, and never trade with money you can’t afford to lose.
@Binance Square Official #Apple #BinanceReopensWithdrawalsForHYPE&APT #SouthKoreaDraftLawTargets15To20%ShareholderCap #Binance #ChartSniper
59
·
--
Article
See translation
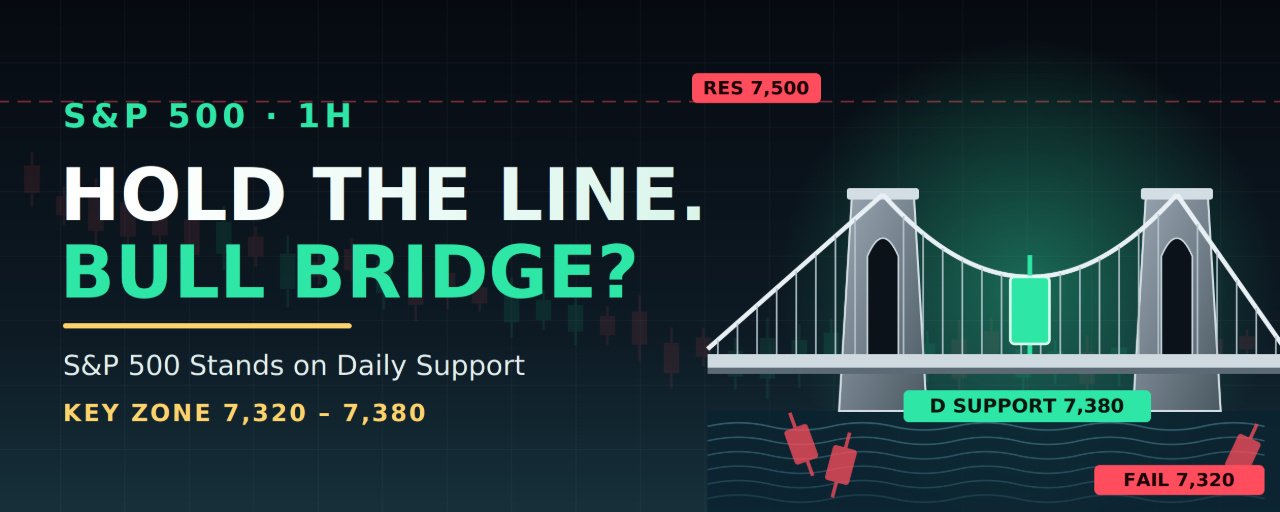
S&P 500 Stands on the Line: Can Bulls Hold 7,380 Before Tuesday’s CPI?Chart: S&P 500 Index, 1H. Last price 7,376.86, which is Friday’s (Nov 6) close. The chart was captured Nov 8, 21:08 UTC, while US markets were closed.
Short answer: a bullish bounce is possible from here, but it is a bounce from support, not a trend change yet. Price sits right on a key level, and Tuesday’s inflation report could decide which way it breaks.
What happened this week
The S&P 500 fell about 2.7% in the week ending November 6, its worst week since the April 2025 tariff crash and its fourth straight weekly loss. The damage came on Thursday, November 5, when the index dropped about 4.4%, its biggest one-day fall since April 3, 2025. Reports tie the selloff to fears of tougher AI regulation after Democratic midterm wins, and chip and AI names led the declines.
Friday brought a bounce led by tech, but a hot October jobs report (unemployment 4.1%) pushed Fed rate-hike odds and the dollar higher. That kept stocks from recovering much.
What the chart shows
Downtrend since early October: the index peaked near 7,840 on October 6 and then made lower highs inside a descending channel.Trendline broken: the white support line fell on November 5 when price gapped hard through it. That line, near 7,470–7,500 now, acts as resistance.Bounce failed at 7,715: the labelled HH near 7,715 on November 3–4 was a rally within the downtrend, not a break of it, since it sits well below the 7,840 high.Supply gaps overhead: the crash left red FVGs around 7,510–7,690, so sellers have unfinished business there.Swing low and key level: the low sits near 7,360, and the green daily (“D”) level at about 7,380 is where price is now standing. Analysts also point to the 7,320–7,360 zone, where the long-term moving average sits, as the line in the sand.
Bull vs. bear read
The bullish case: price is on a daily level and on long-term average support after a sharp, news-driven flush. Some strategists, such as Truist’s CIO, call the AI selloff a likely long-term buying opportunity, and LPL called it a knee-jerk reaction to the midterms.
The bearish case: the structure is still lower highs, the trendline is broken, and the index has fallen four weeks in a row. Until price reclaims about 7,500, a bounce is just a bounce.
The catalyst: Tuesday’s CPI
October CPI is due Tuesday, November 10, at 8:30 a.m. ET. The previous report was hot, with September CPI up 0.6% on the month and 3.7% on the year, and one report put the 10-year yield above 5.3%. A cool core print would take pressure off the Fed and likely lift stocks. A hot one would raise hike odds and could turn Thursday’s rout into a warm-up. Expect gaps, so size positions accordingly or wait for the print.
Trade plan (long bias)
These levels are in index points. If you trade through futures, a CFD or a perpetual contract, check the equivalent levels on that instrument, since prices can differ slightly.
Setup A: support bounce (preferred)
Entry zone: 7,360–7,385, the daily level and the swing lowStop loss: 7,315, below the 7,320 supportTP1: 7,420TP2: 7,500, the trendline and the main resistanceTP3: 7,620TP4: 7,690, near the top of the red gap
Setup B: breakout entry (confirmation)
Entry: a 1H candle close above 7,500, then a retest as supportStop loss: 7,440Targets: 7,620, then 7,690, then 7,715
Measured from 7,375 to the 7,315 stop, TP1 pays about 0.75R, so take partial profit there. TP2 pays about 2.1R, TP3 about 4.1R and TP4 about 5.3R. After TP1, consider moving the stop to breakeven.
Bearish alternative: if support fails
Trigger: a 1H close below 7,320, then a failed retestEntry: 7,320–7,335Stop loss: 7,380Targets: 7,225, then 7,125, then 7,000
What invalidates the bullish idea
A 1H close below 7,320 means the long-term average zone failed.A close below 7,250 would put the bear scenario in play: one weekly outlook sets that level with the VIX above 30 as the bear case.A hot core CPI, at or above 0.3% on the month, would likely send price through support.
Live cross-check
The chart matches reality. Multiple sources, including Yahoo Finance, report the S&P 500 closed Friday at 7,376.86, the same figure as your chart. I could not pull a reliable Monday quote or the latest futures moves, so check the open before acting.
Bottom line
Bullish, with conditions. The S&P 500 is standing on a daily level and the long-term average after the biggest drop in over a year. The best long is a bounce at 7,360–7,385 with a tight stop under 7,315, then a take-profit ladder toward 7,500. Treat 7,420 as the first test and 7,500 as the real break. A close below 7,320 flips the bias, and CPI on Tuesday could make that call.
⚠️ Disclaimer: This is not financial advice. This analysis is for educational and informational purposes only. Financial markets are highly volatile, and you can lose your capital. Always do your own research, manage your risk, and never trade with money you can’t afford to lose.
@Binance_Square_Official #SPX500 #BinanceReopensWithdrawalsForHYPE&APT #SouthKoreaDraftLawTargets15To20%ShareholderCap #Binance #ChartSniper
S&P 500 Stands on the Line: Can Bulls Hold 7,380 Before Tuesday’s CPI?
Chart: S&P 500 Index, 1H. Last price 7,376.86, which is Friday’s (Nov 6) close. The chart was captured Nov 8, 21:08 UTC, while US markets were closed.
Short answer: a bullish bounce is possible from here, but it is a bounce from support, not a trend change yet. Price sits right on a key level, and Tuesday’s inflation report could decide which way it breaks.
What happened this week
The S&P 500 fell about 2.7% in the week ending November 6, its worst week since the April 2025 tariff crash and its fourth straight weekly loss. The damage came on Thursday, November 5, when the index dropped about 4.4%, its biggest one-day fall since April 3, 2025. Reports tie the selloff to fears of tougher AI regulation after Democratic midterm wins, and chip and AI names led the declines.
Friday brought a bounce led by tech, but a hot October jobs report (unemployment 4.1%) pushed Fed rate-hike odds and the dollar higher. That kept stocks from recovering much.
What the chart shows
Downtrend since early October: the index peaked near 7,840 on October 6 and then made lower highs inside a descending channel.Trendline broken: the white support line fell on November 5 when price gapped hard through it. That line, near 7,470–7,500 now, acts as resistance.Bounce failed at 7,715: the labelled HH near 7,715 on November 3–4 was a rally within the downtrend, not a break of it, since it sits well below the 7,840 high.Supply gaps overhead: the crash left red FVGs around 7,510–7,690, so sellers have unfinished business there.Swing low and key level: the low sits near 7,360, and the green daily (“D”) level at about 7,380 is where price is now standing. Analysts also point to the 7,320–7,360 zone, where the long-term moving average sits, as the line in the sand.
Bull vs. bear read
The bullish case: price is on a daily level and on long-term average support after a sharp, news-driven flush. Some strategists, such as Truist’s CIO, call the AI selloff a likely long-term buying opportunity, and LPL called it a knee-jerk reaction to the midterms.
The bearish case: the structure is still lower highs, the trendline is broken, and the index has fallen four weeks in a row. Until price reclaims about 7,500, a bounce is just a bounce.
The catalyst: Tuesday’s CPI
October CPI is due Tuesday, November 10, at 8:30 a.m. ET. The previous report was hot, with September CPI up 0.6% on the month and 3.7% on the year, and one report put the 10-year yield above 5.3%. A cool core print would take pressure off the Fed and likely lift stocks. A hot one would raise hike odds and could turn Thursday’s rout into a warm-up. Expect gaps, so size positions accordingly or wait for the print.
Trade plan (long bias)
These levels are in index points. If you trade through futures, a CFD or a perpetual contract, check the equivalent levels on that instrument, since prices can differ slightly.
Setup A: support bounce (preferred)
Entry zone: 7,360–7,385, the daily level and the swing lowStop loss: 7,315, below the 7,320 supportTP1: 7,420TP2: 7,500, the trendline and the main resistanceTP3: 7,620TP4: 7,690, near the top of the red gap
Setup B: breakout entry (confirmation)
Entry: a 1H candle close above 7,500, then a retest as supportStop loss: 7,440Targets: 7,620, then 7,690, then 7,715
Measured from 7,375 to the 7,315 stop, TP1 pays about 0.75R, so take partial profit there. TP2 pays about 2.1R, TP3 about 4.1R and TP4 about 5.3R. After TP1, consider moving the stop to breakeven.
Bearish alternative: if support fails
Trigger: a 1H close below 7,320, then a failed retestEntry: 7,320–7,335Stop loss: 7,380Targets: 7,225, then 7,125, then 7,000
What invalidates the bullish idea
A 1H close below 7,320 means the long-term average zone failed.A close below 7,250 would put the bear scenario in play: one weekly outlook sets that level with the VIX above 30 as the bear case.A hot core CPI, at or above 0.3% on the month, would likely send price through support.
Live cross-check
The chart matches reality. Multiple sources, including Yahoo Finance, report the S&P 500 closed Friday at 7,376.86, the same figure as your chart. I could not pull a reliable Monday quote or the latest futures moves, so check the open before acting.
Bottom line
Bullish, with conditions. The S&P 500 is standing on a daily level and the long-term average after the biggest drop in over a year. The best long is a bounce at 7,360–7,385 with a tight stop under 7,315, then a take-profit ladder toward 7,500. Treat 7,420 as the first test and 7,500 as the real break. A close below 7,320 flips the bias, and CPI on Tuesday could make that call.
⚠️ Disclaimer: This is not financial advice. This analysis is for educational and informational purposes only. Financial markets are highly volatile, and you can lose your capital. Always do your own research, manage your risk, and never trade with money you can’t afford to lose.
@Binance Square Official #SPX500 #BinanceReopensWithdrawalsForHYPE&APT #SouthKoreaDraftLawTargets15To20%ShareholderCap #Binance #ChartSniper
Short answer: a bullish bounce is possible from here, but it is a bounce from support, not a trend change yet. Price sits right on a key level, and Tuesday’s inflation report could decide which way it breaks.
What happened this week
The S&P 500 fell about 2.7% in the week ending November 6, its worst week since the April 2025 tariff crash and its fourth straight weekly loss. The damage came on Thursday, November 5, when the index dropped about 4.4%, its biggest one-day fall since April 3, 2025. Reports tie the selloff to fears of tougher AI regulation after Democratic midterm wins, and chip and AI names led the declines.
Friday brought a bounce led by tech, but a hot October jobs report (unemployment 4.1%) pushed Fed rate-hike odds and the dollar higher. That kept stocks from recovering much.
What the chart shows
Downtrend since early October: the index peaked near 7,840 on October 6 and then made lower highs inside a descending channel.Trendline broken: the white support line fell on November 5 when price gapped hard through it. That line, near 7,470–7,500 now, acts as resistance.Bounce failed at 7,715: the labelled HH near 7,715 on November 3–4 was a rally within the downtrend, not a break of it, since it sits well below the 7,840 high.Supply gaps overhead: the crash left red FVGs around 7,510–7,690, so sellers have unfinished business there.Swing low and key level: the low sits near 7,360, and the green daily (“D”) level at about 7,380 is where price is now standing. Analysts also point to the 7,320–7,360 zone, where the long-term moving average sits, as the line in the sand.
Bull vs. bear read
The bullish case: price is on a daily level and on long-term average support after a sharp, news-driven flush. Some strategists, such as Truist’s CIO, call the AI selloff a likely long-term buying opportunity, and LPL called it a knee-jerk reaction to the midterms.
The bearish case: the structure is still lower highs, the trendline is broken, and the index has fallen four weeks in a row. Until price reclaims about 7,500, a bounce is just a bounce.
The catalyst: Tuesday’s CPI
October CPI is due Tuesday, November 10, at 8:30 a.m. ET. The previous report was hot, with September CPI up 0.6% on the month and 3.7% on the year, and one report put the 10-year yield above 5.3%. A cool core print would take pressure off the Fed and likely lift stocks. A hot one would raise hike odds and could turn Thursday’s rout into a warm-up. Expect gaps, so size positions accordingly or wait for the print.
Trade plan (long bias)
These levels are in index points. If you trade through futures, a CFD or a perpetual contract, check the equivalent levels on that instrument, since prices can differ slightly.
Setup A: support bounce (preferred)
Entry zone: 7,360–7,385, the daily level and the swing lowStop loss: 7,315, below the 7,320 supportTP1: 7,420TP2: 7,500, the trendline and the main resistanceTP3: 7,620TP4: 7,690, near the top of the red gap
Setup B: breakout entry (confirmation)
Entry: a 1H candle close above 7,500, then a retest as supportStop loss: 7,440Targets: 7,620, then 7,690, then 7,715
Measured from 7,375 to the 7,315 stop, TP1 pays about 0.75R, so take partial profit there. TP2 pays about 2.1R, TP3 about 4.1R and TP4 about 5.3R. After TP1, consider moving the stop to breakeven.
Bearish alternative: if support fails
Trigger: a 1H close below 7,320, then a failed retestEntry: 7,320–7,335Stop loss: 7,380Targets: 7,225, then 7,125, then 7,000
What invalidates the bullish idea
A 1H close below 7,320 means the long-term average zone failed.A close below 7,250 would put the bear scenario in play: one weekly outlook sets that level with the VIX above 30 as the bear case.A hot core CPI, at or above 0.3% on the month, would likely send price through support.
Live cross-check
The chart matches reality. Multiple sources, including Yahoo Finance, report the S&P 500 closed Friday at 7,376.86, the same figure as your chart. I could not pull a reliable Monday quote or the latest futures moves, so check the open before acting.
Bottom line
Bullish, with conditions. The S&P 500 is standing on a daily level and the long-term average after the biggest drop in over a year. The best long is a bounce at 7,360–7,385 with a tight stop under 7,315, then a take-profit ladder toward 7,500. Treat 7,420 as the first test and 7,500 as the real break. A close below 7,320 flips the bias, and CPI on Tuesday could make that call.
⚠️ Disclaimer: This is not financial advice. This analysis is for educational and informational purposes only. Financial markets are highly volatile, and you can lose your capital. Always do your own research, manage your risk, and never trade with money you can’t afford to lose.
@Binance Square Official #SPX500 #BinanceReopensWithdrawalsForHYPE&APT #SouthKoreaDraftLawTargets15To20%ShareholderCap #Binance #ChartSniper
67
·
--
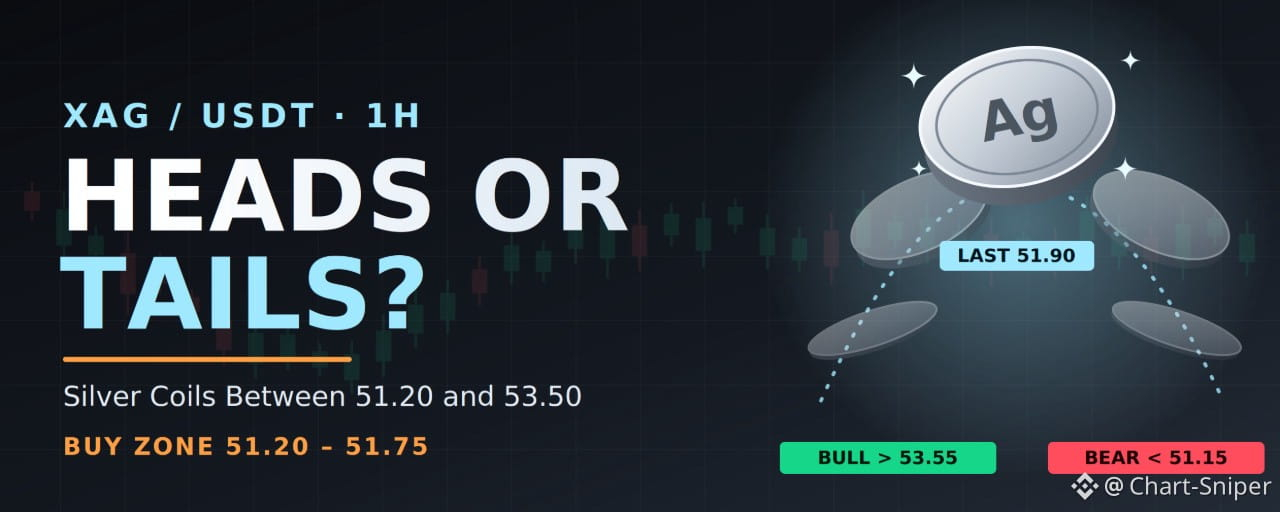
Article
See translation
Silver: Heads or Tails? Coiled Between 51.20 and 53.50, Waiting for CPI$XAG
{future}(XAGUSDT)
Chart: Silver (XAG), 1H, TradingView TVC. Last price 51.902, which matches Friday’s (Nov 6) New York close of about 51.89. Chart captured Nov 8, 21:31 UTC, with the market closed.
I read your message as “silver, which way?” Short answer: neutral, with a cautious bullish lean while 51.20 holds. Silver has bounced hard but is still inside a range, and a breakout in either direction is the real signal.
On Binance, silver trades as XAGUSDT. Check that contract’s price, since it can differ a little from TVC spot.
What the chart shows
Downtrend into early November: silver made lower highs near 54.4 and fell to a low around 48.6 on November 3.Sharp rebound: on November 4 it ripped above 50 and ran to a Lower High near 53.4 on November 5, a rise of about 10%.Pullback held the 50% level: silver dipped to about 51.2 on November 6, which is the 50% retracement, and bounced.Tight range now: price has traded between about 51.7 and 52.2 since, with small candles, which is consolidation.Retracement levels: measured from the 53.5 high to the 48.9 low, they sit at about 51.74 (38.2%), 51.20 (50%) and 50.66 (61.8%).Bullish FVGs: gaps under price around 51.1–51.8 and 49.9–51.0 offer demand zones.Key level above: the white line at 57.0066 is a major resistance well above current price.
The macro picture
Silver rose about 5.75% on the week, from 49.07 to 51.89, helped by a post-midterm slide in the dollar and a rally in bullion. It shrugged off Friday’s blowout jobs report, which knocked gold down about 1%, and industrial demand helped. But the bigger picture is rough: silver is down roughly 13–15% over the past month and about 27% so far this year, after a spike to a $121 intraday high in January. Gold/silver sits near 78, and hedge-fund positioning is thin, which one analyst flagged as a risk if prices weaken. Several sources lean bearish despite the rebound.
October CPI lands Tuesday, November 10, at 8:30 a.m. ET. One weekly outlook framed it as deciding between $55 on the upside and $49 on the downside.
Trade plan
Setup A: pullback long (preferred)
Entry zone: 51.20–51.75, the 50% and 38.2% retracements inside the FVGStop loss: 50.60, below the 61.8% levelTP1: 53.00TP2: 53.50, the Lower HighTP3: 54.40Extended target: 57.00, the marked key level
Setup B: breakout long
Entry: a 1H candle close above 53.55, then a retest at about 53.55–53.70Stop loss: 52.90Targets: 54.40, then 55.00, then 57.00
Bearish contingency: if support breaks
Trigger: a 1H candle close below 51.15, then a failed retestEntry: 51.15–51.30Stop loss: 51.75Targets: 50.66, then 50.00, then 49.00
Measured from 51.50 to the 50.60 stop, Setup A pays about 1.7R at TP1, 2.2R at TP2, 3.2R at TP3 and 6.1R at the extended target. After TP1, consider moving the stop to breakeven. The bearish setup pays about 1R at its first target and 4R at 49.00.
What invalidates the bullish idea
A 1H close below 50.60 means the retracement zone failed.A break of 49.00 and then 48.50 would put the downtrend back in control and erase the November rebound.A failed breakout above 53.55 that closes back below 53.00 would suggest sellers still own the rallies.
Live cross-check
The chart matches live data. Multiple sources report silver closing Friday at 51.89 on the New York close, with intraday readings near 51.5–52.1. I couldn’t find a post-weekend quote, so check the open on Sunday evening before acting.
Bottom line
Silver is a coin flip until it picks a side. The best long is a pullback to 51.20–51.75 with a stop below 50.60, or a confirmed close above 53.55. A 1H close below 51.15 would flip the bias to bearish. Watch Tuesday’s CPI, since hike odds and the dollar are driving the metals right now.
⚠️ Disclaimer: This is not financial advice. This analysis is for educational and informational purposes only. Commodity and financial markets are highly volatile, and you can lose your capital. Always do your own research, manage your risk, and never trade with money you can’t afford to lose.
@Binance_Square_Official #BinanceReopensWithdrawalsForHYPE&APT #SouthKoreaDraftLawTargets15To20%ShareholderCap #TradFiForBeginners #Binance #ChartSniper
Silver: Heads or Tails? Coiled Between 51.20 and 53.50, Waiting for CPI
$XAG
Chart: Silver (XAG), 1H, TradingView TVC. Last price 51.902, which matches Friday’s (Nov 6) New York close of about 51.89. Chart captured Nov 8, 21:31 UTC, with the market closed.
I read your message as “silver, which way?” Short answer: neutral, with a cautious bullish lean while 51.20 holds. Silver has bounced hard but is still inside a range, and a breakout in either direction is the real signal.
On Binance, silver trades as XAGUSDT. Check that contract’s price, since it can differ a little from TVC spot.
What the chart shows
Downtrend into early November: silver made lower highs near 54.4 and fell to a low around 48.6 on November 3.Sharp rebound: on November 4 it ripped above 50 and ran to a Lower High near 53.4 on November 5, a rise of about 10%.Pullback held the 50% level: silver dipped to about 51.2 on November 6, which is the 50% retracement, and bounced.Tight range now: price has traded between about 51.7 and 52.2 since, with small candles, which is consolidation.Retracement levels: measured from the 53.5 high to the 48.9 low, they sit at about 51.74 (38.2%), 51.20 (50%) and 50.66 (61.8%).Bullish FVGs: gaps under price around 51.1–51.8 and 49.9–51.0 offer demand zones.Key level above: the white line at 57.0066 is a major resistance well above current price.
The macro picture
Silver rose about 5.75% on the week, from 49.07 to 51.89, helped by a post-midterm slide in the dollar and a rally in bullion. It shrugged off Friday’s blowout jobs report, which knocked gold down about 1%, and industrial demand helped. But the bigger picture is rough: silver is down roughly 13–15% over the past month and about 27% so far this year, after a spike to a $121 intraday high in January. Gold/silver sits near 78, and hedge-fund positioning is thin, which one analyst flagged as a risk if prices weaken. Several sources lean bearish despite the rebound.
October CPI lands Tuesday, November 10, at 8:30 a.m. ET. One weekly outlook framed it as deciding between $55 on the upside and $49 on the downside.
Trade plan
Setup A: pullback long (preferred)
Entry zone: 51.20–51.75, the 50% and 38.2% retracements inside the FVGStop loss: 50.60, below the 61.8% levelTP1: 53.00TP2: 53.50, the Lower HighTP3: 54.40Extended target: 57.00, the marked key level
Setup B: breakout long
Entry: a 1H candle close above 53.55, then a retest at about 53.55–53.70Stop loss: 52.90Targets: 54.40, then 55.00, then 57.00
Bearish contingency: if support breaks
Trigger: a 1H candle close below 51.15, then a failed retestEntry: 51.15–51.30Stop loss: 51.75Targets: 50.66, then 50.00, then 49.00
Measured from 51.50 to the 50.60 stop, Setup A pays about 1.7R at TP1, 2.2R at TP2, 3.2R at TP3 and 6.1R at the extended target. After TP1, consider moving the stop to breakeven. The bearish setup pays about 1R at its first target and 4R at 49.00.
What invalidates the bullish idea
A 1H close below 50.60 means the retracement zone failed.A break of 49.00 and then 48.50 would put the downtrend back in control and erase the November rebound.A failed breakout above 53.55 that closes back below 53.00 would suggest sellers still own the rallies.
Live cross-check
The chart matches live data. Multiple sources report silver closing Friday at 51.89 on the New York close, with intraday readings near 51.5–52.1. I couldn’t find a post-weekend quote, so check the open on Sunday evening before acting.
Bottom line
Silver is a coin flip until it picks a side. The best long is a pullback to 51.20–51.75 with a stop below 50.60, or a confirmed close above 53.55. A 1H close below 51.15 would flip the bias to bearish. Watch Tuesday’s CPI, since hike odds and the dollar are driving the metals right now.
⚠️ Disclaimer: This is not financial advice. This analysis is for educational and informational purposes only. Commodity and financial markets are highly volatile, and you can lose your capital. Always do your own research, manage your risk, and never trade with money you can’t afford to lose.
@Binance Square Official #BinanceReopensWithdrawalsForHYPE&APT #SouthKoreaDraftLawTargets15To20%ShareholderCap #TradFiForBeginners #Binance #ChartSniper
Chart: Silver (XAG), 1H, TradingView TVC. Last price 51.902, which matches Friday’s (Nov 6) New York close of about 51.89. Chart captured Nov 8, 21:31 UTC, with the market closed.
I read your message as “silver, which way?” Short answer: neutral, with a cautious bullish lean while 51.20 holds. Silver has bounced hard but is still inside a range, and a breakout in either direction is the real signal.
On Binance, silver trades as XAGUSDT. Check that contract’s price, since it can differ a little from TVC spot.
What the chart shows
Downtrend into early November: silver made lower highs near 54.4 and fell to a low around 48.6 on November 3.Sharp rebound: on November 4 it ripped above 50 and ran to a Lower High near 53.4 on November 5, a rise of about 10%.Pullback held the 50% level: silver dipped to about 51.2 on November 6, which is the 50% retracement, and bounced.Tight range now: price has traded between about 51.7 and 52.2 since, with small candles, which is consolidation.Retracement levels: measured from the 53.5 high to the 48.9 low, they sit at about 51.74 (38.2%), 51.20 (50%) and 50.66 (61.8%).Bullish FVGs: gaps under price around 51.1–51.8 and 49.9–51.0 offer demand zones.Key level above: the white line at 57.0066 is a major resistance well above current price.
The macro picture
Silver rose about 5.75% on the week, from 49.07 to 51.89, helped by a post-midterm slide in the dollar and a rally in bullion. It shrugged off Friday’s blowout jobs report, which knocked gold down about 1%, and industrial demand helped. But the bigger picture is rough: silver is down roughly 13–15% over the past month and about 27% so far this year, after a spike to a $121 intraday high in January. Gold/silver sits near 78, and hedge-fund positioning is thin, which one analyst flagged as a risk if prices weaken. Several sources lean bearish despite the rebound.
October CPI lands Tuesday, November 10, at 8:30 a.m. ET. One weekly outlook framed it as deciding between $55 on the upside and $49 on the downside.
Trade plan
Setup A: pullback long (preferred)
Entry zone: 51.20–51.75, the 50% and 38.2% retracements inside the FVGStop loss: 50.60, below the 61.8% levelTP1: 53.00TP2: 53.50, the Lower HighTP3: 54.40Extended target: 57.00, the marked key level
Setup B: breakout long
Entry: a 1H candle close above 53.55, then a retest at about 53.55–53.70Stop loss: 52.90Targets: 54.40, then 55.00, then 57.00
Bearish contingency: if support breaks
Trigger: a 1H candle close below 51.15, then a failed retestEntry: 51.15–51.30Stop loss: 51.75Targets: 50.66, then 50.00, then 49.00
Measured from 51.50 to the 50.60 stop, Setup A pays about 1.7R at TP1, 2.2R at TP2, 3.2R at TP3 and 6.1R at the extended target. After TP1, consider moving the stop to breakeven. The bearish setup pays about 1R at its first target and 4R at 49.00.
What invalidates the bullish idea
A 1H close below 50.60 means the retracement zone failed.A break of 49.00 and then 48.50 would put the downtrend back in control and erase the November rebound.A failed breakout above 53.55 that closes back below 53.00 would suggest sellers still own the rallies.
Live cross-check
The chart matches live data. Multiple sources report silver closing Friday at 51.89 on the New York close, with intraday readings near 51.5–52.1. I couldn’t find a post-weekend quote, so check the open on Sunday evening before acting.
Bottom line
Silver is a coin flip until it picks a side. The best long is a pullback to 51.20–51.75 with a stop below 50.60, or a confirmed close above 53.55. A 1H close below 51.15 would flip the bias to bearish. Watch Tuesday’s CPI, since hike odds and the dollar are driving the metals right now.
⚠️ Disclaimer: This is not financial advice. This analysis is for educational and informational purposes only. Commodity and financial markets are highly volatile, and you can lose your capital. Always do your own research, manage your risk, and never trade with money you can’t afford to lose.
@Binance Square Official #BinanceReopensWithdrawalsForHYPE&APT #SouthKoreaDraftLawTargets15To20%ShareholderCap #TradFiForBeginners #Binance #ChartSniper
64
·
--
Partly True
See translation
$BTC Breaks 80K: Fed, Tech and Oil All Lean Bearish$BTC
{future}(BTCUSDT)
Bitcoin rejected 81,582 and then lost 80,017 in one hard candle, printing 78,383 on the 1H. The sellers have several reasons.
Macro and geopolitical drivers
Hawkish Fed hold: Rates stayed at 3.75%-4% on a 10-2 vote, and both dissenters wanted a hike. A December hike is still on the table.Yields above 5%: The 10-year yield keeps pressure on risk assets.Oil climbing (~$102 WTI): BTC has been moving opposite to oil since the Middle East conflict began (correlation about -0.47). Rising oil feeds inflation and yield fears, which hurts BTC.Tech selloff: Samsung’s chip miss and Alphabet’s results hit equities, and BTC is tracking the Nasdaq (correlation about 0.64).Liquidations: Leveraged longs were flushed, which made the move faster than the news alone justified.
Chart structure (1H)
Repeated lower highs show sellers capping every bounce.The rising channel failed and broke down.The rejection at 81,582 looks like a liquidity grab.A bearish FVG sits overhead at 80.8K-81.2K.80,017 flipped from support to resistance.
Levels
Support: 77,815Resistance: 80,017, then 81,582Bias stays bearish below 80,017. A reclaim of 81,582 invalidates it.
Setup idea: After a move this extended, expect a relief bounce into 79.0K-80.0K first. A rejection there is the short re-entry, with a stop above 80.3K and a target at 77,815. If oil keeps pushing higher, that adds weight to the downside.
Watch oil, yields and the next inflation data. A hot reading adds pressure; a soft one could spark a bounce.
⚠️ Not financial advice. Do your own research and manage your risk.
@Binance_Square_Official #FedWatch #EarningsSeason #USMidtermElections #Binance #ChartSniper
$BTC Breaks 80K: Fed, Tech and Oil All Lean Bearish
$BTC
Bitcoin rejected 81,582 and then lost 80,017 in one hard candle, printing 78,383 on the 1H. The sellers have several reasons.
Macro and geopolitical drivers
Hawkish Fed hold: Rates stayed at 3.75%-4% on a 10-2 vote, and both dissenters wanted a hike. A December hike is still on the table.Yields above 5%: The 10-year yield keeps pressure on risk assets.Oil climbing (~$102 WTI): BTC has been moving opposite to oil since the Middle East conflict began (correlation about -0.47). Rising oil feeds inflation and yield fears, which hurts BTC.Tech selloff: Samsung’s chip miss and Alphabet’s results hit equities, and BTC is tracking the Nasdaq (correlation about 0.64).Liquidations: Leveraged longs were flushed, which made the move faster than the news alone justified.
Chart structure (1H)
Repeated lower highs show sellers capping every bounce.The rising channel failed and broke down.The rejection at 81,582 looks like a liquidity grab.A bearish FVG sits overhead at 80.8K-81.2K.80,017 flipped from support to resistance.
Levels
Support: 77,815Resistance: 80,017, then 81,582Bias stays bearish below 80,017. A reclaim of 81,582 invalidates it.
Setup idea: After a move this extended, expect a relief bounce into 79.0K-80.0K first. A rejection there is the short re-entry, with a stop above 80.3K and a target at 77,815. If oil keeps pushing higher, that adds weight to the downside.
Watch oil, yields and the next inflation data. A hot reading adds pressure; a soft one could spark a bounce.
⚠️ Not financial advice. Do your own research and manage your risk.
@Binance Square Official #FedWatch #EarningsSeason #USMidtermElections #Binance #ChartSniper
Bitcoin rejected 81,582 and then lost 80,017 in one hard candle, printing 78,383 on the 1H. The sellers have several reasons.
Macro and geopolitical drivers
Hawkish Fed hold: Rates stayed at 3.75%-4% on a 10-2 vote, and both dissenters wanted a hike. A December hike is still on the table.Yields above 5%: The 10-year yield keeps pressure on risk assets.Oil climbing (~$102 WTI): BTC has been moving opposite to oil since the Middle East conflict began (correlation about -0.47). Rising oil feeds inflation and yield fears, which hurts BTC.Tech selloff: Samsung’s chip miss and Alphabet’s results hit equities, and BTC is tracking the Nasdaq (correlation about 0.64).Liquidations: Leveraged longs were flushed, which made the move faster than the news alone justified.
Chart structure (1H)
Repeated lower highs show sellers capping every bounce.The rising channel failed and broke down.The rejection at 81,582 looks like a liquidity grab.A bearish FVG sits overhead at 80.8K-81.2K.80,017 flipped from support to resistance.
Levels
Support: 77,815Resistance: 80,017, then 81,582Bias stays bearish below 80,017. A reclaim of 81,582 invalidates it.
Setup idea: After a move this extended, expect a relief bounce into 79.0K-80.0K first. A rejection there is the short re-entry, with a stop above 80.3K and a target at 77,815. If oil keeps pushing higher, that adds weight to the downside.
Watch oil, yields and the next inflation data. A hot reading adds pressure; a soft one could spark a bounce.
⚠️ Not financial advice. Do your own research and manage your risk.
@Binance Square Official #FedWatch #EarningsSeason #USMidtermElections #Binance #ChartSniper
1
1
1k
·
--
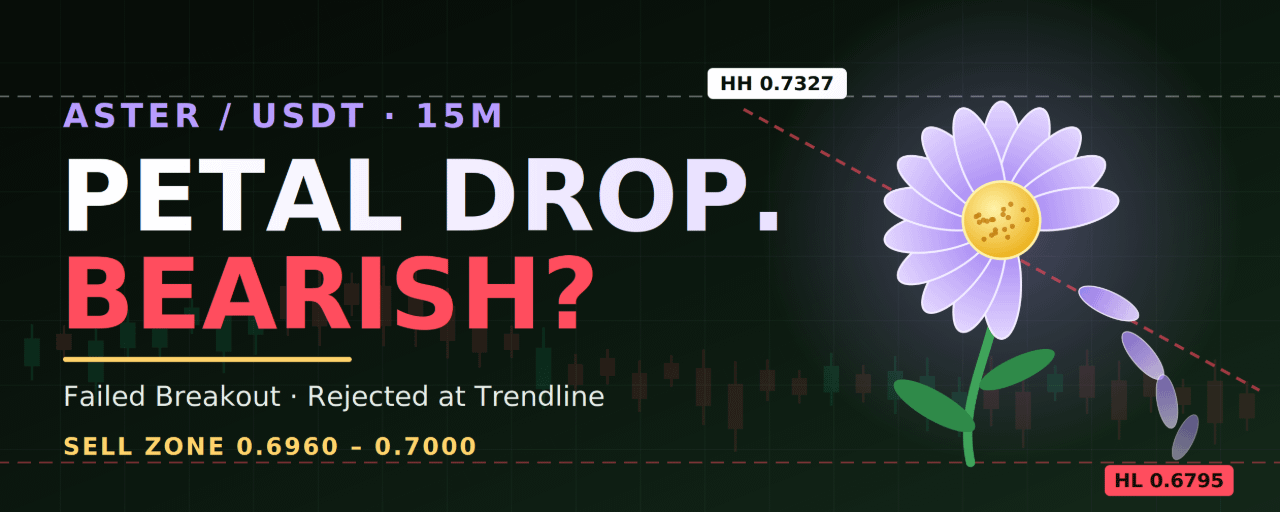
Article
See translation
ASTER Drops Its Petals: Failed Breakout Puts Bears in Control, But Where’s the Trade?$ASTER
{future}(ASTERUSDT)
Chart: ASTER/USDT Perpetual, 15m, Binance. Last price 0.6905 (−0.32%). Time: Oct 29, 21:52 UTC.
What the chart shows
ASTER spent the morning in a tight base around 0.696–0.700, then broke out and rallied to a high near 0.7327 by about 15:30 UTC. That breakout failed. Price rolled over, lost the descending trendline drawn from the high, and at about 20:45 UTC dumped in one large candle to a low near 0.680.
Pattern: a failed breakout, or bull trap. Price took the highs, then reversed through the entire range.Base broken: the labelled “HL” at 0.680 actually sits below the 0.696–0.698 pre-rally base, so the whole rally has been erased and then some.Descending trendline: price was rejected at this line before the dump and has stayed under it.Fib levels: measured from the 0.7327 high to the 0.680 low, retracement levels sit at about 0.7125 (38.2%), 0.7062 (50%) and 0.7000 (61.8%). Price at 0.6905 is below all of them.Bearish FVGs: the dump left a supply gap at about 0.6962–0.7081, with another around 0.7154–0.7173. The bounce so far stalled at about 0.697, right at the bottom of that gap.
Price now sits in the lower third of the marked range, which runs from about 0.6795 to 0.7327.
What’s holding the bears back
The 0.680 area is the lower edge of the range. A sharp wick there shows buyers stepped in.Selling at 0.6905 means shorting right above support, which is poor risk/reward.The bounce candles are small, so there is no strong sign yet that sellers are still pressing.
Trade plan
Setup A: short a rebound (preferred)
Entry zone: 0.6960–0.7000, the bearish FVG base plus the 61.8% retracement and the trendlineStop loss: 0.7085, above the FVG top and the 50% levelTP1: 0.6850TP2: 0.6800, the swing lowTP3: 0.6710TP4: 0.6610
Setup B: breakdown short
Trigger: a 15m candle close below 0.6795, then a failed retest from belowEntry: 0.6780–0.6795Stop loss: 0.6860Targets: 0.6710, then 0.6660, then 0.6610
Setup C: aggressive long bounce (counter-trend, quick scalp)
Entry: 0.6805–0.6830, only after a bullish 15m candle at supportStop loss: 0.6765Targets: 0.6965, then 0.7000, then 0.7062
Measured from a 0.6980 entry to the 0.7085 stop, Setup A pays about 1.2R at TP1, 1.7R at TP2 and 2.6R at TP3. Setup C pays about 2.6R to its first target, but it fights the short-term trend. After TP1, move the stop to breakeven.
What invalidates the bearish idea
A 15m close above 0.7085 means buyers reclaimed the supply gap and the 50% level.A close above 0.7125 (the 38.2% level), especially with a break of the descending trendline, flips the bias back to neutral.A strong hold at 0.680 with higher lows and a close back above 0.7000 would show the dump was a shakeout.
Live cross-check
My search for a live ASTER price returned scattered, undated quotes. DEX pools showed roughly $0.65–$0.67 and CoinGecko pages showed around $0.62–$0.63, all a bit below the chart’s 0.69. I can’t tell when those quotes were taken, so I used the timestamped Binance chart price of 0.6905 as the reference. Confirm the current price on Binance before entering, because 15m levels move quickly.
Bottom line
Bearish? Yes, for now. The breakout failed and price lost its base, so the better trade is to sell a rebound into 0.6960–0.7000, or a confirmed break below 0.6795. A 15m close above 0.7085 cancels the idea.
⚠️ Disclaimer: This is not financial advice. This analysis is for educational and informational purposes only. Crypto markets are highly volatile, and you can lose your capital. Always do your own research, manage your risk, and never trade with money you can’t afford to lose.
@Binance_Square_Official #FedWatch #EarningsSeason #USMidtermElections #Binance #ChartSniper
ASTER Drops Its Petals: Failed Breakout Puts Bears in Control, But Where’s the Trade?
$ASTER
Chart: ASTER/USDT Perpetual, 15m, Binance. Last price 0.6905 (−0.32%). Time: Oct 29, 21:52 UTC.
What the chart shows
ASTER spent the morning in a tight base around 0.696–0.700, then broke out and rallied to a high near 0.7327 by about 15:30 UTC. That breakout failed. Price rolled over, lost the descending trendline drawn from the high, and at about 20:45 UTC dumped in one large candle to a low near 0.680.
Pattern: a failed breakout, or bull trap. Price took the highs, then reversed through the entire range.Base broken: the labelled “HL” at 0.680 actually sits below the 0.696–0.698 pre-rally base, so the whole rally has been erased and then some.Descending trendline: price was rejected at this line before the dump and has stayed under it.Fib levels: measured from the 0.7327 high to the 0.680 low, retracement levels sit at about 0.7125 (38.2%), 0.7062 (50%) and 0.7000 (61.8%). Price at 0.6905 is below all of them.Bearish FVGs: the dump left a supply gap at about 0.6962–0.7081, with another around 0.7154–0.7173. The bounce so far stalled at about 0.697, right at the bottom of that gap.
Price now sits in the lower third of the marked range, which runs from about 0.6795 to 0.7327.
What’s holding the bears back
The 0.680 area is the lower edge of the range. A sharp wick there shows buyers stepped in.Selling at 0.6905 means shorting right above support, which is poor risk/reward.The bounce candles are small, so there is no strong sign yet that sellers are still pressing.
Trade plan
Setup A: short a rebound (preferred)
Entry zone: 0.6960–0.7000, the bearish FVG base plus the 61.8% retracement and the trendlineStop loss: 0.7085, above the FVG top and the 50% levelTP1: 0.6850TP2: 0.6800, the swing lowTP3: 0.6710TP4: 0.6610
Setup B: breakdown short
Trigger: a 15m candle close below 0.6795, then a failed retest from belowEntry: 0.6780–0.6795Stop loss: 0.6860Targets: 0.6710, then 0.6660, then 0.6610
Setup C: aggressive long bounce (counter-trend, quick scalp)
Entry: 0.6805–0.6830, only after a bullish 15m candle at supportStop loss: 0.6765Targets: 0.6965, then 0.7000, then 0.7062
Measured from a 0.6980 entry to the 0.7085 stop, Setup A pays about 1.2R at TP1, 1.7R at TP2 and 2.6R at TP3. Setup C pays about 2.6R to its first target, but it fights the short-term trend. After TP1, move the stop to breakeven.
What invalidates the bearish idea
A 15m close above 0.7085 means buyers reclaimed the supply gap and the 50% level.A close above 0.7125 (the 38.2% level), especially with a break of the descending trendline, flips the bias back to neutral.A strong hold at 0.680 with higher lows and a close back above 0.7000 would show the dump was a shakeout.
Live cross-check
My search for a live ASTER price returned scattered, undated quotes. DEX pools showed roughly $0.65–$0.67 and CoinGecko pages showed around $0.62–$0.63, all a bit below the chart’s 0.69. I can’t tell when those quotes were taken, so I used the timestamped Binance chart price of 0.6905 as the reference. Confirm the current price on Binance before entering, because 15m levels move quickly.
Bottom line
Bearish? Yes, for now. The breakout failed and price lost its base, so the better trade is to sell a rebound into 0.6960–0.7000, or a confirmed break below 0.6795. A 15m close above 0.7085 cancels the idea.
⚠️ Disclaimer: This is not financial advice. This analysis is for educational and informational purposes only. Crypto markets are highly volatile, and you can lose your capital. Always do your own research, manage your risk, and never trade with money you can’t afford to lose.
@Binance Square Official #FedWatch #EarningsSeason #USMidtermElections #Binance #ChartSniper
Chart: ASTER/USDT Perpetual, 15m, Binance. Last price 0.6905 (−0.32%). Time: Oct 29, 21:52 UTC.
What the chart shows
ASTER spent the morning in a tight base around 0.696–0.700, then broke out and rallied to a high near 0.7327 by about 15:30 UTC. That breakout failed. Price rolled over, lost the descending trendline drawn from the high, and at about 20:45 UTC dumped in one large candle to a low near 0.680.
Pattern: a failed breakout, or bull trap. Price took the highs, then reversed through the entire range.Base broken: the labelled “HL” at 0.680 actually sits below the 0.696–0.698 pre-rally base, so the whole rally has been erased and then some.Descending trendline: price was rejected at this line before the dump and has stayed under it.Fib levels: measured from the 0.7327 high to the 0.680 low, retracement levels sit at about 0.7125 (38.2%), 0.7062 (50%) and 0.7000 (61.8%). Price at 0.6905 is below all of them.Bearish FVGs: the dump left a supply gap at about 0.6962–0.7081, with another around 0.7154–0.7173. The bounce so far stalled at about 0.697, right at the bottom of that gap.
Price now sits in the lower third of the marked range, which runs from about 0.6795 to 0.7327.
What’s holding the bears back
The 0.680 area is the lower edge of the range. A sharp wick there shows buyers stepped in.Selling at 0.6905 means shorting right above support, which is poor risk/reward.The bounce candles are small, so there is no strong sign yet that sellers are still pressing.
Trade plan
Setup A: short a rebound (preferred)
Entry zone: 0.6960–0.7000, the bearish FVG base plus the 61.8% retracement and the trendlineStop loss: 0.7085, above the FVG top and the 50% levelTP1: 0.6850TP2: 0.6800, the swing lowTP3: 0.6710TP4: 0.6610
Setup B: breakdown short
Trigger: a 15m candle close below 0.6795, then a failed retest from belowEntry: 0.6780–0.6795Stop loss: 0.6860Targets: 0.6710, then 0.6660, then 0.6610
Setup C: aggressive long bounce (counter-trend, quick scalp)
Entry: 0.6805–0.6830, only after a bullish 15m candle at supportStop loss: 0.6765Targets: 0.6965, then 0.7000, then 0.7062
Measured from a 0.6980 entry to the 0.7085 stop, Setup A pays about 1.2R at TP1, 1.7R at TP2 and 2.6R at TP3. Setup C pays about 2.6R to its first target, but it fights the short-term trend. After TP1, move the stop to breakeven.
What invalidates the bearish idea
A 15m close above 0.7085 means buyers reclaimed the supply gap and the 50% level.A close above 0.7125 (the 38.2% level), especially with a break of the descending trendline, flips the bias back to neutral.A strong hold at 0.680 with higher lows and a close back above 0.7000 would show the dump was a shakeout.
Live cross-check
My search for a live ASTER price returned scattered, undated quotes. DEX pools showed roughly $0.65–$0.67 and CoinGecko pages showed around $0.62–$0.63, all a bit below the chart’s 0.69. I can’t tell when those quotes were taken, so I used the timestamped Binance chart price of 0.6905 as the reference. Confirm the current price on Binance before entering, because 15m levels move quickly.
Bottom line
Bearish? Yes, for now. The breakout failed and price lost its base, so the better trade is to sell a rebound into 0.6960–0.7000, or a confirmed break below 0.6795. A 15m close above 0.7085 cancels the idea.
⚠️ Disclaimer: This is not financial advice. This analysis is for educational and informational purposes only. Crypto markets are highly volatile, and you can lose your capital. Always do your own research, manage your risk, and never trade with money you can’t afford to lose.
@Binance Square Official #FedWatch #EarningsSeason #USMidtermElections #Binance #ChartSniper
903
·
--
Article
See translation
PUMP’s Twin Peaks: A Confirmed Double Top Sends Bears Looking for an Avalanche$PUMP
{future}(PUMPUSDT)
Chart: PUMP/USDT Perpetual, 1H, Binance. Last price 0.004120 (+1.50%). Time: Oct 29, 21:57 UTC.
What the chart shows
Two equal highs: PUMP topped near 0.00465 on October 28, pulled back, then ran back to the same level on October 29 and failed again. Two matching highs, with sellers capping both, is a classic double top.Neckline: the low between the two tops sits around 0.00417, which is the level to watch.Breakdown: a large red 1H candle sliced through the neckline and dumped price to a low near 0.003943, which you’ve labelled HL.Rejection bounce: the latest candle bounced to 0.004262, but that high was rejected and the candle closed at 0.004120, back below the neckline.Retracement levels: measured from the 0.003943 low to the 0.00465 top, they sit at about 0.004213 (38.2%), 0.004297 (50%) and 0.004380 (61.8%).Supply gap: a bearish FVG sits at about 0.00425–0.00440, right where the retracement levels cluster.Measured move: the pattern is about 0.00048 tall (0.00465 minus 0.00417). Projecting that below the neckline points to roughly 0.00370.
Note that the neckline and level readings come from the chart image, so they are close approximations. Check them on your own screen.
Why it could still bounce
The dump already covered a good part of the measured move (price fell from 0.00417 to 0.003943). The bounce also left a long lower wick, so some buyers are active near 0.0040. Shorting right here, below the neckline and above support, is not the best entry.
Trade plan (short bias)
Setup A: short the neckline retest (preferred)
Entry zone: 0.00420–0.00432, the old neckline, the 38.2%–50% retracement and the base of the bearish FVGStop loss: 0.00444, above the FVG top and the 61.8% levelTP1: 0.00400TP2: 0.00394, the swing lowTP3: 0.00382TP4: 0.00370, the measured-move target
Setup B: breakdown short
Trigger: a 1H candle close below 0.00394Entry: 0.00392–0.00394 on a failed retest from belowStop loss: 0.00405Targets: 0.00382, then 0.00374, then 0.00370
Measured from a 0.00426 entry to the 0.00444 stop, Setup A pays about 1.4R at TP1, 1.8R at TP2, 2.4R at TP3 and 3.1R at TP4. Setup B is tighter, with about 0.9R at the first target and about 1.8R at the last. After TP1, consider moving the stop to breakeven.
What invalidates the bearish idea
A 1H close above 0.00444 means buyers reclaimed the supply gap and the 61.8% level.A strong close above the neckline area and the 0.00432 zone would turn the breakdown into a failed breakdown, which often squeezes shorts.A close above 0.00465 would cancel the double top completely. In that case, look for a retest of 0.00465 as support, with 0.0047 and 0.0048 above.
Live cross-check
I tried to cross-check the live PUMP price, but the results were not reliable. Many Solana DEX pages carry copycat tokens that use the PUMP symbol, and the quotes I found were undated and ranged from about $0.0012 to $0.05. One CoinGecko snapshot showed a 2026 low near $0.0012, which would put the chart’s 0.0041 well above that, but I can’t confirm the timing. I used the timestamped Binance chart price of 0.004120 as the reference. Confirm the current price on the Binance PUMPUSDT contract before entering.
Bottom line
Bearish, with the double top confirmed. The best trade is to sell a retest of 0.00420–0.00432 with a stop above 0.00444 and targets down to 0.00370, or to short a confirmed 1H close below 0.00394. A 1H close above 0.00444 weakens the idea, and above 0.00465 cancels it.
⚠️ Disclaimer: This is not financial advice. This analysis is for educational and informational purposes only. Crypto markets are highly volatile, and you can lose your capital. Always do your own research, manage your risk, and never trade with money you can’t afford to lose.
@Binance_Square_Official #FedWatch #EarningsSeason #USMidtermElections #Binance #ChartSniper
PUMP’s Twin Peaks: A Confirmed Double Top Sends Bears Looking for an Avalanche
$PUMP
Chart: PUMP/USDT Perpetual, 1H, Binance. Last price 0.004120 (+1.50%). Time: Oct 29, 21:57 UTC.
What the chart shows
Two equal highs: PUMP topped near 0.00465 on October 28, pulled back, then ran back to the same level on October 29 and failed again. Two matching highs, with sellers capping both, is a classic double top.Neckline: the low between the two tops sits around 0.00417, which is the level to watch.Breakdown: a large red 1H candle sliced through the neckline and dumped price to a low near 0.003943, which you’ve labelled HL.Rejection bounce: the latest candle bounced to 0.004262, but that high was rejected and the candle closed at 0.004120, back below the neckline.Retracement levels: measured from the 0.003943 low to the 0.00465 top, they sit at about 0.004213 (38.2%), 0.004297 (50%) and 0.004380 (61.8%).Supply gap: a bearish FVG sits at about 0.00425–0.00440, right where the retracement levels cluster.Measured move: the pattern is about 0.00048 tall (0.00465 minus 0.00417). Projecting that below the neckline points to roughly 0.00370.
Note that the neckline and level readings come from the chart image, so they are close approximations. Check them on your own screen.
Why it could still bounce
The dump already covered a good part of the measured move (price fell from 0.00417 to 0.003943). The bounce also left a long lower wick, so some buyers are active near 0.0040. Shorting right here, below the neckline and above support, is not the best entry.
Trade plan (short bias)
Setup A: short the neckline retest (preferred)
Entry zone: 0.00420–0.00432, the old neckline, the 38.2%–50% retracement and the base of the bearish FVGStop loss: 0.00444, above the FVG top and the 61.8% levelTP1: 0.00400TP2: 0.00394, the swing lowTP3: 0.00382TP4: 0.00370, the measured-move target
Setup B: breakdown short
Trigger: a 1H candle close below 0.00394Entry: 0.00392–0.00394 on a failed retest from belowStop loss: 0.00405Targets: 0.00382, then 0.00374, then 0.00370
Measured from a 0.00426 entry to the 0.00444 stop, Setup A pays about 1.4R at TP1, 1.8R at TP2, 2.4R at TP3 and 3.1R at TP4. Setup B is tighter, with about 0.9R at the first target and about 1.8R at the last. After TP1, consider moving the stop to breakeven.
What invalidates the bearish idea
A 1H close above 0.00444 means buyers reclaimed the supply gap and the 61.8% level.A strong close above the neckline area and the 0.00432 zone would turn the breakdown into a failed breakdown, which often squeezes shorts.A close above 0.00465 would cancel the double top completely. In that case, look for a retest of 0.00465 as support, with 0.0047 and 0.0048 above.
Live cross-check
I tried to cross-check the live PUMP price, but the results were not reliable. Many Solana DEX pages carry copycat tokens that use the PUMP symbol, and the quotes I found were undated and ranged from about $0.0012 to $0.05. One CoinGecko snapshot showed a 2026 low near $0.0012, which would put the chart’s 0.0041 well above that, but I can’t confirm the timing. I used the timestamped Binance chart price of 0.004120 as the reference. Confirm the current price on the Binance PUMPUSDT contract before entering.
Bottom line
Bearish, with the double top confirmed. The best trade is to sell a retest of 0.00420–0.00432 with a stop above 0.00444 and targets down to 0.00370, or to short a confirmed 1H close below 0.00394. A 1H close above 0.00444 weakens the idea, and above 0.00465 cancels it.
⚠️ Disclaimer: This is not financial advice. This analysis is for educational and informational purposes only. Crypto markets are highly volatile, and you can lose your capital. Always do your own research, manage your risk, and never trade with money you can’t afford to lose.
@Binance Square Official #FedWatch #EarningsSeason #USMidtermElections #Binance #ChartSniper
Chart: PUMP/USDT Perpetual, 1H, Binance. Last price 0.004120 (+1.50%). Time: Oct 29, 21:57 UTC.
What the chart shows
Two equal highs: PUMP topped near 0.00465 on October 28, pulled back, then ran back to the same level on October 29 and failed again. Two matching highs, with sellers capping both, is a classic double top.Neckline: the low between the two tops sits around 0.00417, which is the level to watch.Breakdown: a large red 1H candle sliced through the neckline and dumped price to a low near 0.003943, which you’ve labelled HL.Rejection bounce: the latest candle bounced to 0.004262, but that high was rejected and the candle closed at 0.004120, back below the neckline.Retracement levels: measured from the 0.003943 low to the 0.00465 top, they sit at about 0.004213 (38.2%), 0.004297 (50%) and 0.004380 (61.8%).Supply gap: a bearish FVG sits at about 0.00425–0.00440, right where the retracement levels cluster.Measured move: the pattern is about 0.00048 tall (0.00465 minus 0.00417). Projecting that below the neckline points to roughly 0.00370.
Note that the neckline and level readings come from the chart image, so they are close approximations. Check them on your own screen.
Why it could still bounce
The dump already covered a good part of the measured move (price fell from 0.00417 to 0.003943). The bounce also left a long lower wick, so some buyers are active near 0.0040. Shorting right here, below the neckline and above support, is not the best entry.
Trade plan (short bias)
Setup A: short the neckline retest (preferred)
Entry zone: 0.00420–0.00432, the old neckline, the 38.2%–50% retracement and the base of the bearish FVGStop loss: 0.00444, above the FVG top and the 61.8% levelTP1: 0.00400TP2: 0.00394, the swing lowTP3: 0.00382TP4: 0.00370, the measured-move target
Setup B: breakdown short
Trigger: a 1H candle close below 0.00394Entry: 0.00392–0.00394 on a failed retest from belowStop loss: 0.00405Targets: 0.00382, then 0.00374, then 0.00370
Measured from a 0.00426 entry to the 0.00444 stop, Setup A pays about 1.4R at TP1, 1.8R at TP2, 2.4R at TP3 and 3.1R at TP4. Setup B is tighter, with about 0.9R at the first target and about 1.8R at the last. After TP1, consider moving the stop to breakeven.
What invalidates the bearish idea
A 1H close above 0.00444 means buyers reclaimed the supply gap and the 61.8% level.A strong close above the neckline area and the 0.00432 zone would turn the breakdown into a failed breakdown, which often squeezes shorts.A close above 0.00465 would cancel the double top completely. In that case, look for a retest of 0.00465 as support, with 0.0047 and 0.0048 above.
Live cross-check
I tried to cross-check the live PUMP price, but the results were not reliable. Many Solana DEX pages carry copycat tokens that use the PUMP symbol, and the quotes I found were undated and ranged from about $0.0012 to $0.05. One CoinGecko snapshot showed a 2026 low near $0.0012, which would put the chart’s 0.0041 well above that, but I can’t confirm the timing. I used the timestamped Binance chart price of 0.004120 as the reference. Confirm the current price on the Binance PUMPUSDT contract before entering.
Bottom line
Bearish, with the double top confirmed. The best trade is to sell a retest of 0.00420–0.00432 with a stop above 0.00444 and targets down to 0.00370, or to short a confirmed 1H close below 0.00394. A 1H close above 0.00444 weakens the idea, and above 0.00465 cancels it.
⚠️ Disclaimer: This is not financial advice. This analysis is for educational and informational purposes only. Crypto markets are highly volatile, and you can lose your capital. Always do your own research, manage your risk, and never trade with money you can’t afford to lose.
@Binance Square Official #FedWatch #EarningsSeason #USMidtermElections #Binance #ChartSniper
1
336
·
--
Article
See translation
Oil Gushes Past $100: Good for Oil Bulls, But Is Crypto Next or Next in Line for Pain?$CL
{future}(CLUSDT)
Chart: WTI Crude Oil, 1H, TradingView (TVC feed). Last price 102.86 (+0.10%). Time: Oct 29, 20:57 UTC.
What the oil chart shows
Big Higher Low at 99.25: on October 27, WTI bottomed near 99.25 and then rallied hard.Higher High near 103.55: price pushed up on October 28, clearing the earlier Lower Highs around 102.7–103.0.Pullback to a higher low: WTI then dipped to about 99.8 on October 29, which held above the 99.25 low, and rebounded sharply.Now at resistance: price is at 102.86, just under the prior 103.0 area and the 103.55 high.Fib levels: measured from the 103.59 high to the 99.25 low, retracements sit at about 101.93 (38.2%), 101.42 (50%) and 100.91 (61.8%). Bullish FVGs line up around 102.4–102.7, 101.4–101.7 and 100.9–101.2.Your projected path: the white line points to about 107.4 by early November. Price is currently well below that line, so treat it as a target path, not support.Major support: the marked level at 96.59 is the line the bulls must not lose.
Live cross-check
Live quotes agree closely with the chart. WTI settled around 102.20 on October 29, and other sources show it between roughly 100.85 and 102, with Brent near 110. WTI is up about 78% year to date and sits well above its 50-day (about 94) and 200-day (about 86) averages. The chart’s 102.86 at 20:57 UTC is in line with that. The backdrop is a supply shock tied to the Strait of Hormuz and the Iran conflict, so oil is headline-driven and can reverse sharply in either direction.
Oil trade plan (long bias)
Setup A: pullback entry (preferred)
Entry zone: 101.40–102.00, the 38.2%–50% retracement inside the FVGsStop loss: 100.60, below the 61.8% level and the lower FVGTP1: 103.00TP2: 103.60, the Higher HighTP3: 105.00Extended target: 107.00
Setup B: breakout entry (smaller size)
Entry: a 1H candle close above 103.60, ideally with a retest as supportStop loss: 102.70Targets: 105.00, then 106.00, then 107.40
Measured from a 101.70 entry to the 100.60 stop, TP1 pays about 1.2R, TP2 about 1.7R, TP3 about 3R and the extended target about 4.8R. Setup B pays about 1.4R at the first target and about 3.7R at 107.40. After TP1, consider moving the stop to breakeven.
What invalidates it: a 1H close below 100.60 means the pullback zone failed. A break of the 99.25 Higher Low flips the structure bearish, with 96.59 as the next major support. Given the geopolitical headline risk, keep size modest.
Can oil’s move be the next move for crypto?
Not in the way bulls might hope. Here is how the link works:
Oil does not move crypto directly. It works through inflation, bond yields and the Fed. Higher oil feeds inflation expectations, which can delay rate cuts or even raise the odds of hikes, and tighter money is usually bad for risk assets like crypto.The Fed just reminded us. It held rates at 3.75%–4.00% on October 28, and two members dissented in favor of a hike. Sustained oil strength would strengthen that hawkish camp.There is precedent in recent weeks. On September 28, when oil climbed back above $100, Bitcoin fell about 1.8%, and several reports in recent months tie oil spikes to crypto dips.But Bitcoin has been resilient. BTC held its channel support near 80,000 through the FOMC, so the market is not yet panicking.
So my read: a bullish oil chart is a risk factor for crypto, not a catalyst. If WTI breaks above 103.60 and pushes toward 107 while yields rise, expect pressure on BTC and especially on altcoins. If oil rolls over below 100.60, for example on any easing of the Hormuz situation, that would be relief for crypto, since the inflation worry would fade. The two often move in opposite directions in this kind of shock.
For traders, that means watching oil as a risk gauge: oil breaking out is a reason to tighten stops on crypto longs, and oil breaking down is a reason to be more confident on them.
Bottom line
Oil is bullish on the chart, with a Higher Low, a Higher High and demand underneath at 101.40–102.00. The best entry is a pullback there or a close above 103.60. But oil bulls are not crypto bulls right now. Treat a strong oil breakout as a warning for crypto, and a failed one as a tailwind.
⚠️ Disclaimer: This is not financial advice. This analysis is for educational and informational purposes only. Crypto and commodity markets are highly volatile, and you can lose your capital. Always do your own research, manage your risk, and never trade with money you can’t afford to lose.
@Binance_Square_Official #FedWatch #EarningsSeason #USMidtermElections #Binance #ChartSniper
Oil Gushes Past $100: Good for Oil Bulls, But Is Crypto Next or Next in Line for Pain?
$CL
Chart: WTI Crude Oil, 1H, TradingView (TVC feed). Last price 102.86 (+0.10%). Time: Oct 29, 20:57 UTC.
What the oil chart shows
Big Higher Low at 99.25: on October 27, WTI bottomed near 99.25 and then rallied hard.Higher High near 103.55: price pushed up on October 28, clearing the earlier Lower Highs around 102.7–103.0.Pullback to a higher low: WTI then dipped to about 99.8 on October 29, which held above the 99.25 low, and rebounded sharply.Now at resistance: price is at 102.86, just under the prior 103.0 area and the 103.55 high.Fib levels: measured from the 103.59 high to the 99.25 low, retracements sit at about 101.93 (38.2%), 101.42 (50%) and 100.91 (61.8%). Bullish FVGs line up around 102.4–102.7, 101.4–101.7 and 100.9–101.2.Your projected path: the white line points to about 107.4 by early November. Price is currently well below that line, so treat it as a target path, not support.Major support: the marked level at 96.59 is the line the bulls must not lose.
Live cross-check
Live quotes agree closely with the chart. WTI settled around 102.20 on October 29, and other sources show it between roughly 100.85 and 102, with Brent near 110. WTI is up about 78% year to date and sits well above its 50-day (about 94) and 200-day (about 86) averages. The chart’s 102.86 at 20:57 UTC is in line with that. The backdrop is a supply shock tied to the Strait of Hormuz and the Iran conflict, so oil is headline-driven and can reverse sharply in either direction.
Oil trade plan (long bias)
Setup A: pullback entry (preferred)
Entry zone: 101.40–102.00, the 38.2%–50% retracement inside the FVGsStop loss: 100.60, below the 61.8% level and the lower FVGTP1: 103.00TP2: 103.60, the Higher HighTP3: 105.00Extended target: 107.00
Setup B: breakout entry (smaller size)
Entry: a 1H candle close above 103.60, ideally with a retest as supportStop loss: 102.70Targets: 105.00, then 106.00, then 107.40
Measured from a 101.70 entry to the 100.60 stop, TP1 pays about 1.2R, TP2 about 1.7R, TP3 about 3R and the extended target about 4.8R. Setup B pays about 1.4R at the first target and about 3.7R at 107.40. After TP1, consider moving the stop to breakeven.
What invalidates it: a 1H close below 100.60 means the pullback zone failed. A break of the 99.25 Higher Low flips the structure bearish, with 96.59 as the next major support. Given the geopolitical headline risk, keep size modest.
Can oil’s move be the next move for crypto?
Not in the way bulls might hope. Here is how the link works:
Oil does not move crypto directly. It works through inflation, bond yields and the Fed. Higher oil feeds inflation expectations, which can delay rate cuts or even raise the odds of hikes, and tighter money is usually bad for risk assets like crypto.The Fed just reminded us. It held rates at 3.75%–4.00% on October 28, and two members dissented in favor of a hike. Sustained oil strength would strengthen that hawkish camp.There is precedent in recent weeks. On September 28, when oil climbed back above $100, Bitcoin fell about 1.8%, and several reports in recent months tie oil spikes to crypto dips.But Bitcoin has been resilient. BTC held its channel support near 80,000 through the FOMC, so the market is not yet panicking.
So my read: a bullish oil chart is a risk factor for crypto, not a catalyst. If WTI breaks above 103.60 and pushes toward 107 while yields rise, expect pressure on BTC and especially on altcoins. If oil rolls over below 100.60, for example on any easing of the Hormuz situation, that would be relief for crypto, since the inflation worry would fade. The two often move in opposite directions in this kind of shock.
For traders, that means watching oil as a risk gauge: oil breaking out is a reason to tighten stops on crypto longs, and oil breaking down is a reason to be more confident on them.
Bottom line
Oil is bullish on the chart, with a Higher Low, a Higher High and demand underneath at 101.40–102.00. The best entry is a pullback there or a close above 103.60. But oil bulls are not crypto bulls right now. Treat a strong oil breakout as a warning for crypto, and a failed one as a tailwind.
⚠️ Disclaimer: This is not financial advice. This analysis is for educational and informational purposes only. Crypto and commodity markets are highly volatile, and you can lose your capital. Always do your own research, manage your risk, and never trade with money you can’t afford to lose.
@Binance Square Official #FedWatch #EarningsSeason #USMidtermElections #Binance #ChartSniper
Chart: WTI Crude Oil, 1H, TradingView (TVC feed). Last price 102.86 (+0.10%). Time: Oct 29, 20:57 UTC.
What the oil chart shows
Big Higher Low at 99.25: on October 27, WTI bottomed near 99.25 and then rallied hard.Higher High near 103.55: price pushed up on October 28, clearing the earlier Lower Highs around 102.7–103.0.Pullback to a higher low: WTI then dipped to about 99.8 on October 29, which held above the 99.25 low, and rebounded sharply.Now at resistance: price is at 102.86, just under the prior 103.0 area and the 103.55 high.Fib levels: measured from the 103.59 high to the 99.25 low, retracements sit at about 101.93 (38.2%), 101.42 (50%) and 100.91 (61.8%). Bullish FVGs line up around 102.4–102.7, 101.4–101.7 and 100.9–101.2.Your projected path: the white line points to about 107.4 by early November. Price is currently well below that line, so treat it as a target path, not support.Major support: the marked level at 96.59 is the line the bulls must not lose.
Live cross-check
Live quotes agree closely with the chart. WTI settled around 102.20 on October 29, and other sources show it between roughly 100.85 and 102, with Brent near 110. WTI is up about 78% year to date and sits well above its 50-day (about 94) and 200-day (about 86) averages. The chart’s 102.86 at 20:57 UTC is in line with that. The backdrop is a supply shock tied to the Strait of Hormuz and the Iran conflict, so oil is headline-driven and can reverse sharply in either direction.
Oil trade plan (long bias)
Setup A: pullback entry (preferred)
Entry zone: 101.40–102.00, the 38.2%–50% retracement inside the FVGsStop loss: 100.60, below the 61.8% level and the lower FVGTP1: 103.00TP2: 103.60, the Higher HighTP3: 105.00Extended target: 107.00
Setup B: breakout entry (smaller size)
Entry: a 1H candle close above 103.60, ideally with a retest as supportStop loss: 102.70Targets: 105.00, then 106.00, then 107.40
Measured from a 101.70 entry to the 100.60 stop, TP1 pays about 1.2R, TP2 about 1.7R, TP3 about 3R and the extended target about 4.8R. Setup B pays about 1.4R at the first target and about 3.7R at 107.40. After TP1, consider moving the stop to breakeven.
What invalidates it: a 1H close below 100.60 means the pullback zone failed. A break of the 99.25 Higher Low flips the structure bearish, with 96.59 as the next major support. Given the geopolitical headline risk, keep size modest.
Can oil’s move be the next move for crypto?
Not in the way bulls might hope. Here is how the link works:
Oil does not move crypto directly. It works through inflation, bond yields and the Fed. Higher oil feeds inflation expectations, which can delay rate cuts or even raise the odds of hikes, and tighter money is usually bad for risk assets like crypto.The Fed just reminded us. It held rates at 3.75%–4.00% on October 28, and two members dissented in favor of a hike. Sustained oil strength would strengthen that hawkish camp.There is precedent in recent weeks. On September 28, when oil climbed back above $100, Bitcoin fell about 1.8%, and several reports in recent months tie oil spikes to crypto dips.But Bitcoin has been resilient. BTC held its channel support near 80,000 through the FOMC, so the market is not yet panicking.
So my read: a bullish oil chart is a risk factor for crypto, not a catalyst. If WTI breaks above 103.60 and pushes toward 107 while yields rise, expect pressure on BTC and especially on altcoins. If oil rolls over below 100.60, for example on any easing of the Hormuz situation, that would be relief for crypto, since the inflation worry would fade. The two often move in opposite directions in this kind of shock.
For traders, that means watching oil as a risk gauge: oil breaking out is a reason to tighten stops on crypto longs, and oil breaking down is a reason to be more confident on them.
Bottom line
Oil is bullish on the chart, with a Higher Low, a Higher High and demand underneath at 101.40–102.00. The best entry is a pullback there or a close above 103.60. But oil bulls are not crypto bulls right now. Treat a strong oil breakout as a warning for crypto, and a failed one as a tailwind.
⚠️ Disclaimer: This is not financial advice. This analysis is for educational and informational purposes only. Crypto and commodity markets are highly volatile, and you can lose your capital. Always do your own research, manage your risk, and never trade with money you can’t afford to lose.
@Binance Square Official #FedWatch #EarningsSeason #USMidtermElections #Binance #ChartSniper
470
·
--
Article
See translation
PARTI at the Trendline: Bounce or Break After a Near-Double?$PARTI
{future}(PARTIUSDT)
Chart: PARTI/USDT, 15m, Binance spot. Last price 0.0586 (−0.34%). Time: Oct 29, 20:55 UTC.
Short answer: a bounce is plausible, but this is a high-risk setup. PARTI has roughly doubled in a few hours and is now sitting on its rising trendline. That trendline is where the next move gets decided.
What the chart shows
PARTI traded flat around 0.039 for hours, then dumped about 20% in one candle to a Lower Low near 0.031 around 13:30 UTC. From there it staged a huge rally:
Reversal impulse: price climbed from about 0.031 to a Higher High near 0.0665 by 18:30, taking out the earlier Lower High near 0.049 on the way.Rising trendline: the rally has respected a steep ascending line, and price is sitting right on it at 0.0586.Consolidation: since the high, PARTI has ranged between about 0.0568 and 0.061, with small-bodied candles and a recent red one. That is a pause, not a clear reversal.Retracement levels: measured from the 0.0665 high to the 0.031 low, they sit at about 0.0528 (38.2%), 0.0486 (50%) and 0.0444 (61.8%).Bullish FVGs: stacked gaps sit between roughly 0.048 and 0.055, with more unfilled gaps lower down around 0.033–0.036.
Note that the price axis on this chart is logarithmic, so my level readings are close approximations. Verify exact levels on your own screen.
Will it bounce?
Reasons for a bounce:
Price is holding the ascending trendline, and each dip so far has been bought. The 19:20 wick touched about 0.0527, right at the 38.2% fib, and recovered.Several bullish FVGs sit underneath, so there is demand layered below.
Reasons for caution:
A roughly 2x move in hours is parabolic. Moves like that often retrace 50% or more before any continuation.The trendline is very steep, so it is easily broken and gives little cushion.Recent candles near the line are small, which suggests momentum is fading, not building.This is a small-cap token. My search found it trading around $0.029 on October 18 with a market cap near $6.8M, so liquidity is thin and moves can be violent. I found no news catalyst behind today’s surge.
So a short-term bounce off the line is possible, but the bigger risk is a deeper pullback.
Trade plan (long bias, small size)
Setup A: trendline bounce
Trigger: a 15m candle close above 0.0595 after holding the lineEntry zone: 0.0575–0.0590Stop loss: 0.0558, below the recent swing low and the trendlineTP1: 0.0612TP2: 0.0665, the Higher HighTP3: 0.0700
Setup B: deeper pullback entry (preferred)
Entry zone: 0.0528–0.0545, the 38.2% retracement inside the FVGStop loss: 0.0495, below the lower FVG, and above the 50% levelTP1: 0.0586TP2: 0.0665TP3: 0.0700
Setup C: breakout entry (smaller size)
Entry: a 15m candle close above 0.0665, ideally with a retest as supportStop loss: 0.0630Targets: 0.0700, then 0.0750, then 0.0800
Measured from 0.0580 to the 0.0558 stop, Setup A pays about 1.5R at TP1 and about 3.9R at TP2. Setup B, from 0.0535 to the 0.0495 stop, pays about 1.3R at TP1 and about 3.3R at TP2. After the first target, move the stop to breakeven.
What invalidates the idea
A 15m close below the trendline and 0.0558 means the bounce failed. Expect a move to 0.0528.A close below 0.0486 (the 50% level) means the rally is failing, with 0.0444 and the unfilled gaps near 0.033–0.036 as lower targets.A strong rejection at 0.0665 followed by a lower high would show the surge is exhausted.
Live cross-check
I searched for a live PARTI price. Most pages were stale or forecast-style pages, but dated figures I found, $0.0346 on October 7 and $0.02925 on October 18, are consistent with the chart’s pre-surge base near 0.031. I could not find a quote for today’s trading, so I used the timestamped Binance chart price of 0.0586 as the reference. Confirm the current price on Binance before entering. On a thin 15m chart, levels can shift in minutes.
Bottom line
Will it bounce? Possibly, at the trendline, but don’t count on it. Entry is safer on a confirmed close above 0.0595, or better, on a deeper pullback to 0.0528–0.0545. Keep size small, because a near-doubling in hours can reverse just as fast. A 15m close below 0.0558 cancels the trendline idea.
⚠️ Disclaimer: This is not financial advice. This analysis is for educational and informational purposes only. Crypto markets are highly volatile, and you can lose your capital. Always do your own research, manage your risk, and never trade with money you can’t afford to lose.
@Binance_Square_Official #FedWatch #EarningsSeason #USMidtermElections #Binance #ChartSniper
PARTI at the Trendline: Bounce or Break After a Near-Double?
$PARTI
Chart: PARTI/USDT, 15m, Binance spot. Last price 0.0586 (−0.34%). Time: Oct 29, 20:55 UTC.
Short answer: a bounce is plausible, but this is a high-risk setup. PARTI has roughly doubled in a few hours and is now sitting on its rising trendline. That trendline is where the next move gets decided.
What the chart shows
PARTI traded flat around 0.039 for hours, then dumped about 20% in one candle to a Lower Low near 0.031 around 13:30 UTC. From there it staged a huge rally:
Reversal impulse: price climbed from about 0.031 to a Higher High near 0.0665 by 18:30, taking out the earlier Lower High near 0.049 on the way.Rising trendline: the rally has respected a steep ascending line, and price is sitting right on it at 0.0586.Consolidation: since the high, PARTI has ranged between about 0.0568 and 0.061, with small-bodied candles and a recent red one. That is a pause, not a clear reversal.Retracement levels: measured from the 0.0665 high to the 0.031 low, they sit at about 0.0528 (38.2%), 0.0486 (50%) and 0.0444 (61.8%).Bullish FVGs: stacked gaps sit between roughly 0.048 and 0.055, with more unfilled gaps lower down around 0.033–0.036.
Note that the price axis on this chart is logarithmic, so my level readings are close approximations. Verify exact levels on your own screen.
Will it bounce?
Reasons for a bounce:
Price is holding the ascending trendline, and each dip so far has been bought. The 19:20 wick touched about 0.0527, right at the 38.2% fib, and recovered.Several bullish FVGs sit underneath, so there is demand layered below.
Reasons for caution:
A roughly 2x move in hours is parabolic. Moves like that often retrace 50% or more before any continuation.The trendline is very steep, so it is easily broken and gives little cushion.Recent candles near the line are small, which suggests momentum is fading, not building.This is a small-cap token. My search found it trading around $0.029 on October 18 with a market cap near $6.8M, so liquidity is thin and moves can be violent. I found no news catalyst behind today’s surge.
So a short-term bounce off the line is possible, but the bigger risk is a deeper pullback.
Trade plan (long bias, small size)
Setup A: trendline bounce
Trigger: a 15m candle close above 0.0595 after holding the lineEntry zone: 0.0575–0.0590Stop loss: 0.0558, below the recent swing low and the trendlineTP1: 0.0612TP2: 0.0665, the Higher HighTP3: 0.0700
Setup B: deeper pullback entry (preferred)
Entry zone: 0.0528–0.0545, the 38.2% retracement inside the FVGStop loss: 0.0495, below the lower FVG, and above the 50% levelTP1: 0.0586TP2: 0.0665TP3: 0.0700
Setup C: breakout entry (smaller size)
Entry: a 15m candle close above 0.0665, ideally with a retest as supportStop loss: 0.0630Targets: 0.0700, then 0.0750, then 0.0800
Measured from 0.0580 to the 0.0558 stop, Setup A pays about 1.5R at TP1 and about 3.9R at TP2. Setup B, from 0.0535 to the 0.0495 stop, pays about 1.3R at TP1 and about 3.3R at TP2. After the first target, move the stop to breakeven.
What invalidates the idea
A 15m close below the trendline and 0.0558 means the bounce failed. Expect a move to 0.0528.A close below 0.0486 (the 50% level) means the rally is failing, with 0.0444 and the unfilled gaps near 0.033–0.036 as lower targets.A strong rejection at 0.0665 followed by a lower high would show the surge is exhausted.
Live cross-check
I searched for a live PARTI price. Most pages were stale or forecast-style pages, but dated figures I found, $0.0346 on October 7 and $0.02925 on October 18, are consistent with the chart’s pre-surge base near 0.031. I could not find a quote for today’s trading, so I used the timestamped Binance chart price of 0.0586 as the reference. Confirm the current price on Binance before entering. On a thin 15m chart, levels can shift in minutes.
Bottom line
Will it bounce? Possibly, at the trendline, but don’t count on it. Entry is safer on a confirmed close above 0.0595, or better, on a deeper pullback to 0.0528–0.0545. Keep size small, because a near-doubling in hours can reverse just as fast. A 15m close below 0.0558 cancels the trendline idea.
⚠️ Disclaimer: This is not financial advice. This analysis is for educational and informational purposes only. Crypto markets are highly volatile, and you can lose your capital. Always do your own research, manage your risk, and never trade with money you can’t afford to lose.
@Binance Square Official #FedWatch #EarningsSeason #USMidtermElections #Binance #ChartSniper
Chart: PARTI/USDT, 15m, Binance spot. Last price 0.0586 (−0.34%). Time: Oct 29, 20:55 UTC.
Short answer: a bounce is plausible, but this is a high-risk setup. PARTI has roughly doubled in a few hours and is now sitting on its rising trendline. That trendline is where the next move gets decided.
What the chart shows
PARTI traded flat around 0.039 for hours, then dumped about 20% in one candle to a Lower Low near 0.031 around 13:30 UTC. From there it staged a huge rally:
Reversal impulse: price climbed from about 0.031 to a Higher High near 0.0665 by 18:30, taking out the earlier Lower High near 0.049 on the way.Rising trendline: the rally has respected a steep ascending line, and price is sitting right on it at 0.0586.Consolidation: since the high, PARTI has ranged between about 0.0568 and 0.061, with small-bodied candles and a recent red one. That is a pause, not a clear reversal.Retracement levels: measured from the 0.0665 high to the 0.031 low, they sit at about 0.0528 (38.2%), 0.0486 (50%) and 0.0444 (61.8%).Bullish FVGs: stacked gaps sit between roughly 0.048 and 0.055, with more unfilled gaps lower down around 0.033–0.036.
Note that the price axis on this chart is logarithmic, so my level readings are close approximations. Verify exact levels on your own screen.
Will it bounce?
Reasons for a bounce:
Price is holding the ascending trendline, and each dip so far has been bought. The 19:20 wick touched about 0.0527, right at the 38.2% fib, and recovered.Several bullish FVGs sit underneath, so there is demand layered below.
Reasons for caution:
A roughly 2x move in hours is parabolic. Moves like that often retrace 50% or more before any continuation.The trendline is very steep, so it is easily broken and gives little cushion.Recent candles near the line are small, which suggests momentum is fading, not building.This is a small-cap token. My search found it trading around $0.029 on October 18 with a market cap near $6.8M, so liquidity is thin and moves can be violent. I found no news catalyst behind today’s surge.
So a short-term bounce off the line is possible, but the bigger risk is a deeper pullback.
Trade plan (long bias, small size)
Setup A: trendline bounce
Trigger: a 15m candle close above 0.0595 after holding the lineEntry zone: 0.0575–0.0590Stop loss: 0.0558, below the recent swing low and the trendlineTP1: 0.0612TP2: 0.0665, the Higher HighTP3: 0.0700
Setup B: deeper pullback entry (preferred)
Entry zone: 0.0528–0.0545, the 38.2% retracement inside the FVGStop loss: 0.0495, below the lower FVG, and above the 50% levelTP1: 0.0586TP2: 0.0665TP3: 0.0700
Setup C: breakout entry (smaller size)
Entry: a 15m candle close above 0.0665, ideally with a retest as supportStop loss: 0.0630Targets: 0.0700, then 0.0750, then 0.0800
Measured from 0.0580 to the 0.0558 stop, Setup A pays about 1.5R at TP1 and about 3.9R at TP2. Setup B, from 0.0535 to the 0.0495 stop, pays about 1.3R at TP1 and about 3.3R at TP2. After the first target, move the stop to breakeven.
What invalidates the idea
A 15m close below the trendline and 0.0558 means the bounce failed. Expect a move to 0.0528.A close below 0.0486 (the 50% level) means the rally is failing, with 0.0444 and the unfilled gaps near 0.033–0.036 as lower targets.A strong rejection at 0.0665 followed by a lower high would show the surge is exhausted.
Live cross-check
I searched for a live PARTI price. Most pages were stale or forecast-style pages, but dated figures I found, $0.0346 on October 7 and $0.02925 on October 18, are consistent with the chart’s pre-surge base near 0.031. I could not find a quote for today’s trading, so I used the timestamped Binance chart price of 0.0586 as the reference. Confirm the current price on Binance before entering. On a thin 15m chart, levels can shift in minutes.
Bottom line
Will it bounce? Possibly, at the trendline, but don’t count on it. Entry is safer on a confirmed close above 0.0595, or better, on a deeper pullback to 0.0528–0.0545. Keep size small, because a near-doubling in hours can reverse just as fast. A 15m close below 0.0558 cancels the trendline idea.
⚠️ Disclaimer: This is not financial advice. This analysis is for educational and informational purposes only. Crypto markets are highly volatile, and you can lose your capital. Always do your own research, manage your risk, and never trade with money you can’t afford to lose.
@Binance Square Official #FedWatch #EarningsSeason #USMidtermElections #Binance #ChartSniper
248
·
--
Article
See translation
STRK All Aboard: Bouncing Off the Channel Floor, Is the Bull Ride On?$STRK
{future}(STRKUSDT)
Chart: STRK/USDT Perpetual, 15m, Binance. Last price 0.04784 (+0.63%). Time: Oct 28, 20:11 UTC.
Short answer: bullish, but don’t chase here. STRK just bounced hard off the floor of a rising channel and is now close to the ceiling. The better trade is a pullback entry, not a buy at the top of the move.
What the chart shows
STRK has been moving inside a clean ascending channel since October 26. The structure on the chart reads like this:
Lower High and Lower Low early on: price dipped to about 0.0452 in the middle of the channel.Higher High near 0.0481: price pushed up and tagged the upper channel line.Higher Low near 0.0453: price then dropped and touched the lower channel line exactly, which is textbook support.Sharp bounce: from that Higher Low, STRK jumped about 5–6% in a series of strong green candles back to 0.0478–0.0480.
Retracement levels measured from the 0.0482 high to the 0.0453 low land at about 0.0471 (38.2%), 0.0468 (50%) and 0.0464 (61.8%). Bullish fair value gaps sit around 0.0473–0.0476, 0.0469–0.0471 and 0.0461–0.0463, so there is demand layered underneath.
The catch
Price is now almost at the upper channel line (~0.0483) and just under the previous Higher High at 0.0481. The last candle spiked up with an upper wick. Buying here means risking a drop to the channel floor to make a small gain to the ceiling, and that is poor risk/reward. The bullish structure is real, but the entry matters.
Trade plan (long bias)
Setup A: pullback entry (preferred)
Entry zone: 0.0468–0.0471, which is the 38.2%–50% retracement inside the FVGStop loss: 0.0461, below the 61.8% level and the lowest FVGTP1: 0.0481, the Higher HighTP2: 0.0486TP3: 0.0490, where the channel ceiling sits around October 30TP4: 0.0495
Setup B: breakout entry (smaller size)
Entry: a 15m candle close above 0.0484, ideally with a retest of the channel line as supportStop loss: 0.0475Targets: 0.0490, then 0.0500 (a round-number magnet). If the channel breaks, this leg can extend.
Measured from a 0.0470 entry to the 0.0461 stop, TP1 pays about 1.2R, TP2 about 1.8R, TP3 about 2.2R and TP4 about 2.8R. Setup B has a thinner reward until it clears the ceiling, so keep size small. After TP1, consider moving the stop to breakeven.
What invalidates the idea
A 15m close below 0.0461 means the retracement zone and the lowest FVG failed.A break of the channel floor, around 0.0457 and rising, followed by a close below the 0.0453 Higher Low would flip the structure bearish.If price rejects the channel ceiling at 0.0483 and quickly gives back the whole bounce, the move was a spike, not a trend.
Live cross-check
I searched for a live STRK price, but results were very scattered and mostly stale, ranging from about $0.02 to $0.48 depending on the source and date. One undated eToro quote near $0.045 is in the same neighborhood as the chart, but I can’t confirm the timing. I used the timestamped Binance chart price of 0.04784 as the reference. Confirm the current price on Binance before entering. On a 15m chart the levels move fast, so recheck them before you act.
Bottom line
Bullish? Yes, structurally. STRK defended the channel floor with a Higher Low and bounced strongly. But it is now at the top of the channel, so the clean entry is a pullback to 0.0468–0.0471, or a confirmed close above 0.0484. A close below 0.0461 cancels the idea.
⚠️ Disclaimer: This is not financial advice. This analysis is for educational and informational purposes only. Crypto markets are highly volatile, and you can lose your capital. Always do your own research, manage your risk, and never trade with money you can’t afford to lose.
@Binance_Square_Official #CanMicrosoftDeliverOnAI #CanGoogleDefindItsCore #EarningsSeason #Binance #ChartSniper
STRK All Aboard: Bouncing Off the Channel Floor, Is the Bull Ride On?
$STRK
Chart: STRK/USDT Perpetual, 15m, Binance. Last price 0.04784 (+0.63%). Time: Oct 28, 20:11 UTC.
Short answer: bullish, but don’t chase here. STRK just bounced hard off the floor of a rising channel and is now close to the ceiling. The better trade is a pullback entry, not a buy at the top of the move.
What the chart shows
STRK has been moving inside a clean ascending channel since October 26. The structure on the chart reads like this:
Lower High and Lower Low early on: price dipped to about 0.0452 in the middle of the channel.Higher High near 0.0481: price pushed up and tagged the upper channel line.Higher Low near 0.0453: price then dropped and touched the lower channel line exactly, which is textbook support.Sharp bounce: from that Higher Low, STRK jumped about 5–6% in a series of strong green candles back to 0.0478–0.0480.
Retracement levels measured from the 0.0482 high to the 0.0453 low land at about 0.0471 (38.2%), 0.0468 (50%) and 0.0464 (61.8%). Bullish fair value gaps sit around 0.0473–0.0476, 0.0469–0.0471 and 0.0461–0.0463, so there is demand layered underneath.
The catch
Price is now almost at the upper channel line (~0.0483) and just under the previous Higher High at 0.0481. The last candle spiked up with an upper wick. Buying here means risking a drop to the channel floor to make a small gain to the ceiling, and that is poor risk/reward. The bullish structure is real, but the entry matters.
Trade plan (long bias)
Setup A: pullback entry (preferred)
Entry zone: 0.0468–0.0471, which is the 38.2%–50% retracement inside the FVGStop loss: 0.0461, below the 61.8% level and the lowest FVGTP1: 0.0481, the Higher HighTP2: 0.0486TP3: 0.0490, where the channel ceiling sits around October 30TP4: 0.0495
Setup B: breakout entry (smaller size)
Entry: a 15m candle close above 0.0484, ideally with a retest of the channel line as supportStop loss: 0.0475Targets: 0.0490, then 0.0500 (a round-number magnet). If the channel breaks, this leg can extend.
Measured from a 0.0470 entry to the 0.0461 stop, TP1 pays about 1.2R, TP2 about 1.8R, TP3 about 2.2R and TP4 about 2.8R. Setup B has a thinner reward until it clears the ceiling, so keep size small. After TP1, consider moving the stop to breakeven.
What invalidates the idea
A 15m close below 0.0461 means the retracement zone and the lowest FVG failed.A break of the channel floor, around 0.0457 and rising, followed by a close below the 0.0453 Higher Low would flip the structure bearish.If price rejects the channel ceiling at 0.0483 and quickly gives back the whole bounce, the move was a spike, not a trend.
Live cross-check
I searched for a live STRK price, but results were very scattered and mostly stale, ranging from about $0.02 to $0.48 depending on the source and date. One undated eToro quote near $0.045 is in the same neighborhood as the chart, but I can’t confirm the timing. I used the timestamped Binance chart price of 0.04784 as the reference. Confirm the current price on Binance before entering. On a 15m chart the levels move fast, so recheck them before you act.
Bottom line
Bullish? Yes, structurally. STRK defended the channel floor with a Higher Low and bounced strongly. But it is now at the top of the channel, so the clean entry is a pullback to 0.0468–0.0471, or a confirmed close above 0.0484. A close below 0.0461 cancels the idea.
⚠️ Disclaimer: This is not financial advice. This analysis is for educational and informational purposes only. Crypto markets are highly volatile, and you can lose your capital. Always do your own research, manage your risk, and never trade with money you can’t afford to lose.
@Binance Square Official #CanMicrosoftDeliverOnAI #CanGoogleDefindItsCore #EarningsSeason #Binance #ChartSniper
Chart: STRK/USDT Perpetual, 15m, Binance. Last price 0.04784 (+0.63%). Time: Oct 28, 20:11 UTC.
Short answer: bullish, but don’t chase here. STRK just bounced hard off the floor of a rising channel and is now close to the ceiling. The better trade is a pullback entry, not a buy at the top of the move.
What the chart shows
STRK has been moving inside a clean ascending channel since October 26. The structure on the chart reads like this:
Lower High and Lower Low early on: price dipped to about 0.0452 in the middle of the channel.Higher High near 0.0481: price pushed up and tagged the upper channel line.Higher Low near 0.0453: price then dropped and touched the lower channel line exactly, which is textbook support.Sharp bounce: from that Higher Low, STRK jumped about 5–6% in a series of strong green candles back to 0.0478–0.0480.
Retracement levels measured from the 0.0482 high to the 0.0453 low land at about 0.0471 (38.2%), 0.0468 (50%) and 0.0464 (61.8%). Bullish fair value gaps sit around 0.0473–0.0476, 0.0469–0.0471 and 0.0461–0.0463, so there is demand layered underneath.
The catch
Price is now almost at the upper channel line (~0.0483) and just under the previous Higher High at 0.0481. The last candle spiked up with an upper wick. Buying here means risking a drop to the channel floor to make a small gain to the ceiling, and that is poor risk/reward. The bullish structure is real, but the entry matters.
Trade plan (long bias)
Setup A: pullback entry (preferred)
Entry zone: 0.0468–0.0471, which is the 38.2%–50% retracement inside the FVGStop loss: 0.0461, below the 61.8% level and the lowest FVGTP1: 0.0481, the Higher HighTP2: 0.0486TP3: 0.0490, where the channel ceiling sits around October 30TP4: 0.0495
Setup B: breakout entry (smaller size)
Entry: a 15m candle close above 0.0484, ideally with a retest of the channel line as supportStop loss: 0.0475Targets: 0.0490, then 0.0500 (a round-number magnet). If the channel breaks, this leg can extend.
Measured from a 0.0470 entry to the 0.0461 stop, TP1 pays about 1.2R, TP2 about 1.8R, TP3 about 2.2R and TP4 about 2.8R. Setup B has a thinner reward until it clears the ceiling, so keep size small. After TP1, consider moving the stop to breakeven.
What invalidates the idea
A 15m close below 0.0461 means the retracement zone and the lowest FVG failed.A break of the channel floor, around 0.0457 and rising, followed by a close below the 0.0453 Higher Low would flip the structure bearish.If price rejects the channel ceiling at 0.0483 and quickly gives back the whole bounce, the move was a spike, not a trend.
Live cross-check
I searched for a live STRK price, but results were very scattered and mostly stale, ranging from about $0.02 to $0.48 depending on the source and date. One undated eToro quote near $0.045 is in the same neighborhood as the chart, but I can’t confirm the timing. I used the timestamped Binance chart price of 0.04784 as the reference. Confirm the current price on Binance before entering. On a 15m chart the levels move fast, so recheck them before you act.
Bottom line
Bullish? Yes, structurally. STRK defended the channel floor with a Higher Low and bounced strongly. But it is now at the top of the channel, so the clean entry is a pullback to 0.0468–0.0471, or a confirmed close above 0.0484. A close below 0.0461 cancels the idea.
⚠️ Disclaimer: This is not financial advice. This analysis is for educational and informational purposes only. Crypto markets are highly volatile, and you can lose your capital. Always do your own research, manage your risk, and never trade with money you can’t afford to lose.
@Binance Square Official #CanMicrosoftDeliverOnAI #CanGoogleDefindItsCore #EarningsSeason #Binance #ChartSniper
406
·
--
Article
See translation
ARB/USDT: The Spring Is Loaded — Is Arbitrum Ready to Snap Back?$ARB
{future}(ARBUSDT)
Chart: ARB/USDT, 1H, Binance. Last price 0.1732 (+0.87%).
Short answer: cautiously bullish. ARB has just broken its short-term downtrend structure, and the next move depends on whether the pullback holds.
What the chart shows
From October 23 to 28, ARB made a clear series of lower highs and lower lows. The sellers were in control, and price slid from around 0.186 into the 0.163 area.
That changed on October 28. Price printed a Higher Low near 0.1633, then ran hard into a Higher High at 0.1743, just above the previous Lower High (~0.173). A small break, but it is the first higher high after a week of lower ones, and that is a real shift in structure.
Three things back it up:
Trendline support: the rising white line from the Higher Low is holding. Price is trading above it.Bullish FVG: the impulse left a fair value gap between roughly 0.1672 and 0.1714, which is a likely demand zone on any dip.Fib confluence: measured from the 0.1743 high to the 0.1633 low, the retracement levels line up with that gap. The 38.2% sits near 0.1701, the 50% near 0.1688 and the 61.8% near 0.1674.
The caution
This is one impulse leg on the 1H chart, not a confirmed trend reversal. Overhead there are untested bearish FVG zones around 0.1770–0.1800 and 0.1860. Price also sits right at the 0.1743 high, and chasing a green candle into resistance is how late buyers get trapped. The better entry is on a pullback or a confirmed break, not here.
Trade plan (long bias)
Setup A: pullback entry (preferred)
Entry zone: 0.1688–0.1701 (38.2%–50% retracement, inside the FVG)Stop loss: 0.1660, below the 61.8% level and the base of the FVGTP1: 0.1743 (the Higher High)TP2: 0.1780TP3: 0.1820Extended target: 0.1860 if momentum carries
Setup B: breakout entry
Entry: a 1H candle close above 0.1745, ideally with a retest of 0.1743 as supportStop loss: 0.1712, below the retest zoneTargets: 0.1780, then 0.1820, then 0.1860
Measured from the midpoint of the entry zone (0.1695) to the 0.1660 stop, TP1 pays roughly 1.4R and TP2 roughly 2.4R. After TP1, consider moving the stop to breakeven.
What invalidates the idea
A 1H close below 0.1660 means the fib support and the FVG failed. Stand aside.A break of the 0.1633 Higher Low puts the downtrend back in control, and lower lows become likely.If price breaks the rising trendline and cannot reclaim it quickly, the bounce was probably just a relief move.
Live chart cross-check
I searched for a live ARB price, but the sources returned stale or inconsistent figures, anywhere from about $0.08 to $0.59 depending on the site and date, and none matched this chart. I treated the timestamped Binance chart price of 0.1732 as the reference. Before entering, confirm the current price on Binance. If it has already moved well away from the levels above, adjust the plan.
Bottom line
Bullish, but conditional. ARB has put in a Higher Low and a Higher High, with trendline and FVG support underneath. The cleanest trade is a patient pullback into 0.1688–0.1701, or a confirmed close above 0.1745. A 1H close below 0.1660 cancels the setup.
⚠️ Disclaimer: This is not financial advice. This analysis is for educational and informational purposes only. Crypto markets are highly volatile, and you can lose your capital. Always do your own research, manage your risk, and never trade with money you can’t afford to lose.
@Binance_Square_Official #CanMicrosoftDeliverOnAI #CanGoogleDefindItsCore #EarningsSeason #Binance #ChartSniper
ARB/USDT: The Spring Is Loaded — Is Arbitrum Ready to Snap Back?
$ARB
Chart: ARB/USDT, 1H, Binance. Last price 0.1732 (+0.87%).
Short answer: cautiously bullish. ARB has just broken its short-term downtrend structure, and the next move depends on whether the pullback holds.
What the chart shows
From October 23 to 28, ARB made a clear series of lower highs and lower lows. The sellers were in control, and price slid from around 0.186 into the 0.163 area.
That changed on October 28. Price printed a Higher Low near 0.1633, then ran hard into a Higher High at 0.1743, just above the previous Lower High (~0.173). A small break, but it is the first higher high after a week of lower ones, and that is a real shift in structure.
Three things back it up:
Trendline support: the rising white line from the Higher Low is holding. Price is trading above it.Bullish FVG: the impulse left a fair value gap between roughly 0.1672 and 0.1714, which is a likely demand zone on any dip.Fib confluence: measured from the 0.1743 high to the 0.1633 low, the retracement levels line up with that gap. The 38.2% sits near 0.1701, the 50% near 0.1688 and the 61.8% near 0.1674.
The caution
This is one impulse leg on the 1H chart, not a confirmed trend reversal. Overhead there are untested bearish FVG zones around 0.1770–0.1800 and 0.1860. Price also sits right at the 0.1743 high, and chasing a green candle into resistance is how late buyers get trapped. The better entry is on a pullback or a confirmed break, not here.
Trade plan (long bias)
Setup A: pullback entry (preferred)
Entry zone: 0.1688–0.1701 (38.2%–50% retracement, inside the FVG)Stop loss: 0.1660, below the 61.8% level and the base of the FVGTP1: 0.1743 (the Higher High)TP2: 0.1780TP3: 0.1820Extended target: 0.1860 if momentum carries
Setup B: breakout entry
Entry: a 1H candle close above 0.1745, ideally with a retest of 0.1743 as supportStop loss: 0.1712, below the retest zoneTargets: 0.1780, then 0.1820, then 0.1860
Measured from the midpoint of the entry zone (0.1695) to the 0.1660 stop, TP1 pays roughly 1.4R and TP2 roughly 2.4R. After TP1, consider moving the stop to breakeven.
What invalidates the idea
A 1H close below 0.1660 means the fib support and the FVG failed. Stand aside.A break of the 0.1633 Higher Low puts the downtrend back in control, and lower lows become likely.If price breaks the rising trendline and cannot reclaim it quickly, the bounce was probably just a relief move.
Live chart cross-check
I searched for a live ARB price, but the sources returned stale or inconsistent figures, anywhere from about $0.08 to $0.59 depending on the site and date, and none matched this chart. I treated the timestamped Binance chart price of 0.1732 as the reference. Before entering, confirm the current price on Binance. If it has already moved well away from the levels above, adjust the plan.
Bottom line
Bullish, but conditional. ARB has put in a Higher Low and a Higher High, with trendline and FVG support underneath. The cleanest trade is a patient pullback into 0.1688–0.1701, or a confirmed close above 0.1745. A 1H close below 0.1660 cancels the setup.
⚠️ Disclaimer: This is not financial advice. This analysis is for educational and informational purposes only. Crypto markets are highly volatile, and you can lose your capital. Always do your own research, manage your risk, and never trade with money you can’t afford to lose.
@Binance Square Official #CanMicrosoftDeliverOnAI #CanGoogleDefindItsCore #EarningsSeason #Binance #ChartSniper
Chart: ARB/USDT, 1H, Binance. Last price 0.1732 (+0.87%).
Short answer: cautiously bullish. ARB has just broken its short-term downtrend structure, and the next move depends on whether the pullback holds.
What the chart shows
From October 23 to 28, ARB made a clear series of lower highs and lower lows. The sellers were in control, and price slid from around 0.186 into the 0.163 area.
That changed on October 28. Price printed a Higher Low near 0.1633, then ran hard into a Higher High at 0.1743, just above the previous Lower High (~0.173). A small break, but it is the first higher high after a week of lower ones, and that is a real shift in structure.
Three things back it up:
Trendline support: the rising white line from the Higher Low is holding. Price is trading above it.Bullish FVG: the impulse left a fair value gap between roughly 0.1672 and 0.1714, which is a likely demand zone on any dip.Fib confluence: measured from the 0.1743 high to the 0.1633 low, the retracement levels line up with that gap. The 38.2% sits near 0.1701, the 50% near 0.1688 and the 61.8% near 0.1674.
The caution
This is one impulse leg on the 1H chart, not a confirmed trend reversal. Overhead there are untested bearish FVG zones around 0.1770–0.1800 and 0.1860. Price also sits right at the 0.1743 high, and chasing a green candle into resistance is how late buyers get trapped. The better entry is on a pullback or a confirmed break, not here.
Trade plan (long bias)
Setup A: pullback entry (preferred)
Entry zone: 0.1688–0.1701 (38.2%–50% retracement, inside the FVG)Stop loss: 0.1660, below the 61.8% level and the base of the FVGTP1: 0.1743 (the Higher High)TP2: 0.1780TP3: 0.1820Extended target: 0.1860 if momentum carries
Setup B: breakout entry
Entry: a 1H candle close above 0.1745, ideally with a retest of 0.1743 as supportStop loss: 0.1712, below the retest zoneTargets: 0.1780, then 0.1820, then 0.1860
Measured from the midpoint of the entry zone (0.1695) to the 0.1660 stop, TP1 pays roughly 1.4R and TP2 roughly 2.4R. After TP1, consider moving the stop to breakeven.
What invalidates the idea
A 1H close below 0.1660 means the fib support and the FVG failed. Stand aside.A break of the 0.1633 Higher Low puts the downtrend back in control, and lower lows become likely.If price breaks the rising trendline and cannot reclaim it quickly, the bounce was probably just a relief move.
Live chart cross-check
I searched for a live ARB price, but the sources returned stale or inconsistent figures, anywhere from about $0.08 to $0.59 depending on the site and date, and none matched this chart. I treated the timestamped Binance chart price of 0.1732 as the reference. Before entering, confirm the current price on Binance. If it has already moved well away from the levels above, adjust the plan.
Bottom line
Bullish, but conditional. ARB has put in a Higher Low and a Higher High, with trendline and FVG support underneath. The cleanest trade is a patient pullback into 0.1688–0.1701, or a confirmed close above 0.1745. A 1H close below 0.1660 cancels the setup.
⚠️ Disclaimer: This is not financial advice. This analysis is for educational and informational purposes only. Crypto markets are highly volatile, and you can lose your capital. Always do your own research, manage your risk, and never trade with money you can’t afford to lose.
@Binance Square Official #CanMicrosoftDeliverOnAI #CanGoogleDefindItsCore #EarningsSeason #Binance #ChartSniper
379
·
--
Article
See translation
Chart: SSV/USDT, 1H, Binance. Last price 2.525 (+0.16%). Time: Oct 28, 20:06 UTC.Short answer: beari$SSV
{future}(SSVUSDT)
Chart: SSV/USDT, 1H, Binance. Last price 2.525 (+0.16%). Time: Oct 28, 20:06 UTC.
Short answer: bearish bias, but only on the right trigger. This looks like a weak counter-trend bounce inside a bigger downtrend. Selling the middle of the channel is not the trade. The cleaner shorts come at supply or after a breakdown.
Note on volume: you flagged low volume, and the chart image I was given doesn’t show a volume panel, so I’ve taken your read as given. Low volume behind a rally is a classic sign of weak conviction, but it only matters if price actually rejects.
What the chart shows
From October 24 to 27, SSV bled from about 2.62 down to a swing low near 2.35, which the chart marks as a Higher Low relative to the nearby structure. Since then it has climbed in a tidy rising channel, printing a Higher High near 2.54, with small pullbacks along the way.
Rising channel: price is riding inside two parallel rising lines. This kind of recovery after a hard drop often turns out to be a bear-flag-style bounce, not a trend change.Supply box overhead: the marked zone sits at about 2.57–2.65, which is where the October 24 breakdown started.Fib confluence: the retracement drawn on the left of the chart puts the 61.8% level near 2.56, the 50% near 2.58 and the 38.2% near 2.59. That stacks right inside the supply zone.Bullish FVGs under price: the bounce left small gaps around 2.49–2.50, 2.52–2.53 and 2.43–2.45. They are short-term support, but each one is also a level where buyers can run out.
Why the bearish case makes sense
The bounce is up roughly 7% from the low and has run straight into stacked resistance: the supply box, the fib cluster and the old breakdown area. If volume is thin, as you noted, there is little buying pressure to push through that zone. A final push to about 2.57–2.60 followed by a rejection is the path your chart is drawn for.
Why it isn’t a sure thing
Price is still making higher highs and higher lows inside the channel, and it has not yet broken down. Shorting at 2.525 means betting against the current trend with no rejection yet. A strong close above 2.65 would break the supply box and cancel the bearish idea.
Trade plan
Setup A: short on rejection at supply (preferred)
Entry zone: 2.56–2.59, only after bearish rejection candles, such as upper wicks or a 1H close back below the zoneStop loss: 2.63, above the fib cluster and the wick highsTP1: 2.50TP2: 2.45, the channel base areaTP3: 2.40TP4: 2.34, near the Higher Low
Setup B: short on a channel breakdown
Trigger: a 1H candle close below the channel base and the 2.43–2.45 swing levelEntry: 2.42–2.44 on a failed retest from belowStop loss: 2.48Targets: 2.38, then 2.34, then 2.31
Optional aggressive long (counter to the bias)
Entry: 2.49–2.50 inside the FVGStop loss: 2.455Target: 2.555, just under supply. Treat it as a quick scalp, not a swing.
Measured from a 2.575 entry to the 2.63 stop, TP1 pays about 1.4R, TP2 about 2.3R, TP3 about 3.2R and TP4 about 4.3R. Setup B pays about 1.1R at TP1 and about 2.0R at TP2. After TP1, consider moving the stop to breakeven.
What invalidates the bearish idea
A 1H close above 2.65, the top of the supply box, means sellers lost control of that zone. Stand aside or look for longs.A fast break and hold above 2.60 before any rejection candle appears also weakens the case.If price keeps printing higher lows along the channel and holds above 2.49, the bounce is stronger than it looks.
Live cross-check
I searched for a live SSV price, but results were scattered and mostly stale, ranging from roughly $2.01 to $11 depending on the source, and most pages showed no timestamp. A few figures around $2.25–$2.39 loosely bracket the chart’s range but are not confirmed. I used the timestamped Binance chart price of 2.525 as the reference. Confirm the current price on Binance before entering.
Bottom line
Bearish? Yes, conditionally. SSV is bouncing on thin volume into a stacked supply zone, so a rejection at 2.56–2.60 is the best short setup, with targets down to 2.34. Don’t short the mid-channel, and respect the stop above 2.63. A close above 2.65 cancels the whole idea.
⚠️ Disclaimer: This is not financial advice. This analysis is for educational and informational purposes only. Crypto markets are highly volatile, and you can lose your capital. Always do your own research, manage your risk, and never trade with money you can’t afford to lose.
@Binance_Square_Official #CanMicrosoftDeliverOnAI #CanGoogleDefindItsCore #EarningsSeason #Binance #ChartSniper
Chart: SSV/USDT, 1H, Binance. Last price 2.525 (+0.16%). Time: Oct 28, 20:06 UTC.Short answer: beari
$SSV
Chart: SSV/USDT, 1H, Binance. Last price 2.525 (+0.16%). Time: Oct 28, 20:06 UTC.
Short answer: bearish bias, but only on the right trigger. This looks like a weak counter-trend bounce inside a bigger downtrend. Selling the middle of the channel is not the trade. The cleaner shorts come at supply or after a breakdown.
Note on volume: you flagged low volume, and the chart image I was given doesn’t show a volume panel, so I’ve taken your read as given. Low volume behind a rally is a classic sign of weak conviction, but it only matters if price actually rejects.
What the chart shows
From October 24 to 27, SSV bled from about 2.62 down to a swing low near 2.35, which the chart marks as a Higher Low relative to the nearby structure. Since then it has climbed in a tidy rising channel, printing a Higher High near 2.54, with small pullbacks along the way.
Rising channel: price is riding inside two parallel rising lines. This kind of recovery after a hard drop often turns out to be a bear-flag-style bounce, not a trend change.Supply box overhead: the marked zone sits at about 2.57–2.65, which is where the October 24 breakdown started.Fib confluence: the retracement drawn on the left of the chart puts the 61.8% level near 2.56, the 50% near 2.58 and the 38.2% near 2.59. That stacks right inside the supply zone.Bullish FVGs under price: the bounce left small gaps around 2.49–2.50, 2.52–2.53 and 2.43–2.45. They are short-term support, but each one is also a level where buyers can run out.
Why the bearish case makes sense
The bounce is up roughly 7% from the low and has run straight into stacked resistance: the supply box, the fib cluster and the old breakdown area. If volume is thin, as you noted, there is little buying pressure to push through that zone. A final push to about 2.57–2.60 followed by a rejection is the path your chart is drawn for.
Why it isn’t a sure thing
Price is still making higher highs and higher lows inside the channel, and it has not yet broken down. Shorting at 2.525 means betting against the current trend with no rejection yet. A strong close above 2.65 would break the supply box and cancel the bearish idea.
Trade plan
Setup A: short on rejection at supply (preferred)
Entry zone: 2.56–2.59, only after bearish rejection candles, such as upper wicks or a 1H close back below the zoneStop loss: 2.63, above the fib cluster and the wick highsTP1: 2.50TP2: 2.45, the channel base areaTP3: 2.40TP4: 2.34, near the Higher Low
Setup B: short on a channel breakdown
Trigger: a 1H candle close below the channel base and the 2.43–2.45 swing levelEntry: 2.42–2.44 on a failed retest from belowStop loss: 2.48Targets: 2.38, then 2.34, then 2.31
Optional aggressive long (counter to the bias)
Entry: 2.49–2.50 inside the FVGStop loss: 2.455Target: 2.555, just under supply. Treat it as a quick scalp, not a swing.
Measured from a 2.575 entry to the 2.63 stop, TP1 pays about 1.4R, TP2 about 2.3R, TP3 about 3.2R and TP4 about 4.3R. Setup B pays about 1.1R at TP1 and about 2.0R at TP2. After TP1, consider moving the stop to breakeven.
What invalidates the bearish idea
A 1H close above 2.65, the top of the supply box, means sellers lost control of that zone. Stand aside or look for longs.A fast break and hold above 2.60 before any rejection candle appears also weakens the case.If price keeps printing higher lows along the channel and holds above 2.49, the bounce is stronger than it looks.
Live cross-check
I searched for a live SSV price, but results were scattered and mostly stale, ranging from roughly $2.01 to $11 depending on the source, and most pages showed no timestamp. A few figures around $2.25–$2.39 loosely bracket the chart’s range but are not confirmed. I used the timestamped Binance chart price of 2.525 as the reference. Confirm the current price on Binance before entering.
Bottom line
Bearish? Yes, conditionally. SSV is bouncing on thin volume into a stacked supply zone, so a rejection at 2.56–2.60 is the best short setup, with targets down to 2.34. Don’t short the mid-channel, and respect the stop above 2.63. A close above 2.65 cancels the whole idea.
⚠️ Disclaimer: This is not financial advice. This analysis is for educational and informational purposes only. Crypto markets are highly volatile, and you can lose your capital. Always do your own research, manage your risk, and never trade with money you can’t afford to lose.
@Binance Square Official #CanMicrosoftDeliverOnAI #CanGoogleDefindItsCore #EarningsSeason #Binance #ChartSniper
Chart: SSV/USDT, 1H, Binance. Last price 2.525 (+0.16%). Time: Oct 28, 20:06 UTC.
Short answer: bearish bias, but only on the right trigger. This looks like a weak counter-trend bounce inside a bigger downtrend. Selling the middle of the channel is not the trade. The cleaner shorts come at supply or after a breakdown.
Note on volume: you flagged low volume, and the chart image I was given doesn’t show a volume panel, so I’ve taken your read as given. Low volume behind a rally is a classic sign of weak conviction, but it only matters if price actually rejects.
What the chart shows
From October 24 to 27, SSV bled from about 2.62 down to a swing low near 2.35, which the chart marks as a Higher Low relative to the nearby structure. Since then it has climbed in a tidy rising channel, printing a Higher High near 2.54, with small pullbacks along the way.
Rising channel: price is riding inside two parallel rising lines. This kind of recovery after a hard drop often turns out to be a bear-flag-style bounce, not a trend change.Supply box overhead: the marked zone sits at about 2.57–2.65, which is where the October 24 breakdown started.Fib confluence: the retracement drawn on the left of the chart puts the 61.8% level near 2.56, the 50% near 2.58 and the 38.2% near 2.59. That stacks right inside the supply zone.Bullish FVGs under price: the bounce left small gaps around 2.49–2.50, 2.52–2.53 and 2.43–2.45. They are short-term support, but each one is also a level where buyers can run out.
Why the bearish case makes sense
The bounce is up roughly 7% from the low and has run straight into stacked resistance: the supply box, the fib cluster and the old breakdown area. If volume is thin, as you noted, there is little buying pressure to push through that zone. A final push to about 2.57–2.60 followed by a rejection is the path your chart is drawn for.
Why it isn’t a sure thing
Price is still making higher highs and higher lows inside the channel, and it has not yet broken down. Shorting at 2.525 means betting against the current trend with no rejection yet. A strong close above 2.65 would break the supply box and cancel the bearish idea.
Trade plan
Setup A: short on rejection at supply (preferred)
Entry zone: 2.56–2.59, only after bearish rejection candles, such as upper wicks or a 1H close back below the zoneStop loss: 2.63, above the fib cluster and the wick highsTP1: 2.50TP2: 2.45, the channel base areaTP3: 2.40TP4: 2.34, near the Higher Low
Setup B: short on a channel breakdown
Trigger: a 1H candle close below the channel base and the 2.43–2.45 swing levelEntry: 2.42–2.44 on a failed retest from belowStop loss: 2.48Targets: 2.38, then 2.34, then 2.31
Optional aggressive long (counter to the bias)
Entry: 2.49–2.50 inside the FVGStop loss: 2.455Target: 2.555, just under supply. Treat it as a quick scalp, not a swing.
Measured from a 2.575 entry to the 2.63 stop, TP1 pays about 1.4R, TP2 about 2.3R, TP3 about 3.2R and TP4 about 4.3R. Setup B pays about 1.1R at TP1 and about 2.0R at TP2. After TP1, consider moving the stop to breakeven.
What invalidates the bearish idea
A 1H close above 2.65, the top of the supply box, means sellers lost control of that zone. Stand aside or look for longs.A fast break and hold above 2.60 before any rejection candle appears also weakens the case.If price keeps printing higher lows along the channel and holds above 2.49, the bounce is stronger than it looks.
Live cross-check
I searched for a live SSV price, but results were scattered and mostly stale, ranging from roughly $2.01 to $11 depending on the source, and most pages showed no timestamp. A few figures around $2.25–$2.39 loosely bracket the chart’s range but are not confirmed. I used the timestamped Binance chart price of 2.525 as the reference. Confirm the current price on Binance before entering.
Bottom line
Bearish? Yes, conditionally. SSV is bouncing on thin volume into a stacked supply zone, so a rejection at 2.56–2.60 is the best short setup, with targets down to 2.34. Don’t short the mid-channel, and respect the stop above 2.63. A close above 2.65 cancels the whole idea.
⚠️ Disclaimer: This is not financial advice. This analysis is for educational and informational purposes only. Crypto markets are highly volatile, and you can lose your capital. Always do your own research, manage your risk, and never trade with money you can’t afford to lose.
@Binance Square Official #CanMicrosoftDeliverOnAI #CanGoogleDefindItsCore #EarningsSeason #Binance #ChartSniper
1.2k
·
--
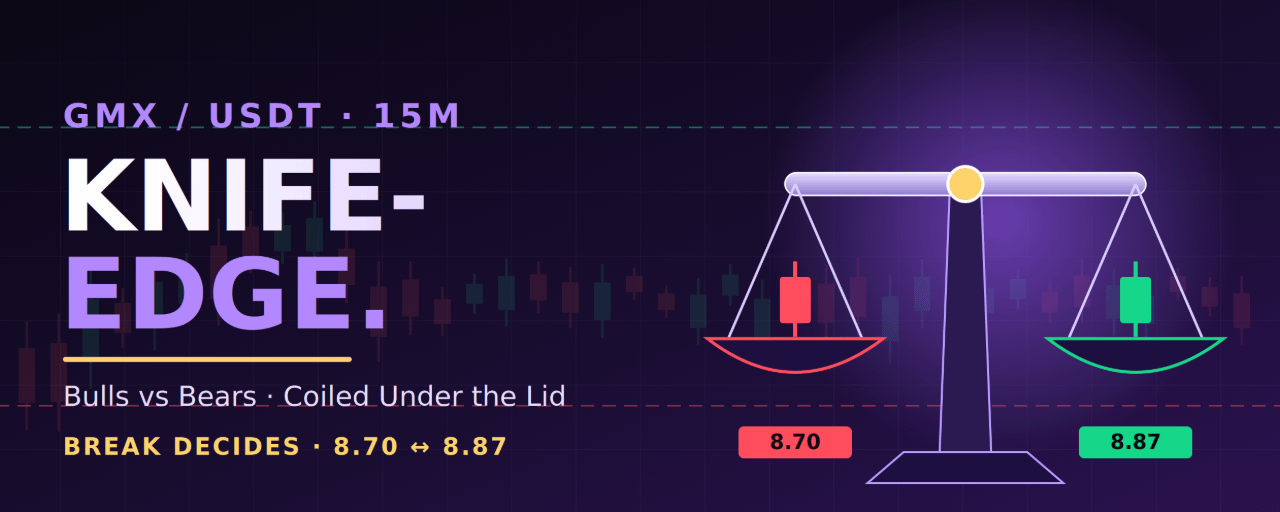
Article
See translation
GMX on a Knife-Edge: Coiled Under the Lid, Which Way Does the Break Go?$GMX
{future}(GMXUSDT)
Chart: GMX/USDT Perpetual, 15m, Binance. Last price 8.841 (+0.33%). Time: Oct 28, 20:00 UTC.
Short answer: not bearish yet. GMX is stuck in a tight range, and the first side to break it decides the trade. The structure leans slightly bullish while price holds the range lows, and it turns bearish only if support gives way.
What the chart shows
GMX climbed steadily through the morning from about 7.90 to a Higher High near 9.05–9.08. Then came a violent single-candle dump that wicked down to roughly 8.22. Buyers stepped in right away and drove price back above 8.80. Since then GMX has been consolidating between about 8.70 and 8.87.
Higher Low intact: the 8.22 low is still above the earlier swing lows, so the bigger structure is up.Fresh Lower High: the range has capped at about 8.86–8.87, which is the bears’ line in the sand.Fib levels: drawn from the 9.08 high to the 8.22 low, they sit at about 8.75 (38.2%), 8.65 (50%) and 8.55 (61.8%). Price is trading above all of them.FVG demand: bullish fair value gaps sit under the range, around 8.70–8.75 and 8.43–8.50. A bearish FVG near 8.90–8.92 caps price on the upside.
The market went from a sharp dump to a tight, orderly range with price near the highs. That is usually digestion, not distribution, but the dump candle left overhead supply that has to be cleared.
Why it isn’t cleanly bullish either
The range is narrow and the lid at ~8.87 has not been broken.The 8.90–9.08 zone still holds the dump’s origin and a bearish FVG. That is where sellers last had control.Compression like this ends in expansion. Without volume, the first breakout can be a fake.
Trade plan
Setup A: long on a pullback (preferred while the range holds)
Entry zone: 8.74–8.77, the 38.2% level inside the FVG demand zoneStop loss: 8.66, below the FVG and the range baseTP1: 8.86TP2: 8.92TP3: 9.00Extended target: 9.07 (the Higher High)
Setup B: long on a breakout
Entry: a 15m candle close above 8.87, ideally with a retest of 8.87 as supportStop loss: 8.78Targets: 8.95, then 9.00, then 9.07
Setup C: short if the range breaks down (the bearish scenario)
Trigger: a 15m candle close below 8.70, then a retest of 8.70 from below that failsEntry: 8.66–8.70Stop loss: 8.78TP1: 8.55TP2: 8.45TP3: 8.22, the Higher Low and the 100% fib
Measured from the middle of the Setup A entry zone (8.755) to the 8.66 stop, TP1 pays about 1.2R, TP2 about 1.7R and TP3 about 2.6R. The short setup pays about 1.5R at TP1 and about 2.5R at TP2. After the first target, consider moving the stop to breakeven.
What invalidates what
The bullish idea fails if price closes a 15m candle below 8.66. That breaks the FVG and fib support.The bearish idea fails if price reclaims 8.87 and holds above it.A close below 8.22 would break the Higher Low and flip the larger structure bearish. That is not the current situation.
Live cross-check
I searched for a live GMX price, but results were stale or inconsistent. Quotes ranged from about $7.94 on an undated page to roughly $30 on others, and none matched the chart’s timestamp. I used the timestamped Binance chart price of 8.841 as the reference. Confirm the current price on Binance before entering. On a 15m chart, levels can shift quickly.
Bottom line
Bearish? Not yet. Price is holding a Higher Low and consolidating near the top of its range. The cleaner trades are a pullback long at 8.74–8.77 or a long on a close above 8.87. If 8.70 breaks and fails on the retest, the short toward 8.55 and 8.45 becomes valid. Let the range break first, then trade it.
⚠️ Disclaimer: This is not financial advice. This analysis is for educational and informational purposes only. Crypto markets are highly volatile, and you can lose your capital. Always do your own research, manage your risk, and never trade with money you can’t afford to lose.
@Binance_Square_Official #CanMicrosoftDeliverOnAI #CanGoogleDefindItsCore #EarningsSeason #Binance #ChartSniper
GMX on a Knife-Edge: Coiled Under the Lid, Which Way Does the Break Go?
$GMX
Chart: GMX/USDT Perpetual, 15m, Binance. Last price 8.841 (+0.33%). Time: Oct 28, 20:00 UTC.
Short answer: not bearish yet. GMX is stuck in a tight range, and the first side to break it decides the trade. The structure leans slightly bullish while price holds the range lows, and it turns bearish only if support gives way.
What the chart shows
GMX climbed steadily through the morning from about 7.90 to a Higher High near 9.05–9.08. Then came a violent single-candle dump that wicked down to roughly 8.22. Buyers stepped in right away and drove price back above 8.80. Since then GMX has been consolidating between about 8.70 and 8.87.
Higher Low intact: the 8.22 low is still above the earlier swing lows, so the bigger structure is up.Fresh Lower High: the range has capped at about 8.86–8.87, which is the bears’ line in the sand.Fib levels: drawn from the 9.08 high to the 8.22 low, they sit at about 8.75 (38.2%), 8.65 (50%) and 8.55 (61.8%). Price is trading above all of them.FVG demand: bullish fair value gaps sit under the range, around 8.70–8.75 and 8.43–8.50. A bearish FVG near 8.90–8.92 caps price on the upside.
The market went from a sharp dump to a tight, orderly range with price near the highs. That is usually digestion, not distribution, but the dump candle left overhead supply that has to be cleared.
Why it isn’t cleanly bullish either
The range is narrow and the lid at ~8.87 has not been broken.The 8.90–9.08 zone still holds the dump’s origin and a bearish FVG. That is where sellers last had control.Compression like this ends in expansion. Without volume, the first breakout can be a fake.
Trade plan
Setup A: long on a pullback (preferred while the range holds)
Entry zone: 8.74–8.77, the 38.2% level inside the FVG demand zoneStop loss: 8.66, below the FVG and the range baseTP1: 8.86TP2: 8.92TP3: 9.00Extended target: 9.07 (the Higher High)
Setup B: long on a breakout
Entry: a 15m candle close above 8.87, ideally with a retest of 8.87 as supportStop loss: 8.78Targets: 8.95, then 9.00, then 9.07
Setup C: short if the range breaks down (the bearish scenario)
Trigger: a 15m candle close below 8.70, then a retest of 8.70 from below that failsEntry: 8.66–8.70Stop loss: 8.78TP1: 8.55TP2: 8.45TP3: 8.22, the Higher Low and the 100% fib
Measured from the middle of the Setup A entry zone (8.755) to the 8.66 stop, TP1 pays about 1.2R, TP2 about 1.7R and TP3 about 2.6R. The short setup pays about 1.5R at TP1 and about 2.5R at TP2. After the first target, consider moving the stop to breakeven.
What invalidates what
The bullish idea fails if price closes a 15m candle below 8.66. That breaks the FVG and fib support.The bearish idea fails if price reclaims 8.87 and holds above it.A close below 8.22 would break the Higher Low and flip the larger structure bearish. That is not the current situation.
Live cross-check
I searched for a live GMX price, but results were stale or inconsistent. Quotes ranged from about $7.94 on an undated page to roughly $30 on others, and none matched the chart’s timestamp. I used the timestamped Binance chart price of 8.841 as the reference. Confirm the current price on Binance before entering. On a 15m chart, levels can shift quickly.
Bottom line
Bearish? Not yet. Price is holding a Higher Low and consolidating near the top of its range. The cleaner trades are a pullback long at 8.74–8.77 or a long on a close above 8.87. If 8.70 breaks and fails on the retest, the short toward 8.55 and 8.45 becomes valid. Let the range break first, then trade it.
⚠️ Disclaimer: This is not financial advice. This analysis is for educational and informational purposes only. Crypto markets are highly volatile, and you can lose your capital. Always do your own research, manage your risk, and never trade with money you can’t afford to lose.
@Binance Square Official #CanMicrosoftDeliverOnAI #CanGoogleDefindItsCore #EarningsSeason #Binance #ChartSniper
Chart: GMX/USDT Perpetual, 15m, Binance. Last price 8.841 (+0.33%). Time: Oct 28, 20:00 UTC.
Short answer: not bearish yet. GMX is stuck in a tight range, and the first side to break it decides the trade. The structure leans slightly bullish while price holds the range lows, and it turns bearish only if support gives way.
What the chart shows
GMX climbed steadily through the morning from about 7.90 to a Higher High near 9.05–9.08. Then came a violent single-candle dump that wicked down to roughly 8.22. Buyers stepped in right away and drove price back above 8.80. Since then GMX has been consolidating between about 8.70 and 8.87.
Higher Low intact: the 8.22 low is still above the earlier swing lows, so the bigger structure is up.Fresh Lower High: the range has capped at about 8.86–8.87, which is the bears’ line in the sand.Fib levels: drawn from the 9.08 high to the 8.22 low, they sit at about 8.75 (38.2%), 8.65 (50%) and 8.55 (61.8%). Price is trading above all of them.FVG demand: bullish fair value gaps sit under the range, around 8.70–8.75 and 8.43–8.50. A bearish FVG near 8.90–8.92 caps price on the upside.
The market went from a sharp dump to a tight, orderly range with price near the highs. That is usually digestion, not distribution, but the dump candle left overhead supply that has to be cleared.
Why it isn’t cleanly bullish either
The range is narrow and the lid at ~8.87 has not been broken.The 8.90–9.08 zone still holds the dump’s origin and a bearish FVG. That is where sellers last had control.Compression like this ends in expansion. Without volume, the first breakout can be a fake.
Trade plan
Setup A: long on a pullback (preferred while the range holds)
Entry zone: 8.74–8.77, the 38.2% level inside the FVG demand zoneStop loss: 8.66, below the FVG and the range baseTP1: 8.86TP2: 8.92TP3: 9.00Extended target: 9.07 (the Higher High)
Setup B: long on a breakout
Entry: a 15m candle close above 8.87, ideally with a retest of 8.87 as supportStop loss: 8.78Targets: 8.95, then 9.00, then 9.07
Setup C: short if the range breaks down (the bearish scenario)
Trigger: a 15m candle close below 8.70, then a retest of 8.70 from below that failsEntry: 8.66–8.70Stop loss: 8.78TP1: 8.55TP2: 8.45TP3: 8.22, the Higher Low and the 100% fib
Measured from the middle of the Setup A entry zone (8.755) to the 8.66 stop, TP1 pays about 1.2R, TP2 about 1.7R and TP3 about 2.6R. The short setup pays about 1.5R at TP1 and about 2.5R at TP2. After the first target, consider moving the stop to breakeven.
What invalidates what
The bullish idea fails if price closes a 15m candle below 8.66. That breaks the FVG and fib support.The bearish idea fails if price reclaims 8.87 and holds above it.A close below 8.22 would break the Higher Low and flip the larger structure bearish. That is not the current situation.
Live cross-check
I searched for a live GMX price, but results were stale or inconsistent. Quotes ranged from about $7.94 on an undated page to roughly $30 on others, and none matched the chart’s timestamp. I used the timestamped Binance chart price of 8.841 as the reference. Confirm the current price on Binance before entering. On a 15m chart, levels can shift quickly.
Bottom line
Bearish? Not yet. Price is holding a Higher Low and consolidating near the top of its range. The cleaner trades are a pullback long at 8.74–8.77 or a long on a close above 8.87. If 8.70 breaks and fails on the retest, the short toward 8.55 and 8.45 becomes valid. Let the range break first, then trade it.
⚠️ Disclaimer: This is not financial advice. This analysis is for educational and informational purposes only. Crypto markets are highly volatile, and you can lose your capital. Always do your own research, manage your risk, and never trade with money you can’t afford to lose.
@Binance Square Official #CanMicrosoftDeliverOnAI #CanGoogleDefindItsCore #EarningsSeason #Binance #ChartSniper
118
·
--
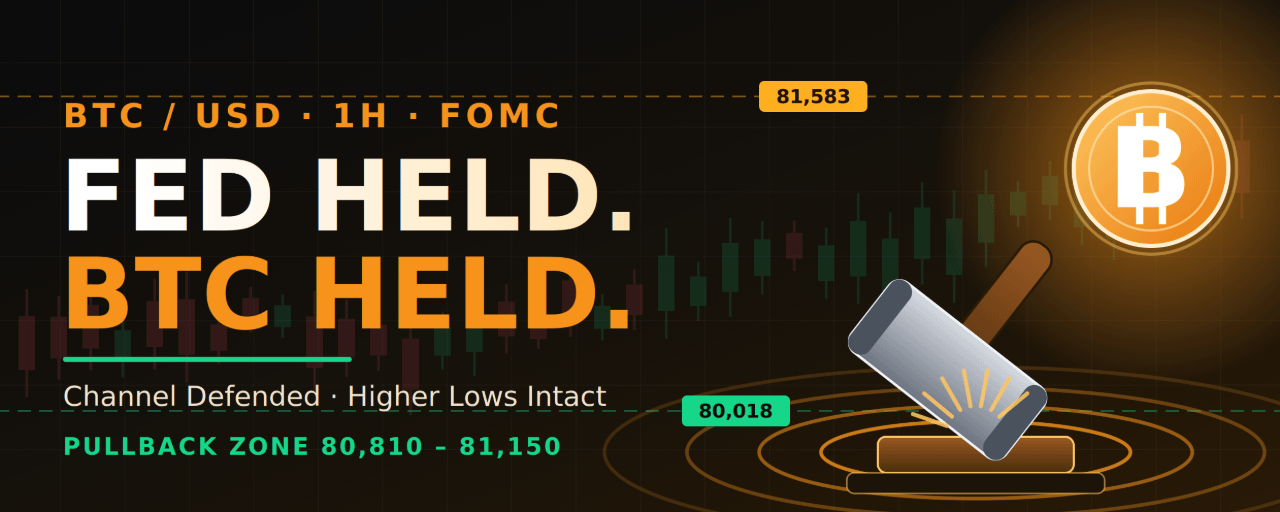
Article
See translation
Fed Held, Bitcoin Held: Is BTC Setting Up for Its Next Leg Up?$BTC
{future}(BTCUSDT)
Chart: BTC/USD, 1H. Last price 81,367.53 (+0.56%). Time: Oct 28, 19:53 UTC.
Note: this chart is BTC/USD from TradingView’s crypto feed, not BTC/USDT on Binance. The levels will be very close, but check the Binance BTC/USDT price before you place anything.
Short answer: bullish, but conditional. The structure is constructive. The macro backdrop is not a free pass.
What the Fed did
The Fed held rates at 3.75%–4.00% on October 28. The vote was 10–2, and both dissenters wanted a hike. So the hold was expected, but the tone leaned hawkish. Bitcoin took it calmly, rising from about 80,000 before the decision to roughly 81,000–81,400 afterwards. Markets now watch the PCE inflation print and the December meeting, which stays open.
Calm digestion of a hawkish hold is a good sign. It is not the same as a green light.
What the chart shows
Channel support defended. BTC dipped to about 80,270, tagged the rising trendline, and bounced hard. That is a Higher Low inside a rising channel from the 79,400 area.Impulse after the dip. The latest candle pushed back above the short descending trendline drawn from the 81,700 Lower High.Fib zone. Measured from the ~81,680 high to the ~80,270 low:38.2% ≈ 81,15050% ≈ 80,98061.8% ≈ 80,810Fair value gaps. A bullish FVG sits around 80,810–80,900, inside the retracement zone. Another sits near 80,270, at the swing low.Key horizontals. Resistance is 81,583, then the 81,700 Lower High. Support is 80,018, which lines up with the 80,000 level traders have been watching all week.
What’s holding it back
Price is pressing right into the 81,583–81,700 supply zone. A bounce into resistance is not a breakout. News sources also point to the ~81,800 area (the 50-day average) as the real test, with the 84,000 range top above it. Until BTC closes above that, this is a recovery inside a range, not a new trend.
Trade plan (long bias)
Setup A: pullback entry (preferred)
Entry zone: 80,810–81,150, the 38.2%–61.8% retracement with FVG supportStop loss: 80,550, below the FVG, the 61.8% level and the rising trendline. A 1H close below it cancels the setup.TP1: 81,583TP2: 81,800TP3: 82,500, near the upper channel lineExtended target: 83,000+ if momentum holds
Setup B: breakout entry
Entry: a 1H candle close above 81,800, ideally with a retest of 81,583–81,700 as supportStop loss: 81,350Targets: 82,500, then 83,000, then 84,000
Measured from a 81,000 entry to the 80,550 stop, TP1 pays about 1.3R, TP2 about 1.8R and TP3 about 3.3R. After TP1, consider moving the stop to breakeven.
What invalidates the idea
A 1H close below 80,550 means the pullback zone has failed.A break below the 80,018 support line, with price holding below it, puts the range low in play, and the 79,100 sweep low is the next area bears will target.A hot PCE print or hawkish December signals can reverse risk assets fast. Keep position sizes sensible around data releases.
Live cross-check
Chart and news roughly agree. Articles written after the decision put BTC around 81,100, and the chart shows 81,367. I searched for the latest price, but most results were stale, so I could not confirm today’s live quote. I used the timestamped chart price (81,367.53) and the post-FOMC reports as the reference. Confirm the current price on Binance before entering. I also did not find the PCE result, so check that too.
Bottom line
Yes, bullish, with the right conditions. BTC held channel support through a hawkish-leaning FOMC and printed a Higher Low. The best risk/reward is a patient pullback into 80,810–81,150, or a confirmed close above 81,800. A close below 80,550 would cancel the setup.
⚠️ Disclaimer: This is not financial advice. This analysis is for educational and informational purposes only. Crypto markets are highly volatile, and you can lose your capital. Always do your own research, manage your risk, and never trade with money you can’t afford to lose.
@Binance_Square_Official #CanMicrosoftDeliverOnAI #CanGoogleDefindItsCore #EarningsSeason #Binance #ChartSniper
Fed Held, Bitcoin Held: Is BTC Setting Up for Its Next Leg Up?
$BTC
Chart: BTC/USD, 1H. Last price 81,367.53 (+0.56%). Time: Oct 28, 19:53 UTC.
Note: this chart is BTC/USD from TradingView’s crypto feed, not BTC/USDT on Binance. The levels will be very close, but check the Binance BTC/USDT price before you place anything.
Short answer: bullish, but conditional. The structure is constructive. The macro backdrop is not a free pass.
What the Fed did
The Fed held rates at 3.75%–4.00% on October 28. The vote was 10–2, and both dissenters wanted a hike. So the hold was expected, but the tone leaned hawkish. Bitcoin took it calmly, rising from about 80,000 before the decision to roughly 81,000–81,400 afterwards. Markets now watch the PCE inflation print and the December meeting, which stays open.
Calm digestion of a hawkish hold is a good sign. It is not the same as a green light.
What the chart shows
Channel support defended. BTC dipped to about 80,270, tagged the rising trendline, and bounced hard. That is a Higher Low inside a rising channel from the 79,400 area.Impulse after the dip. The latest candle pushed back above the short descending trendline drawn from the 81,700 Lower High.Fib zone. Measured from the ~81,680 high to the ~80,270 low:38.2% ≈ 81,15050% ≈ 80,98061.8% ≈ 80,810Fair value gaps. A bullish FVG sits around 80,810–80,900, inside the retracement zone. Another sits near 80,270, at the swing low.Key horizontals. Resistance is 81,583, then the 81,700 Lower High. Support is 80,018, which lines up with the 80,000 level traders have been watching all week.
What’s holding it back
Price is pressing right into the 81,583–81,700 supply zone. A bounce into resistance is not a breakout. News sources also point to the ~81,800 area (the 50-day average) as the real test, with the 84,000 range top above it. Until BTC closes above that, this is a recovery inside a range, not a new trend.
Trade plan (long bias)
Setup A: pullback entry (preferred)
Entry zone: 80,810–81,150, the 38.2%–61.8% retracement with FVG supportStop loss: 80,550, below the FVG, the 61.8% level and the rising trendline. A 1H close below it cancels the setup.TP1: 81,583TP2: 81,800TP3: 82,500, near the upper channel lineExtended target: 83,000+ if momentum holds
Setup B: breakout entry
Entry: a 1H candle close above 81,800, ideally with a retest of 81,583–81,700 as supportStop loss: 81,350Targets: 82,500, then 83,000, then 84,000
Measured from a 81,000 entry to the 80,550 stop, TP1 pays about 1.3R, TP2 about 1.8R and TP3 about 3.3R. After TP1, consider moving the stop to breakeven.
What invalidates the idea
A 1H close below 80,550 means the pullback zone has failed.A break below the 80,018 support line, with price holding below it, puts the range low in play, and the 79,100 sweep low is the next area bears will target.A hot PCE print or hawkish December signals can reverse risk assets fast. Keep position sizes sensible around data releases.
Live cross-check
Chart and news roughly agree. Articles written after the decision put BTC around 81,100, and the chart shows 81,367. I searched for the latest price, but most results were stale, so I could not confirm today’s live quote. I used the timestamped chart price (81,367.53) and the post-FOMC reports as the reference. Confirm the current price on Binance before entering. I also did not find the PCE result, so check that too.
Bottom line
Yes, bullish, with the right conditions. BTC held channel support through a hawkish-leaning FOMC and printed a Higher Low. The best risk/reward is a patient pullback into 80,810–81,150, or a confirmed close above 81,800. A close below 80,550 would cancel the setup.
⚠️ Disclaimer: This is not financial advice. This analysis is for educational and informational purposes only. Crypto markets are highly volatile, and you can lose your capital. Always do your own research, manage your risk, and never trade with money you can’t afford to lose.
@Binance Square Official #CanMicrosoftDeliverOnAI #CanGoogleDefindItsCore #EarningsSeason #Binance #ChartSniper
Chart: BTC/USD, 1H. Last price 81,367.53 (+0.56%). Time: Oct 28, 19:53 UTC.
Note: this chart is BTC/USD from TradingView’s crypto feed, not BTC/USDT on Binance. The levels will be very close, but check the Binance BTC/USDT price before you place anything.
Short answer: bullish, but conditional. The structure is constructive. The macro backdrop is not a free pass.
What the Fed did
The Fed held rates at 3.75%–4.00% on October 28. The vote was 10–2, and both dissenters wanted a hike. So the hold was expected, but the tone leaned hawkish. Bitcoin took it calmly, rising from about 80,000 before the decision to roughly 81,000–81,400 afterwards. Markets now watch the PCE inflation print and the December meeting, which stays open.
Calm digestion of a hawkish hold is a good sign. It is not the same as a green light.
What the chart shows
Channel support defended. BTC dipped to about 80,270, tagged the rising trendline, and bounced hard. That is a Higher Low inside a rising channel from the 79,400 area.Impulse after the dip. The latest candle pushed back above the short descending trendline drawn from the 81,700 Lower High.Fib zone. Measured from the ~81,680 high to the ~80,270 low:38.2% ≈ 81,15050% ≈ 80,98061.8% ≈ 80,810Fair value gaps. A bullish FVG sits around 80,810–80,900, inside the retracement zone. Another sits near 80,270, at the swing low.Key horizontals. Resistance is 81,583, then the 81,700 Lower High. Support is 80,018, which lines up with the 80,000 level traders have been watching all week.
What’s holding it back
Price is pressing right into the 81,583–81,700 supply zone. A bounce into resistance is not a breakout. News sources also point to the ~81,800 area (the 50-day average) as the real test, with the 84,000 range top above it. Until BTC closes above that, this is a recovery inside a range, not a new trend.
Trade plan (long bias)
Setup A: pullback entry (preferred)
Entry zone: 80,810–81,150, the 38.2%–61.8% retracement with FVG supportStop loss: 80,550, below the FVG, the 61.8% level and the rising trendline. A 1H close below it cancels the setup.TP1: 81,583TP2: 81,800TP3: 82,500, near the upper channel lineExtended target: 83,000+ if momentum holds
Setup B: breakout entry
Entry: a 1H candle close above 81,800, ideally with a retest of 81,583–81,700 as supportStop loss: 81,350Targets: 82,500, then 83,000, then 84,000
Measured from a 81,000 entry to the 80,550 stop, TP1 pays about 1.3R, TP2 about 1.8R and TP3 about 3.3R. After TP1, consider moving the stop to breakeven.
What invalidates the idea
A 1H close below 80,550 means the pullback zone has failed.A break below the 80,018 support line, with price holding below it, puts the range low in play, and the 79,100 sweep low is the next area bears will target.A hot PCE print or hawkish December signals can reverse risk assets fast. Keep position sizes sensible around data releases.
Live cross-check
Chart and news roughly agree. Articles written after the decision put BTC around 81,100, and the chart shows 81,367. I searched for the latest price, but most results were stale, so I could not confirm today’s live quote. I used the timestamped chart price (81,367.53) and the post-FOMC reports as the reference. Confirm the current price on Binance before entering. I also did not find the PCE result, so check that too.
Bottom line
Yes, bullish, with the right conditions. BTC held channel support through a hawkish-leaning FOMC and printed a Higher Low. The best risk/reward is a patient pullback into 80,810–81,150, or a confirmed close above 81,800. A close below 80,550 would cancel the setup.
⚠️ Disclaimer: This is not financial advice. This analysis is for educational and informational purposes only. Crypto markets are highly volatile, and you can lose your capital. Always do your own research, manage your risk, and never trade with money you can’t afford to lose.
@Binance Square Official #CanMicrosoftDeliverOnAI #CanGoogleDefindItsCore #EarningsSeason #Binance #ChartSniper
91
·
--
Article
See translation
NMR/USDT Double Top Alert: Bears Circle 11.38 After a Sharp Rejection$NMR
{future}(NMRUSDT)
NMR/USDT Perpetual | 1H | Binance | Price: 11.460
You asked if this chart is bearish. It’s a conditional yes. The structure is still tilted up, since price just printed a Higher High near 11.58 above the old lower high around 11.47. But the way that high formed looks like a classic exhaustion move, and the short setup is worth planning.
Why the bears have a case
Price spiked to roughly 11.58, then printed a long upper wick and a red candle that gave back most of the move. That candle carried the biggest volume bar of the recent session, a high-volume rejection at the top of the range. The chart marks it as a double top, with that spike sitting right at the prior lower high near 11.47. The move up also stalled against a falling-volume backdrop, and the volume line is still well above the latest bars (13.41K now against a 20K average).
The marked range runs from about 11.17 to 11.58. Price is sitting in its upper half, which leaves room to drop.
Key levels
11.58: the rejection high and the invalidation line.11.50–11.55: the supply zone under the wick, where a retest would be a sell opportunity.11.38: the neckline and the green FVG line. This is the make-or-break level.11.30: the support of the consolidation base, a likely stop-out zone for late longs.11.17–11.20: the range floor and a green FVG.11.08–11.15: the second FVG, a deeper demand pocket.10.97: the swing low (LL), the final target if sellers gain control.
The short setup
Entry: Sell on a retest of 11.50–11.55, where the double-top wick overlaps. If price doesn’t retest, a 1H close below 11.38 is a valid breakdown entry on the retest of that level from below.
Stop-loss: 11.62, above the 11.58 high. A 1H close above it means the double top failed and bulls have control.
Targets:
TP1: 11.38. The neckline. Take partial profit and move your stop to breakeven.TP2: 11.20. The range floor and FVG.TP3: 11.00–11.08. The deeper FVG area toward the LL.
From a 11.50 entry, the reward-to-risk is about 1.1 to 1 at TP1, 2.7 to 1 at TP2 and 4 to 1 or better at TP3. The best value is in the later targets, so don’t skip TP2.
The honest caveat
This is a counter-trend idea. The break above the old lower high was a real structural shift, and the FVG at 11.38 sits right where buyers last stepped in. A short only becomes high-conviction after a 1H close below 11.38. If you’d rather not catch a top, wait for that close and take the smaller, safer entry on the retest.
If the bulls win: a 1H close above 11.62, especially on rising volume, cancels this idea and opens a push higher. Don’t fight it.
Price cross-check
I checked live sources. They disagreed widely, from about $8 to $12.45 depending on source and date, and many were stale or tracking different markets. One quote (about 12.45) was in the same neighborhood as the chart but couldn’t be matched to its timestamp. I used the chart’s own Binance perpetual price of 11.460. Before acting, check the live NMR/USDT price and adjust the levels if it has moved. All levels here are approximate readings from the chart.
⚠️ Disclaimer: This is not financial advice. This analysis is for educational purposes only. Futures and perpetual trading carry a high risk of loss, and shorts carry added risk. Always do your own research and use a stop-loss.
@Binance_Square_Official #EarningsSeason #ZcashDevelopersConfirmNovemberDateForNU7Upgrade #OCCIssuesFirstFinalRuleUnderGENIUSAct #Binance #ChartSniper
NMR/USDT Double Top Alert: Bears Circle 11.38 After a Sharp Rejection
$NMR
NMR/USDT Perpetual | 1H | Binance | Price: 11.460
You asked if this chart is bearish. It’s a conditional yes. The structure is still tilted up, since price just printed a Higher High near 11.58 above the old lower high around 11.47. But the way that high formed looks like a classic exhaustion move, and the short setup is worth planning.
Why the bears have a case
Price spiked to roughly 11.58, then printed a long upper wick and a red candle that gave back most of the move. That candle carried the biggest volume bar of the recent session, a high-volume rejection at the top of the range. The chart marks it as a double top, with that spike sitting right at the prior lower high near 11.47. The move up also stalled against a falling-volume backdrop, and the volume line is still well above the latest bars (13.41K now against a 20K average).
The marked range runs from about 11.17 to 11.58. Price is sitting in its upper half, which leaves room to drop.
Key levels
11.58: the rejection high and the invalidation line.11.50–11.55: the supply zone under the wick, where a retest would be a sell opportunity.11.38: the neckline and the green FVG line. This is the make-or-break level.11.30: the support of the consolidation base, a likely stop-out zone for late longs.11.17–11.20: the range floor and a green FVG.11.08–11.15: the second FVG, a deeper demand pocket.10.97: the swing low (LL), the final target if sellers gain control.
The short setup
Entry: Sell on a retest of 11.50–11.55, where the double-top wick overlaps. If price doesn’t retest, a 1H close below 11.38 is a valid breakdown entry on the retest of that level from below.
Stop-loss: 11.62, above the 11.58 high. A 1H close above it means the double top failed and bulls have control.
Targets:
TP1: 11.38. The neckline. Take partial profit and move your stop to breakeven.TP2: 11.20. The range floor and FVG.TP3: 11.00–11.08. The deeper FVG area toward the LL.
From a 11.50 entry, the reward-to-risk is about 1.1 to 1 at TP1, 2.7 to 1 at TP2 and 4 to 1 or better at TP3. The best value is in the later targets, so don’t skip TP2.
The honest caveat
This is a counter-trend idea. The break above the old lower high was a real structural shift, and the FVG at 11.38 sits right where buyers last stepped in. A short only becomes high-conviction after a 1H close below 11.38. If you’d rather not catch a top, wait for that close and take the smaller, safer entry on the retest.
If the bulls win: a 1H close above 11.62, especially on rising volume, cancels this idea and opens a push higher. Don’t fight it.
Price cross-check
I checked live sources. They disagreed widely, from about $8 to $12.45 depending on source and date, and many were stale or tracking different markets. One quote (about 12.45) was in the same neighborhood as the chart but couldn’t be matched to its timestamp. I used the chart’s own Binance perpetual price of 11.460. Before acting, check the live NMR/USDT price and adjust the levels if it has moved. All levels here are approximate readings from the chart.
⚠️ Disclaimer: This is not financial advice. This analysis is for educational purposes only. Futures and perpetual trading carry a high risk of loss, and shorts carry added risk. Always do your own research and use a stop-loss.
@Binance Square Official #EarningsSeason #ZcashDevelopersConfirmNovemberDateForNU7Upgrade #OCCIssuesFirstFinalRuleUnderGENIUSAct #Binance #ChartSniper
NMR/USDT Perpetual | 1H | Binance | Price: 11.460
You asked if this chart is bearish. It’s a conditional yes. The structure is still tilted up, since price just printed a Higher High near 11.58 above the old lower high around 11.47. But the way that high formed looks like a classic exhaustion move, and the short setup is worth planning.
Why the bears have a case
Price spiked to roughly 11.58, then printed a long upper wick and a red candle that gave back most of the move. That candle carried the biggest volume bar of the recent session, a high-volume rejection at the top of the range. The chart marks it as a double top, with that spike sitting right at the prior lower high near 11.47. The move up also stalled against a falling-volume backdrop, and the volume line is still well above the latest bars (13.41K now against a 20K average).
The marked range runs from about 11.17 to 11.58. Price is sitting in its upper half, which leaves room to drop.
Key levels
11.58: the rejection high and the invalidation line.11.50–11.55: the supply zone under the wick, where a retest would be a sell opportunity.11.38: the neckline and the green FVG line. This is the make-or-break level.11.30: the support of the consolidation base, a likely stop-out zone for late longs.11.17–11.20: the range floor and a green FVG.11.08–11.15: the second FVG, a deeper demand pocket.10.97: the swing low (LL), the final target if sellers gain control.
The short setup
Entry: Sell on a retest of 11.50–11.55, where the double-top wick overlaps. If price doesn’t retest, a 1H close below 11.38 is a valid breakdown entry on the retest of that level from below.
Stop-loss: 11.62, above the 11.58 high. A 1H close above it means the double top failed and bulls have control.
Targets:
TP1: 11.38. The neckline. Take partial profit and move your stop to breakeven.TP2: 11.20. The range floor and FVG.TP3: 11.00–11.08. The deeper FVG area toward the LL.
From a 11.50 entry, the reward-to-risk is about 1.1 to 1 at TP1, 2.7 to 1 at TP2 and 4 to 1 or better at TP3. The best value is in the later targets, so don’t skip TP2.
The honest caveat
This is a counter-trend idea. The break above the old lower high was a real structural shift, and the FVG at 11.38 sits right where buyers last stepped in. A short only becomes high-conviction after a 1H close below 11.38. If you’d rather not catch a top, wait for that close and take the smaller, safer entry on the retest.
If the bulls win: a 1H close above 11.62, especially on rising volume, cancels this idea and opens a push higher. Don’t fight it.
Price cross-check
I checked live sources. They disagreed widely, from about $8 to $12.45 depending on source and date, and many were stale or tracking different markets. One quote (about 12.45) was in the same neighborhood as the chart but couldn’t be matched to its timestamp. I used the chart’s own Binance perpetual price of 11.460. Before acting, check the live NMR/USDT price and adjust the levels if it has moved. All levels here are approximate readings from the chart.
⚠️ Disclaimer: This is not financial advice. This analysis is for educational purposes only. Futures and perpetual trading carry a high risk of loss, and shorts carry added risk. Always do your own research and use a stop-loss.
@Binance Square Official #EarningsSeason #ZcashDevelopersConfirmNovemberDateForNU7Upgrade #OCCIssuesFirstFinalRuleUnderGENIUSAct #Binance #ChartSniper
434
·
--
Article
See translation
SSV/USDT Flips Bullish: Is This Pullback the Entry Before a 2.65 Breakout?$SSV
{future}(SSVUSDT)
SSV/USDT | 1H | Binance | Chart timestamp: Oct 21, 2026, 17:26 UTC | Price: 2.612
SSV has done what bears didn’t want to see: it broke its downtrend structure. After a slide to a low near 2.43, the chart printed a clean sequence of higher lows, a break above the previous lower high near 2.62, and a fresh Higher High at roughly 2.648. Price is now cooling off (-0.38% on the candle) at 2.612. In a trend like this, the pullback is where the opportunity usually sits.
What the chart is saying
The structure shifted in stages. The earlier leg was a clear bearish staircase of lower highs and lower lows, ending in the sharp flush toward 2.43. From there, buyers stepped in, filled the imbalance and pushed price through the old lower high. The new HH confirms the break. A close back below the breakout zone would weaken this, but for now the trend favors the upside.
The marked range runs from about 2.503 (range low) to 2.648 (range high), and price is holding in the upper half of it. The key levels inside it:
2.648: the Higher High and the ceiling bulls must clear.2.592: the 0.618 retracement of the range, currently acting as the first line of support.2.574: the 0.5 level, which lines up with a fresh Fair Value Gap. This is the highest-quality demand pocket on the chart.2.558: the 0.382 level, the last shallow support before the deeper imbalance below.2.540–2.560: a larger Fair Value Gap from the earlier impulse. If price dips here, buyers have a second chance to defend.2.503: the range low and the line in the sand for the whole move.
The trade plan (long bias)
Pullback entry (preferred): Scale in between 2.574 and 2.592. That is where the 0.618 retracement, the 0.5 level and the FVG all overlap. Waiting for price to come to you gives a tighter stop and a better reward-to-risk than chasing at 2.612.
Stop-loss: 2.535, below the larger FVG and the 0.382 zone. A 1H close under this level means the pullback has become a reversal, and the trade is wrong.
Targets:
TP1: 2.648. A retest of the Higher High. Consider taking partial profit and moving the stop to breakeven.TP2: 2.690. The first measured extension if the HH breaks.TP3: 2.740. The extended target if momentum builds after the breakout.
Breakout entry (for momentum traders): If you’d rather not wait for a dip, look for a 1H candle close above 2.655, ideally with a retest holding that level, with a stop under 2.620. This entry is cleaner but offers less reward, so size it smaller.
What invalidates the idea
If SSV closes a 1H candle below 2.558 and then loses 2.540, the bullish structure is in trouble. That would open a move back to 2.503, and a break of that low would put the old lows near 2.485 and 2.43 back in play. In that case, step aside and let the chart rebuild.
Price cross-check
I checked live sources against the chart. Results were inconsistent: some aggregator pages showed prices anywhere from about $2 to over $40, and one TradingView market list showed around 3.24, while others were clearly stale or tracking different tokens that share the SSV ticker. None of these could be matched to the chart’s timestamp. I used the chart’s own timestamped Binance price of 2.612 as the reference, and every level above is read from that chart. Before entering, check the live SSV/USDT price on Binance and adjust the levels if it has moved.
Final take
Structure has turned bullish, momentum is rising into the 2.648 high, and the cleanest risk-reward comes from a pullback into the 2.574–2.592 pocket rather than a chase. Patience and a defined stop are what make this setup work.
⚠️ Disclaimer: This is not financial advice. This analysis is for educational purposes only. Crypto trading carries a high risk of loss, and levels here are approximate readings from a chart. Always do your own research and manage your risk.
@Binance_Square_Official #EarningsSeason #ZcashDevelopersConfirmNovemberDateForNU7Upgrade #OCCIssuesFirstFinalRuleUnderGENIUSAct #Binance #ChartSniper
SSV/USDT Flips Bullish: Is This Pullback the Entry Before a 2.65 Breakout?
$SSV
SSV/USDT | 1H | Binance | Chart timestamp: Oct 21, 2026, 17:26 UTC | Price: 2.612
SSV has done what bears didn’t want to see: it broke its downtrend structure. After a slide to a low near 2.43, the chart printed a clean sequence of higher lows, a break above the previous lower high near 2.62, and a fresh Higher High at roughly 2.648. Price is now cooling off (-0.38% on the candle) at 2.612. In a trend like this, the pullback is where the opportunity usually sits.
What the chart is saying
The structure shifted in stages. The earlier leg was a clear bearish staircase of lower highs and lower lows, ending in the sharp flush toward 2.43. From there, buyers stepped in, filled the imbalance and pushed price through the old lower high. The new HH confirms the break. A close back below the breakout zone would weaken this, but for now the trend favors the upside.
The marked range runs from about 2.503 (range low) to 2.648 (range high), and price is holding in the upper half of it. The key levels inside it:
2.648: the Higher High and the ceiling bulls must clear.2.592: the 0.618 retracement of the range, currently acting as the first line of support.2.574: the 0.5 level, which lines up with a fresh Fair Value Gap. This is the highest-quality demand pocket on the chart.2.558: the 0.382 level, the last shallow support before the deeper imbalance below.2.540–2.560: a larger Fair Value Gap from the earlier impulse. If price dips here, buyers have a second chance to defend.2.503: the range low and the line in the sand for the whole move.
The trade plan (long bias)
Pullback entry (preferred): Scale in between 2.574 and 2.592. That is where the 0.618 retracement, the 0.5 level and the FVG all overlap. Waiting for price to come to you gives a tighter stop and a better reward-to-risk than chasing at 2.612.
Stop-loss: 2.535, below the larger FVG and the 0.382 zone. A 1H close under this level means the pullback has become a reversal, and the trade is wrong.
Targets:
TP1: 2.648. A retest of the Higher High. Consider taking partial profit and moving the stop to breakeven.TP2: 2.690. The first measured extension if the HH breaks.TP3: 2.740. The extended target if momentum builds after the breakout.
Breakout entry (for momentum traders): If you’d rather not wait for a dip, look for a 1H candle close above 2.655, ideally with a retest holding that level, with a stop under 2.620. This entry is cleaner but offers less reward, so size it smaller.
What invalidates the idea
If SSV closes a 1H candle below 2.558 and then loses 2.540, the bullish structure is in trouble. That would open a move back to 2.503, and a break of that low would put the old lows near 2.485 and 2.43 back in play. In that case, step aside and let the chart rebuild.
Price cross-check
I checked live sources against the chart. Results were inconsistent: some aggregator pages showed prices anywhere from about $2 to over $40, and one TradingView market list showed around 3.24, while others were clearly stale or tracking different tokens that share the SSV ticker. None of these could be matched to the chart’s timestamp. I used the chart’s own timestamped Binance price of 2.612 as the reference, and every level above is read from that chart. Before entering, check the live SSV/USDT price on Binance and adjust the levels if it has moved.
Final take
Structure has turned bullish, momentum is rising into the 2.648 high, and the cleanest risk-reward comes from a pullback into the 2.574–2.592 pocket rather than a chase. Patience and a defined stop are what make this setup work.
⚠️ Disclaimer: This is not financial advice. This analysis is for educational purposes only. Crypto trading carries a high risk of loss, and levels here are approximate readings from a chart. Always do your own research and manage your risk.
@Binance Square Official #EarningsSeason #ZcashDevelopersConfirmNovemberDateForNU7Upgrade #OCCIssuesFirstFinalRuleUnderGENIUSAct #Binance #ChartSniper
SSV/USDT | 1H | Binance | Chart timestamp: Oct 21, 2026, 17:26 UTC | Price: 2.612
SSV has done what bears didn’t want to see: it broke its downtrend structure. After a slide to a low near 2.43, the chart printed a clean sequence of higher lows, a break above the previous lower high near 2.62, and a fresh Higher High at roughly 2.648. Price is now cooling off (-0.38% on the candle) at 2.612. In a trend like this, the pullback is where the opportunity usually sits.
What the chart is saying
The structure shifted in stages. The earlier leg was a clear bearish staircase of lower highs and lower lows, ending in the sharp flush toward 2.43. From there, buyers stepped in, filled the imbalance and pushed price through the old lower high. The new HH confirms the break. A close back below the breakout zone would weaken this, but for now the trend favors the upside.
The marked range runs from about 2.503 (range low) to 2.648 (range high), and price is holding in the upper half of it. The key levels inside it:
2.648: the Higher High and the ceiling bulls must clear.2.592: the 0.618 retracement of the range, currently acting as the first line of support.2.574: the 0.5 level, which lines up with a fresh Fair Value Gap. This is the highest-quality demand pocket on the chart.2.558: the 0.382 level, the last shallow support before the deeper imbalance below.2.540–2.560: a larger Fair Value Gap from the earlier impulse. If price dips here, buyers have a second chance to defend.2.503: the range low and the line in the sand for the whole move.
The trade plan (long bias)
Pullback entry (preferred): Scale in between 2.574 and 2.592. That is where the 0.618 retracement, the 0.5 level and the FVG all overlap. Waiting for price to come to you gives a tighter stop and a better reward-to-risk than chasing at 2.612.
Stop-loss: 2.535, below the larger FVG and the 0.382 zone. A 1H close under this level means the pullback has become a reversal, and the trade is wrong.
Targets:
TP1: 2.648. A retest of the Higher High. Consider taking partial profit and moving the stop to breakeven.TP2: 2.690. The first measured extension if the HH breaks.TP3: 2.740. The extended target if momentum builds after the breakout.
Breakout entry (for momentum traders): If you’d rather not wait for a dip, look for a 1H candle close above 2.655, ideally with a retest holding that level, with a stop under 2.620. This entry is cleaner but offers less reward, so size it smaller.
What invalidates the idea
If SSV closes a 1H candle below 2.558 and then loses 2.540, the bullish structure is in trouble. That would open a move back to 2.503, and a break of that low would put the old lows near 2.485 and 2.43 back in play. In that case, step aside and let the chart rebuild.
Price cross-check
I checked live sources against the chart. Results were inconsistent: some aggregator pages showed prices anywhere from about $2 to over $40, and one TradingView market list showed around 3.24, while others were clearly stale or tracking different tokens that share the SSV ticker. None of these could be matched to the chart’s timestamp. I used the chart’s own timestamped Binance price of 2.612 as the reference, and every level above is read from that chart. Before entering, check the live SSV/USDT price on Binance and adjust the levels if it has moved.
Final take
Structure has turned bullish, momentum is rising into the 2.648 high, and the cleanest risk-reward comes from a pullback into the 2.574–2.592 pocket rather than a chase. Patience and a defined stop are what make this setup work.
⚠️ Disclaimer: This is not financial advice. This analysis is for educational purposes only. Crypto trading carries a high risk of loss, and levels here are approximate readings from a chart. Always do your own research and manage your risk.
@Binance Square Official #EarningsSeason #ZcashDevelopersConfirmNovemberDateForNU7Upgrade #OCCIssuesFirstFinalRuleUnderGENIUSAct #Binance #ChartSniper
290
·
--
Article
See translation
ONG/USDT: Staircase Rally Breaks Fresh Highs — Long Setup Into the FVG Ladder$ONG
{future}(ONGUSDT)
Pair: ONG/USDT Perpetual (Ontology Gas) | Timeframe: 1H | Exchange: Binance | Chart date: Oct 18–21, 2026 (UTC)
Market Overview
ONG/USDT is trading around 0.08135, consolidating just under a fresh higher high (HH) near 0.0822. Price has been climbing in a structured staircase pattern since bouncing off a lower low (LL) near 0.0712, clearing a lower high (LH) around 0.0770, pulling back into a second LL base near 0.0745, and then breaking decisively higher through a stack of Fair Value Gaps (FVGs) into the new HH. The broader ascending trendline from the first LL remains fully intact, reinforcing the bullish structure through the entire move.
Price has pulled back slightly from the HH spike and is now consolidating right above the most recent FVG shelf, with layered support stacked directly beneath.
Key Observations From the Chart
1. Clean staircase breakout. Each leg higher — from the first LL through the LH break, the second LL base, and into the HH — has left behind an FVG, a hallmark of sustained, structured buying rather than a single speculative spike.
2. Resistance at 0.0822. This is the HH and the recent spike high. A confirmed close above this level would open room toward 0.0850–0.0860.
3. Immediate support at 0.0800–0.0810. This is the horizontal shelf just below current price, reinforced by the FVGs left behind by the most recent breakout candle.
4. Deeper FVG support at 0.0775–0.0795. A second layer of Fair Value Gaps sits just beneath, overlapping with the former LH resistance zone (now acting as support) near 0.0780.
5. The LL bases at 0.0745 and 0.0712 mark the structural floor. As long as price holds well above these levels, the broader bullish staircase structure remains intact.
Trade Scenarios (Long Bias)
Scenario A: Buy the FVG Support Zone (Preferred)
Buy a reaction from the stacked FVG support directly beneath current price, in line with the staircase breakout.
Entry zone: 0.0805 to 0.0780Stop-loss: 0.0760 (below the second LL base and FVG cluster)Take-profit 1: 0.0815Take-profit 2: 0.0822 (the HH)Take-profit 3: 0.0860
Scale into the zone across a couple of entries, and move your stop to breakeven once TP1 is tagged.
Scenario B: Breakout Long
If price clears the recent high without a deep pullback, wait for a confirmed close rather than chasing the wick.
Trigger: A 1H candle close above 0.0828Entry: On the close, or on a retest of 0.0822 as new supportStop-loss: 0.0795Take-profit 1: 0.0870Take-profit 2: 0.0910
Scenario C: Bearish Invalidation
If price breaks through the full FVG staircase and the LL bases, the recent breakout likely fails.
Trigger: 1H close below 0.0740Short entry: On a retest of 0.0740–0.0750 from belowStop-loss: 0.0790Take-profit 1: 0.0710Take-profit 2: 0.0680
Risk Management Tips
Risk only 1% to 2% of your account per trade.ONG has shown a sharp volume spike around its breakout candle — keep leverage conservative (3x to 5x at most).Avoid chasing green candles into resistance; let price come back to your planned entry zone.Always set your stop-loss the moment you open a position.Watch Bitcoin and overall market sentiment — a fresh altcoin breakout can stall quickly if the broader market turns risk-off.
Conclusion
ONG/USDT remains in a well-structured staircase breakout, with layered Fair Value Gaps acting as a support ladder beneath the recent high near 0.0822. A pullback into the 0.0780–0.0805 confluence zone followed by renewed strength keeps the bullish case alive toward 0.0822 and beyond, while a break below the 0.0740 base would be the clearest signal the rally has stalled. Let the chart confirm before committing size.
Disclaimer: This article is for educational and informational purposes only and is not financial advice. Cryptocurrency and derivatives trading carry a high risk of loss, and you can lose more than you expect, especially with leverage. Entry, stop-loss and target levels are based on chart analysis and are not guaranteed. Always do your own research and only trade with money you can afford to lose.
@Binance_Square_Official #EarningsSeason #ZcashDevelopersConfirmNovemberDateForNU7Upgrade #OCCIssuesFirstFinalRuleUnderGENIUSAct #Binance #ChartSniper
ONG/USDT: Staircase Rally Breaks Fresh Highs — Long Setup Into the FVG Ladder
$ONG
Pair: ONG/USDT Perpetual (Ontology Gas) | Timeframe: 1H | Exchange: Binance | Chart date: Oct 18–21, 2026 (UTC)
Market Overview
ONG/USDT is trading around 0.08135, consolidating just under a fresh higher high (HH) near 0.0822. Price has been climbing in a structured staircase pattern since bouncing off a lower low (LL) near 0.0712, clearing a lower high (LH) around 0.0770, pulling back into a second LL base near 0.0745, and then breaking decisively higher through a stack of Fair Value Gaps (FVGs) into the new HH. The broader ascending trendline from the first LL remains fully intact, reinforcing the bullish structure through the entire move.
Price has pulled back slightly from the HH spike and is now consolidating right above the most recent FVG shelf, with layered support stacked directly beneath.
Key Observations From the Chart
1. Clean staircase breakout. Each leg higher — from the first LL through the LH break, the second LL base, and into the HH — has left behind an FVG, a hallmark of sustained, structured buying rather than a single speculative spike.
2. Resistance at 0.0822. This is the HH and the recent spike high. A confirmed close above this level would open room toward 0.0850–0.0860.
3. Immediate support at 0.0800–0.0810. This is the horizontal shelf just below current price, reinforced by the FVGs left behind by the most recent breakout candle.
4. Deeper FVG support at 0.0775–0.0795. A second layer of Fair Value Gaps sits just beneath, overlapping with the former LH resistance zone (now acting as support) near 0.0780.
5. The LL bases at 0.0745 and 0.0712 mark the structural floor. As long as price holds well above these levels, the broader bullish staircase structure remains intact.
Trade Scenarios (Long Bias)
Scenario A: Buy the FVG Support Zone (Preferred)
Buy a reaction from the stacked FVG support directly beneath current price, in line with the staircase breakout.
Entry zone: 0.0805 to 0.0780Stop-loss: 0.0760 (below the second LL base and FVG cluster)Take-profit 1: 0.0815Take-profit 2: 0.0822 (the HH)Take-profit 3: 0.0860
Scale into the zone across a couple of entries, and move your stop to breakeven once TP1 is tagged.
Scenario B: Breakout Long
If price clears the recent high without a deep pullback, wait for a confirmed close rather than chasing the wick.
Trigger: A 1H candle close above 0.0828Entry: On the close, or on a retest of 0.0822 as new supportStop-loss: 0.0795Take-profit 1: 0.0870Take-profit 2: 0.0910
Scenario C: Bearish Invalidation
If price breaks through the full FVG staircase and the LL bases, the recent breakout likely fails.
Trigger: 1H close below 0.0740Short entry: On a retest of 0.0740–0.0750 from belowStop-loss: 0.0790Take-profit 1: 0.0710Take-profit 2: 0.0680
Risk Management Tips
Risk only 1% to 2% of your account per trade.ONG has shown a sharp volume spike around its breakout candle — keep leverage conservative (3x to 5x at most).Avoid chasing green candles into resistance; let price come back to your planned entry zone.Always set your stop-loss the moment you open a position.Watch Bitcoin and overall market sentiment — a fresh altcoin breakout can stall quickly if the broader market turns risk-off.
Conclusion
ONG/USDT remains in a well-structured staircase breakout, with layered Fair Value Gaps acting as a support ladder beneath the recent high near 0.0822. A pullback into the 0.0780–0.0805 confluence zone followed by renewed strength keeps the bullish case alive toward 0.0822 and beyond, while a break below the 0.0740 base would be the clearest signal the rally has stalled. Let the chart confirm before committing size.
Disclaimer: This article is for educational and informational purposes only and is not financial advice. Cryptocurrency and derivatives trading carry a high risk of loss, and you can lose more than you expect, especially with leverage. Entry, stop-loss and target levels are based on chart analysis and are not guaranteed. Always do your own research and only trade with money you can afford to lose.
@Binance Square Official #EarningsSeason #ZcashDevelopersConfirmNovemberDateForNU7Upgrade #OCCIssuesFirstFinalRuleUnderGENIUSAct #Binance #ChartSniper
Pair: ONG/USDT Perpetual (Ontology Gas) | Timeframe: 1H | Exchange: Binance | Chart date: Oct 18–21, 2026 (UTC)
Market Overview
ONG/USDT is trading around 0.08135, consolidating just under a fresh higher high (HH) near 0.0822. Price has been climbing in a structured staircase pattern since bouncing off a lower low (LL) near 0.0712, clearing a lower high (LH) around 0.0770, pulling back into a second LL base near 0.0745, and then breaking decisively higher through a stack of Fair Value Gaps (FVGs) into the new HH. The broader ascending trendline from the first LL remains fully intact, reinforcing the bullish structure through the entire move.
Price has pulled back slightly from the HH spike and is now consolidating right above the most recent FVG shelf, with layered support stacked directly beneath.
Key Observations From the Chart
1. Clean staircase breakout. Each leg higher — from the first LL through the LH break, the second LL base, and into the HH — has left behind an FVG, a hallmark of sustained, structured buying rather than a single speculative spike.
2. Resistance at 0.0822. This is the HH and the recent spike high. A confirmed close above this level would open room toward 0.0850–0.0860.
3. Immediate support at 0.0800–0.0810. This is the horizontal shelf just below current price, reinforced by the FVGs left behind by the most recent breakout candle.
4. Deeper FVG support at 0.0775–0.0795. A second layer of Fair Value Gaps sits just beneath, overlapping with the former LH resistance zone (now acting as support) near 0.0780.
5. The LL bases at 0.0745 and 0.0712 mark the structural floor. As long as price holds well above these levels, the broader bullish staircase structure remains intact.
Trade Scenarios (Long Bias)
Scenario A: Buy the FVG Support Zone (Preferred)
Buy a reaction from the stacked FVG support directly beneath current price, in line with the staircase breakout.
Entry zone: 0.0805 to 0.0780Stop-loss: 0.0760 (below the second LL base and FVG cluster)Take-profit 1: 0.0815Take-profit 2: 0.0822 (the HH)Take-profit 3: 0.0860
Scale into the zone across a couple of entries, and move your stop to breakeven once TP1 is tagged.
Scenario B: Breakout Long
If price clears the recent high without a deep pullback, wait for a confirmed close rather than chasing the wick.
Trigger: A 1H candle close above 0.0828Entry: On the close, or on a retest of 0.0822 as new supportStop-loss: 0.0795Take-profit 1: 0.0870Take-profit 2: 0.0910
Scenario C: Bearish Invalidation
If price breaks through the full FVG staircase and the LL bases, the recent breakout likely fails.
Trigger: 1H close below 0.0740Short entry: On a retest of 0.0740–0.0750 from belowStop-loss: 0.0790Take-profit 1: 0.0710Take-profit 2: 0.0680
Risk Management Tips
Risk only 1% to 2% of your account per trade.ONG has shown a sharp volume spike around its breakout candle — keep leverage conservative (3x to 5x at most).Avoid chasing green candles into resistance; let price come back to your planned entry zone.Always set your stop-loss the moment you open a position.Watch Bitcoin and overall market sentiment — a fresh altcoin breakout can stall quickly if the broader market turns risk-off.
Conclusion
ONG/USDT remains in a well-structured staircase breakout, with layered Fair Value Gaps acting as a support ladder beneath the recent high near 0.0822. A pullback into the 0.0780–0.0805 confluence zone followed by renewed strength keeps the bullish case alive toward 0.0822 and beyond, while a break below the 0.0740 base would be the clearest signal the rally has stalled. Let the chart confirm before committing size.
Disclaimer: This article is for educational and informational purposes only and is not financial advice. Cryptocurrency and derivatives trading carry a high risk of loss, and you can lose more than you expect, especially with leverage. Entry, stop-loss and target levels are based on chart analysis and are not guaranteed. Always do your own research and only trade with money you can afford to lose.
@Binance Square Official #EarningsSeason #ZcashDevelopersConfirmNovemberDateForNU7Upgrade #OCCIssuesFirstFinalRuleUnderGENIUSAct #Binance #ChartSniper
311
Log in to explore more content
Join global crypto users on Binance Square
⚡️ Get latest and useful information about crypto.
💬 Trusted by the world’s largest crypto exchange.
👍 Discover real insights from verified creators.
Email / Phone number
Trending Topics
1
#NvidiaInvestigatesAfterHuang’sAffairApology
28,642 views
394 Discussing
2
#BitcoinFiveWeeklyLosses
44,084 views
828 Discussing
3
#AIChipSlumpNasdaq
25,446 views
481 Discussing
4
#SouthKoreaSupremeCourtClarifiesVirtualAssetSeizureRules
201 views
10 Discussing
5
#EthereumSpotETFsPost$365MWeeklyOutflow
1,211 views
34 Discussing
6
#TradFiForBeginners
266,004 views
2,388 Discussing
7
#GalxeToIntegrateIntoGravityGraduallyCloseQuest
245 views
42 Discussing
8
#KeplrAdvisesSocialLoginUsersToTransferAssets
92,236 views
693 Discussing
9
#TetherPlans€28.8MForJuventusCapitalIncrease
61,418 views
505 Discussing
10
#JobsReportRaisesHikeOdds
1M views
4,707 Discussing