

#ain
ain
1.1M views
6,185 Discussing
Hot
Latest

·
--
See translation
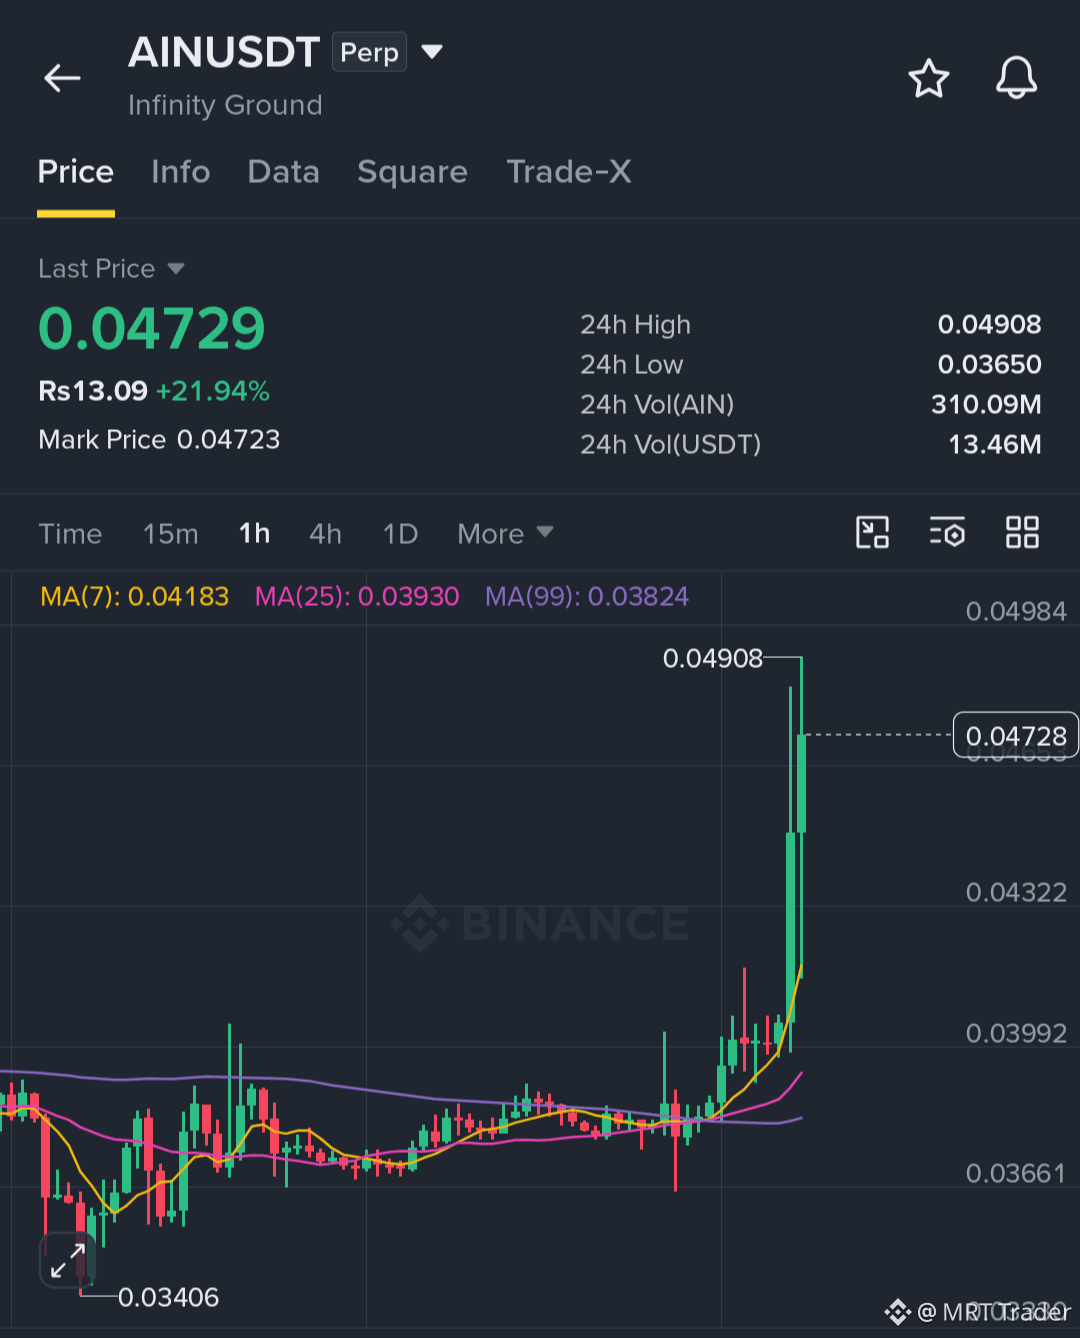
$AIN is showing bullish momentum, with buyers pushing for higher levels 🚀
AIN is trading around 0.04788, up more than 23% in 24 hours. Price is showing a strong bounce after a prolonged decline, and buyers are trying to build momentum.
Key Levels:
🔴 Resistance: 0.0490 – 0.0500
🟢 Bullish above: 0.0500
Trade Setup (Long):
🟢 Entry Zone: 0.0468 – 0.0478
🎯 Targets: 0.0512 / 0.0552 / 0.0602
⛔ Stop Loss: 0.0443
If buying pressure continues and price holds above the entry zone, AIN could target 0.0510, then 0.0550 and possibly 0.0600. Wait for a confirmed breakout with strong volume before entering. After a sharp move, pullbacks can be significant, so these targets are illustrative, not guaranteed. Manage your risk carefully.
Click here to buy now 👉 $AIN
{future}(AINUSDT)
#AIN #ArgentineCourtDismissesLIBRACaseAgainstMilei
$AIN is showing bullish momentum, with buyers pushing for higher levels 🚀
AIN is trading around 0.04788, up more than 23% in 24 hours. Price is showing a strong bounce after a prolonged decline, and buyers are trying to build momentum.
Key Levels:
🔴 Resistance: 0.0490 – 0.0500
🟢 Bullish above: 0.0500
Trade Setup (Long):
🟢 Entry Zone: 0.0468 – 0.0478
🎯 Targets: 0.0512 / 0.0552 / 0.0602
⛔ Stop Loss: 0.0443
If buying pressure continues and price holds above the entry zone, AIN could target 0.0510, then 0.0550 and possibly 0.0600. Wait for a confirmed breakout with strong volume before entering. After a sharp move, pullbacks can be significant, so these targets are illustrative, not guaranteed. Manage your risk carefully.
Click here to buy now 👉 $AIN
#AIN #ArgentineCourtDismissesLIBRACaseAgainstMilei
1

·
--
Bullish
See translation
ALTCOIN BREAKOUT WATCH
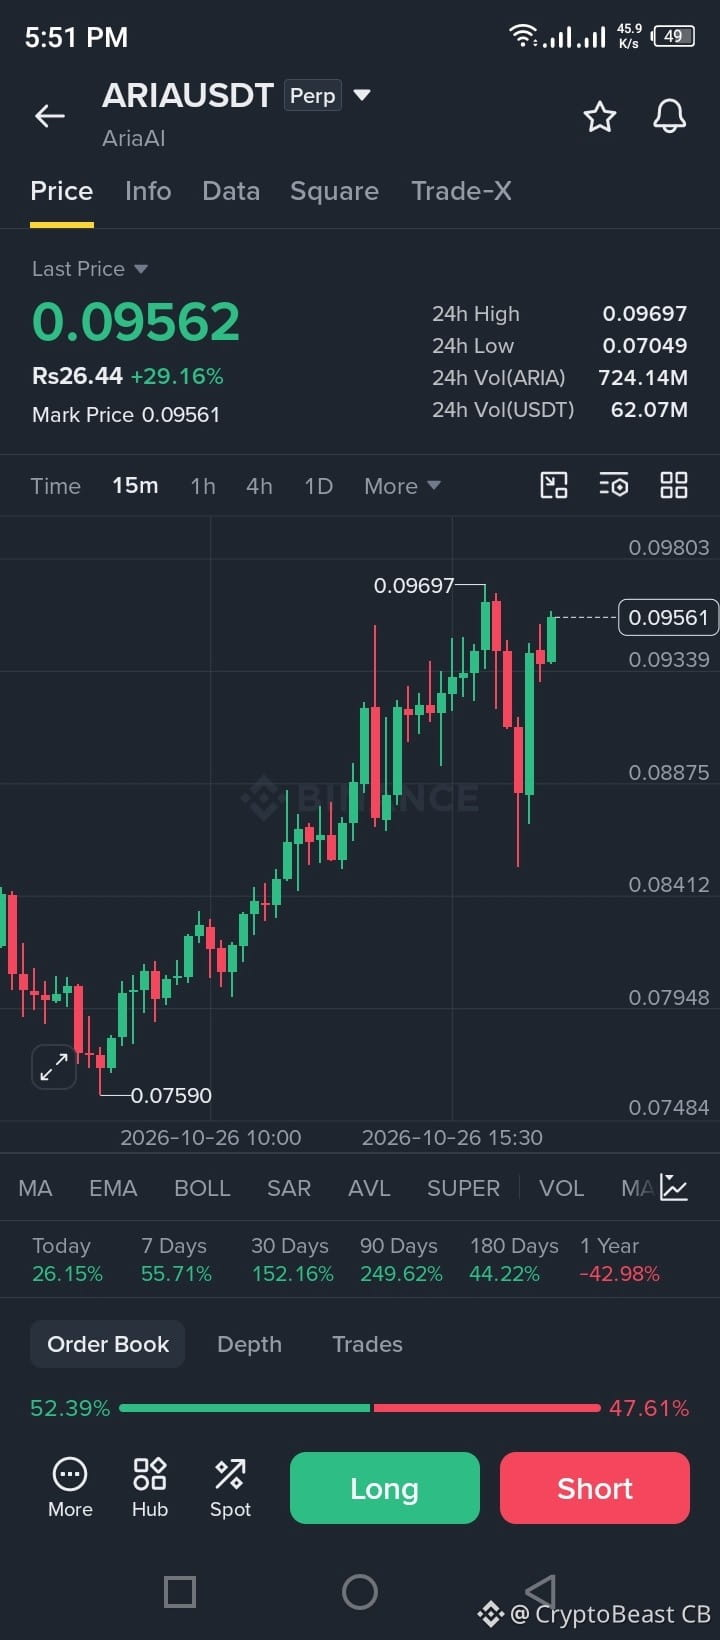
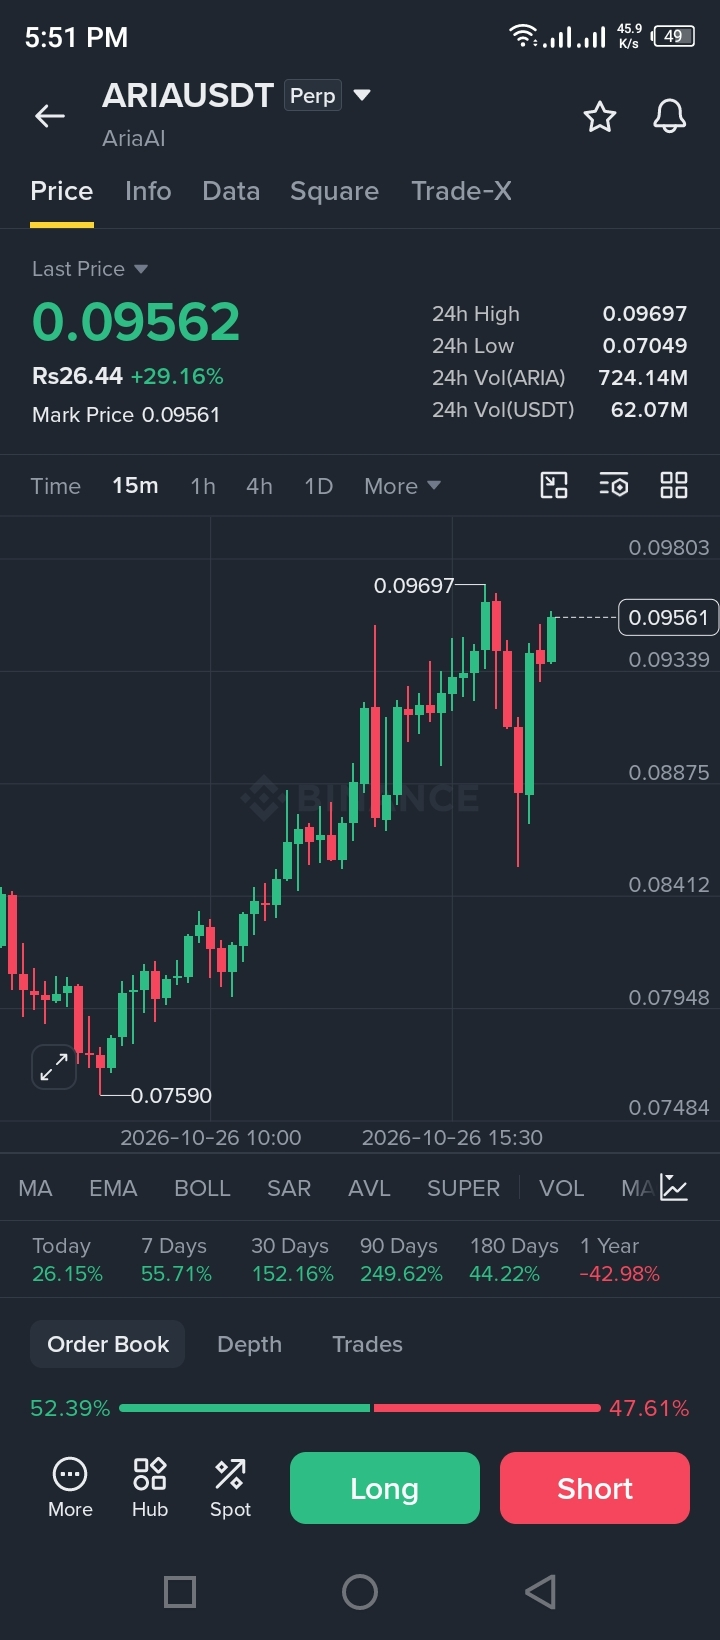
$ARIA Price: $0.09562
Targets: $0.100 → $0.105 → $0.112
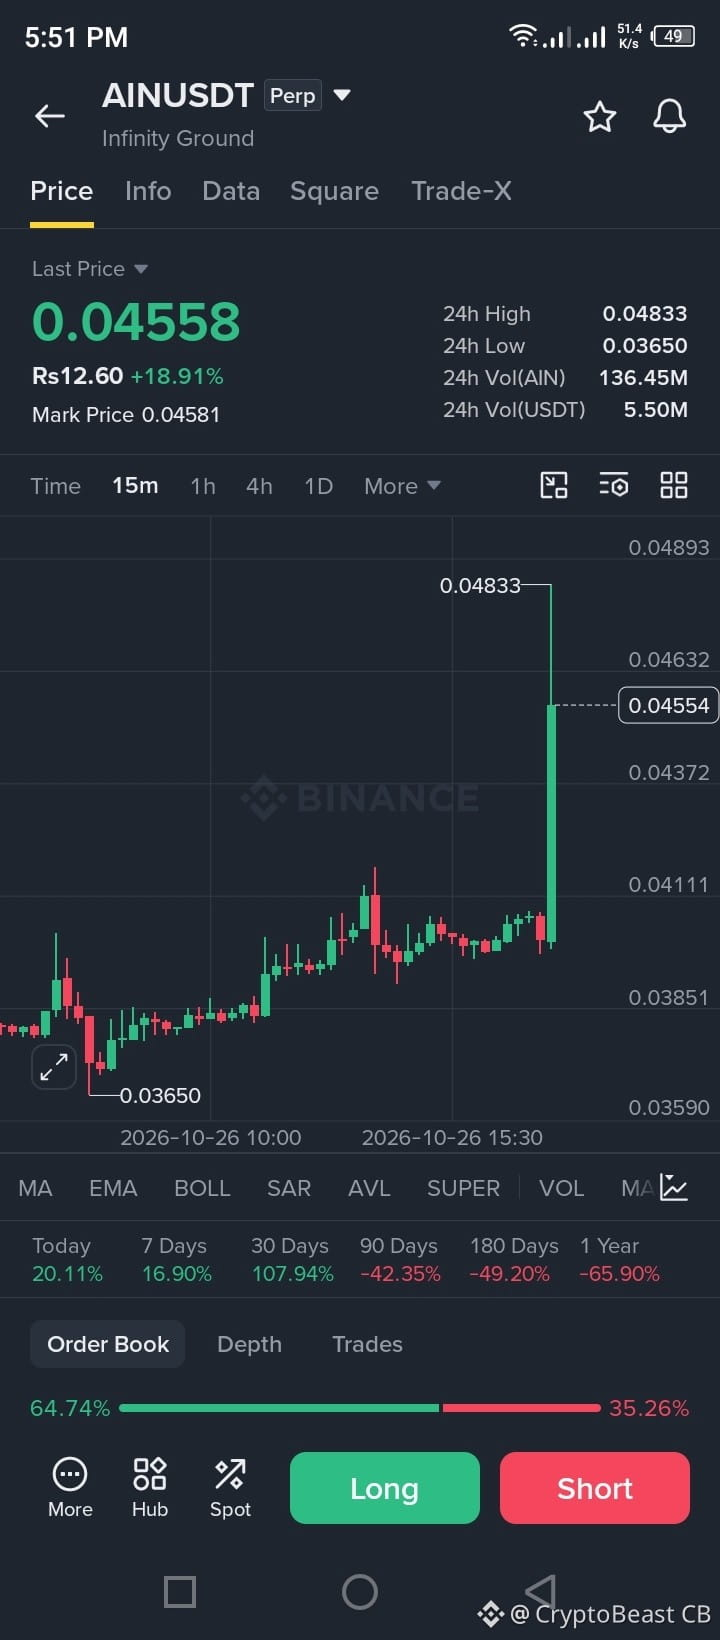
$AIN Price: $0.04558
Targets: $0.0483 → $0.051 → $0.055
Both are showing strong upward moves. Watch resistance and avoid chasing sudden pumps.
#ARIA #AIN #Crypto #BinanceSquare
ALTCOIN BREAKOUT WATCH
$ARIA Price: $0.09562
Targets: $0.100 → $0.105 → $0.112
$AIN Price: $0.04558
Targets: $0.0483 → $0.051 → $0.055
Both are showing strong upward moves. Watch resistance and avoid chasing sudden pumps.
#ARIA #AIN #Crypto #BinanceSquare
$ARIA Price: $0.09562
Targets: $0.100 → $0.105 → $0.112
$AIN Price: $0.04558
Targets: $0.0483 → $0.051 → $0.055
Both are showing strong upward moves. Watch resistance and avoid chasing sudden pumps.
#ARIA #AIN #Crypto #BinanceSquare
1
1
6
·
--
Bullish
See translation
$ARIA & $AIN NEXT TARGETS
$ARIA : $0.0956 → $0.100 → $0.105 → $0.110
AIN : $0.0455 → $0.0483 → $0.0520 → $0.0550
Both charts show bullish moves. A confirmed breakout could open the next target zone. Avoid chasing extended candles.
#ARIA #AIN #Altcoins #BinanceSquare
$ARIA & $AIN NEXT TARGETS
$ARIA : $0.0956 → $0.100 → $0.105 → $0.110
AIN : $0.0455 → $0.0483 → $0.0520 → $0.0550
Both charts show bullish moves. A confirmed breakout could open the next target zone. Avoid chasing extended candles.
#ARIA #AIN #Altcoins #BinanceSquare
$ARIA : $0.0956 → $0.100 → $0.105 → $0.110
AIN : $0.0455 → $0.0483 → $0.0520 → $0.0550
Both charts show bullish moves. A confirmed breakout could open the next target zone. Avoid chasing extended candles.
#ARIA #AIN #Altcoins #BinanceSquare
CryptoBeast CB
·
--
BullishALTCOIN BREAKOUT WATCH
$ARIA Price: $0.09562
Targets: $0.100 → $0.105 → $0.112
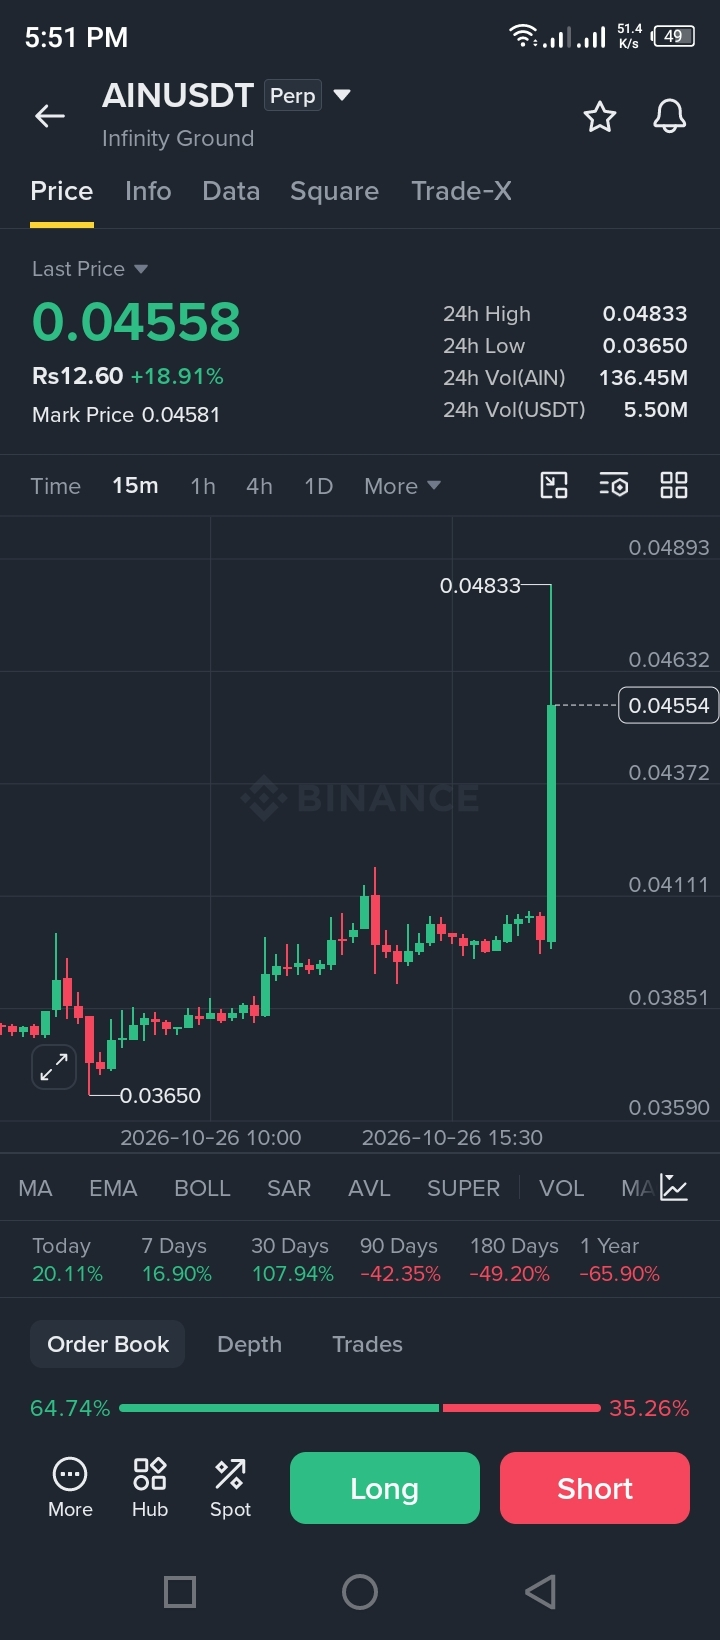
$AIN Price: $0.04558
Targets: $0.0483 → $0.051 → $0.055
Both are showing strong upward moves. Watch resistance and avoid chasing sudden pumps.
#ARIA #AIN #Crypto #BinanceSquare
$ARIA Price: $0.09562
Targets: $0.100 → $0.105 → $0.112
$AIN Price: $0.04558
Targets: $0.0483 → $0.051 → $0.055
Both are showing strong upward moves. Watch resistance and avoid chasing sudden pumps.
#ARIA #AIN #Crypto #BinanceSquare
1
319

·
--
See translation
$AIN +6.43% | $GRASS +6.24% | $ARIA +6.10%
#AIN on BSC nudged to $0.0381, up +6.43% on $102.7K volume. The $16.4 M market cap keeps it a small‑cap Alpha, so swings can be sharp.
GRASS on Solana rose to $0.6787, gaining +6.24% with $485.6K traded. At $165.5 M market cap it’s larger than the others, yet still an on‑chain Alpha with noticeable volatility.
ARIA on BSC moved to $0.0689, up +6.10% on a solid $3.8 M volume. Its $32.0 M market cap suggests moderate depth, but rapid moves are still possible.
⚠️ The thin liquidity on these low‑cap Alphas means today’s gains could unwind quickly—watch the order book for early signs.
#BinanceAlpha #TopGainers #Write2Earn #Binance
12

·
--
AIN futures market: At the close of the 5-minute candle at 2026-10-26 20:50 Beijing time, price was up 12.83%. At 2026-10-26 20:50:01 Beijing time, the spot price was 0.0451, 24h trading volume was 4.6574 million, price was above VWAP at 0.040795, and RSI was 88.6. The short-term divergence is what’s most worth watching. Specifically, is this the start of a move, or just a single probe?
Can price hold VWAP at 0.040795 on a pullback? Would you look for support on the pullback first, or wait for volume confirmation?
Note: 24h trading volume is below $5 million, and the order book is thin. Watch out for slippage.
#AIN #UnusualMoveAlert
Can price hold VWAP at 0.040795 on a pullback? Would you look for support on the pullback first, or wait for volume confirmation?
Note: 24h trading volume is below $5 million, and the order book is thin. Watch out for slippage.
#AIN #UnusualMoveAlert
8

·
--
$AIN A sharp drop on the 5-minute timeframe, down 8.33%, with the current price at 0.0449.
Support lies around the 24-hour low of 0.0365. A break below that would open up further downside; if a rebound fails to reclaim the point where the decline began, the bearish structure will remain intact.
What do you think of this stage?
#AIN
Support lies around the 24-hour low of 0.0365. A break below that would open up further downside; if a rebound fails to reclaim the point where the decline began, the bearish structure will remain intact.
What do you think of this stage?
#AIN
1

·
--
🚨 AIN is up 4.6% over 24H, but surged 7.1% in just 5 minutes, with volume expanding to 15.7×—volatility has really woken up!
But what’s truly strange is this: it’s up only 5.0% over 1H, there are only 3/0 KOLs on X, BSQ is 14, and the directional signal still hasn’t picked a side. Historically, about 89% of these WAKE signals are followed by a move of ≥3% within 4H, but directional accuracy is only about 44%.
📊 What does this mean? The biggest risk isn’t a lack of volatility—it’s jumping in just before the market turns against you. Calling the volatility right doesn’t mean you’ll make money on the direction.
🎯 Key thing to watch: the next 1H candle. A confirmed move higher on increased volume would be a reason to keep following; a failed rally that turns weaker means watching out for a false breakout and longs getting trapped.
My take: AIN has entered a high-volatility window, but for now, it’s best to wait for confirmation—not blindly bet on one direction. Until the data is verified, put sitting on the sidelines ahead of chasing the rally.
Do you think AIN will break upward over the next 1H, or pull back sharply in the opposite direction? 👇 #AIN #CryptoTrading
6

$AIN LONG
🔹Entry zone: 0.03629$
💰Target 1: 0.03783305$
💰Target 2: 0.0392077$
💰Target 3: 0.04070742$
💰Target 4: 0.04487877$
💰Target 5: 0.05140742$
🛡Stop-loss: 0.03591478$
📈 RSI14: m1 17.7 • m5 20.8 • m15 24.2 • m30 30.7
📊 VOL: m1 $36.6K • m5 $38.6K • m15 $408.3K • m30 $453.3K
🧲 OI: now $9.6M • 5m -0.6% • 15m -0.5% • 30m -0.3%
This set of reference levels comes with additional context: RSI values vary across timeframes; VOL is higher when comparing the longer interval with the shorter one; every listed change in OI is negative. The idea is a possible upward move.
⚠️ This is not financial advice. Trade at your own risk. DYOR.
#AIN #XRP #BinanceFutures 📈
$AIN
39

·
--
$AIN / $CVX / $BIRB — Bullish on the 30-minute timeframe; short-term confluence opportunity 🔥
════════════════════
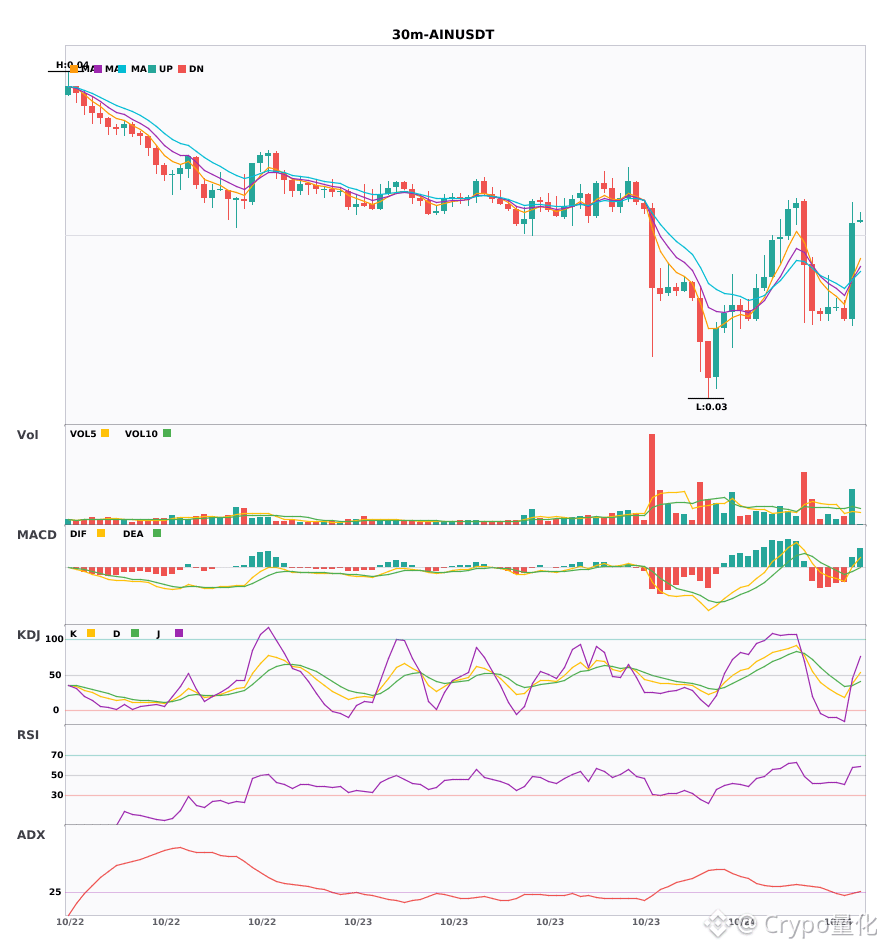
🔴 $AIN — 30-minute bullish signal
⚠️Technical analysis: ADX (25): trend is forming; potential opportunity | MACD golden cross above zero; bullish momentum is building | EMA5 crosses above EMA8; short-term trend turns bullish | KDJ golden cross; short-term outlook is bullish (K: 38.7, D: 35.6) | Volume increased (1.9x)
════════════════════
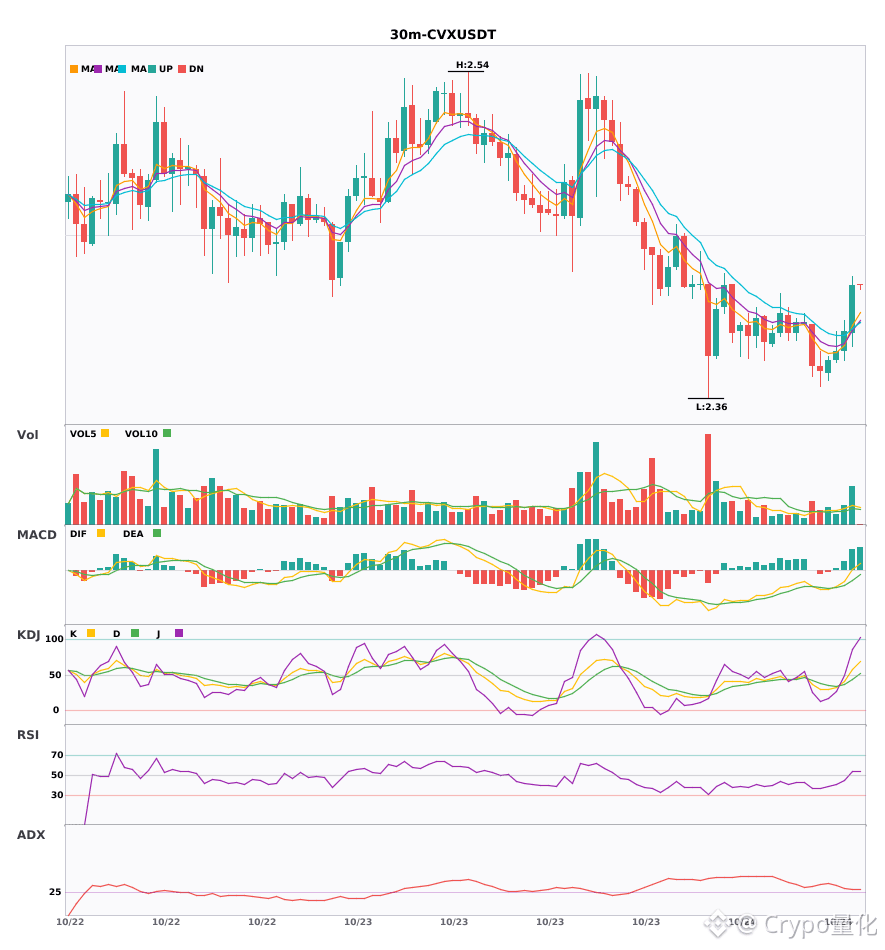
🔴 $CVX — 30-minute bullish signal
⚠️Technical analysis: ADX (27): trend is forming; potential opportunity | MACD DIF breaks above the zero line; trend turns bullish | EMA5 crosses above EMA8; short-term trend turns bullish | Volume increased (2.4x)
════════════════════
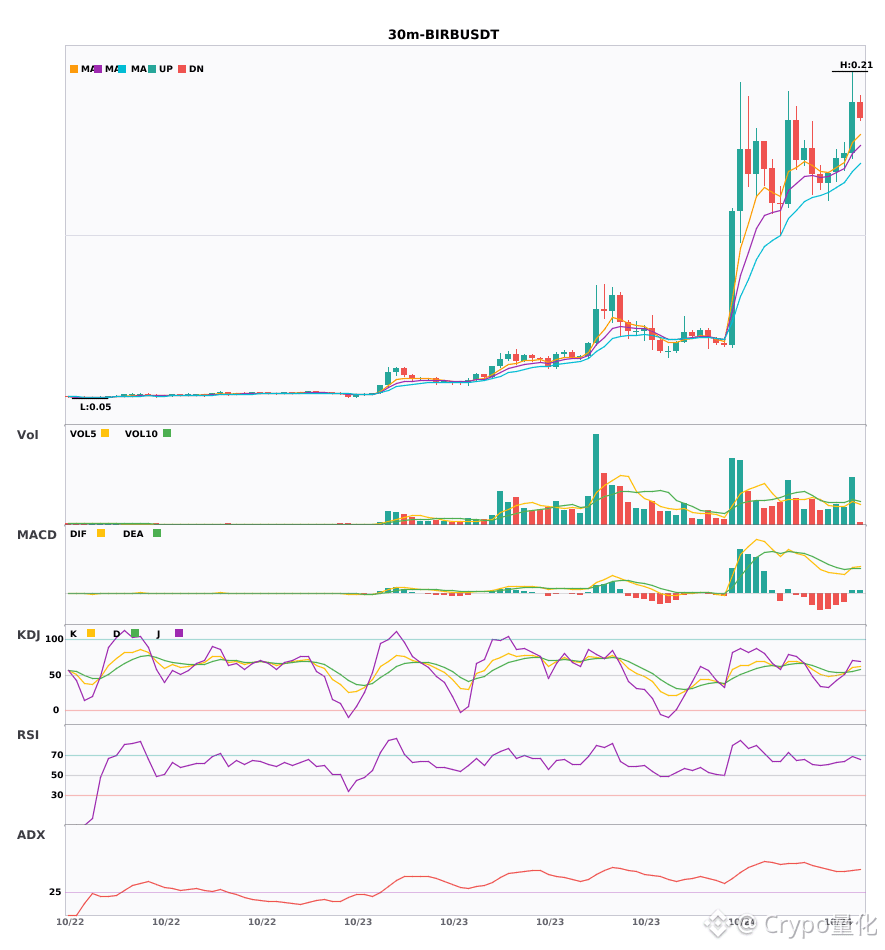
🔴 $BIRB — 30-minute bullish signal
⚠️Technical analysis: ADX (47): very strong trend (watch for an overheated pullback) | MACD golden cross above zero; bullish momentum is building | EMA5 > EMA8 > EMA13; bullish alignment | KDJ golden cross; short-term outlook is bullish (K: 60.2, D: 55.4) | Volume increased (1.9x)
════════════════════
🔔 Follow for first-hand market movement alerts 🔔
#技术分析 #AIN #CVX #BIRB
📌 When trading, check whether the candlestick pattern meets your criteria.
════════════════════
🔴 $AIN — 30-minute bullish signal
⚠️Technical analysis: ADX (25): trend is forming; potential opportunity | MACD golden cross above zero; bullish momentum is building | EMA5 crosses above EMA8; short-term trend turns bullish | KDJ golden cross; short-term outlook is bullish (K: 38.7, D: 35.6) | Volume increased (1.9x)
════════════════════
🔴 $CVX — 30-minute bullish signal
⚠️Technical analysis: ADX (27): trend is forming; potential opportunity | MACD DIF breaks above the zero line; trend turns bullish | EMA5 crosses above EMA8; short-term trend turns bullish | Volume increased (2.4x)
════════════════════
🔴 $BIRB — 30-minute bullish signal
⚠️Technical analysis: ADX (47): very strong trend (watch for an overheated pullback) | MACD golden cross above zero; bullish momentum is building | EMA5 > EMA8 > EMA13; bullish alignment | KDJ golden cross; short-term outlook is bullish (K: 60.2, D: 55.4) | Volume increased (1.9x)
════════════════════
🔔 Follow for first-hand market movement alerts 🔔
#技术分析 #AIN #CVX #BIRB
📌 When trading, check whether the candlestick pattern meets your criteria.
11

·
--
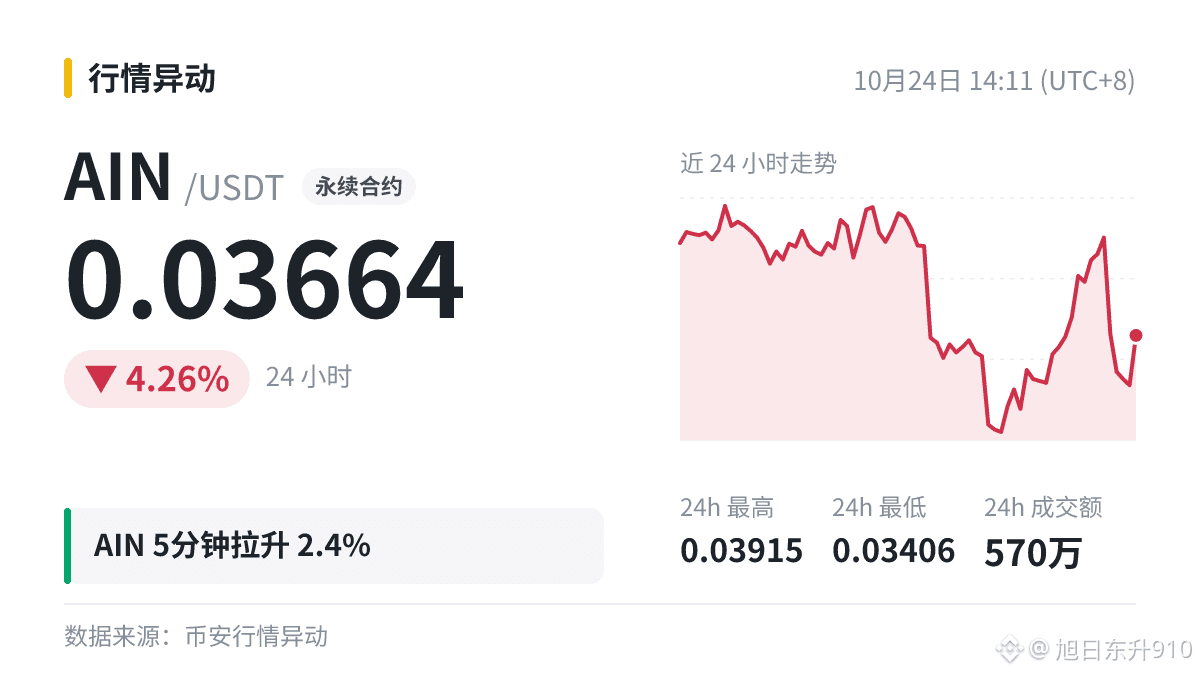
$AIN 5Minute-level rapid surge of +2.4%, with the current price at 0.03664.
Resistance lies around the 24-hour high of 0.03915. A convincing breakout would open up more upside; if a pullback holds near the launch point, the structure remains bullish.
Share your take in the comments, and we’ll check back later to see who got it right.
#AIN
Resistance lies around the 24-hour high of 0.03915. A convincing breakout would open up more upside; if a pullback holds near the launch point, the structure remains bullish.
Share your take in the comments, and we’ll check back later to see who got it right.
#AIN

·
--
🐋 Order book watchers, take note: a sharp 2.4% spike in $AIN 5 minutes
To figure out who's buying, I usually watch two things first:
· Are there consecutive aggressive buy orders during the rally?
· Are large sell orders coming in after the price reaches a high?
For comparison: 24h trading volume: $5.7 million; 24h change: -4.26%. If the first condition is met and the second isn't, then this rally is genuinely backed by buying pressure.
#AIN

·
--
Latest market data: $AIN 5-minute surge of 2.4%, latest price 0.03671, 24h -4.08%.
Holding steady at a high level without pulling back suggests there isn’t much selling pressure overhead—more worth watching than the size of the rise.
Perpetual contract traders, keep an eye on the funding rate; holding for too long can also add up in costs.
#AIN
Just a record of market activity. Please make your own trading decisions.
1

·
--
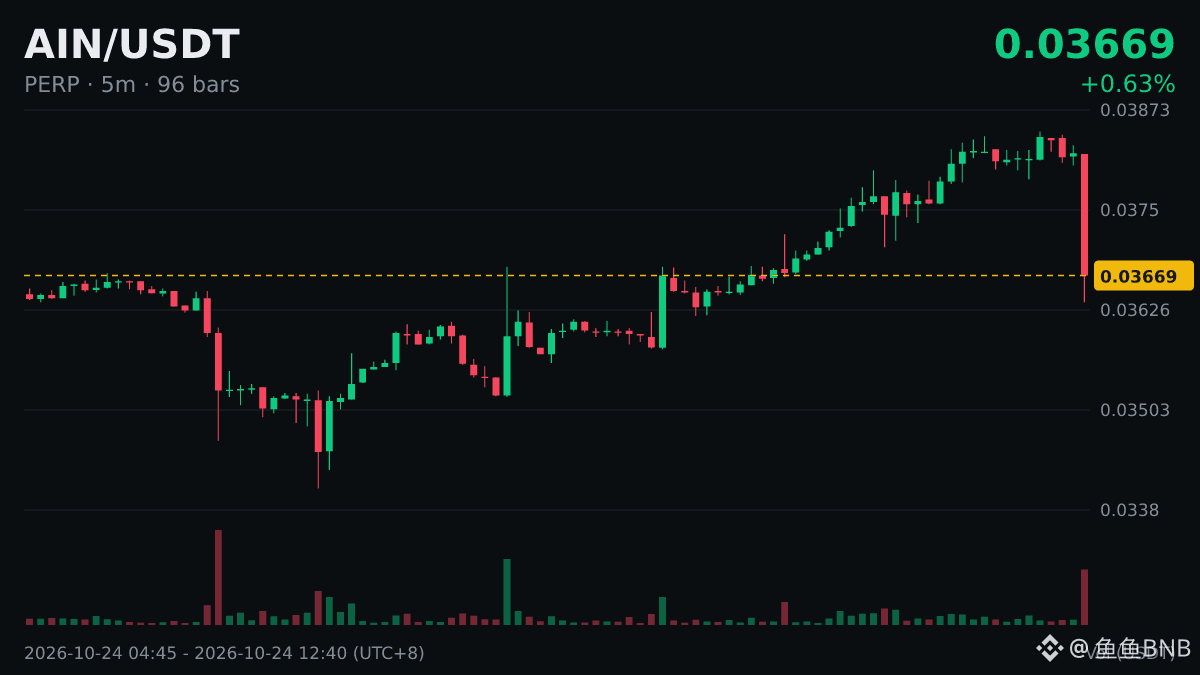
No beating around the bush. A friend just messaged me: it dropped 4.08% in $AIN 5 minutes and asked if I thought it was worth buying.
I replied: I can't say where the bottom is, but I do know that buying in immediately after a sharp drop often means catching it halfway down. I usually wait for the candlesticks to stop falling and trading volume to taper off before taking another look.
Current price: 0.03642, 24h: -5.16%. What would you say?
#AIN
14
·
--
AIN futures market: At 12:45 Beijing time on 2026-10-24, it closed down 6.23% over 5m. At the 12:45:01 observation time, the current price was 0.03584, 24h turnover was 5.3184 million, price was below VWAP 0.036204, and volume was 20.5x (low base). For now, I’m staying on the sidelines and watching. What matters more now: don’t try to guess the bottom; just watch the quality of any rebound.
Can it reclaim VWAP at 0.036204 on a pullback? Can it rebound on strong volume? That will determine whether the move is meaningful.
#AIN #Unusual Move Alert
Can it reclaim VWAP at 0.036204 on a pullback? Can it rebound on strong volume? That will determine whether the move is meaningful.
#AIN #Unusual Move Alert
2

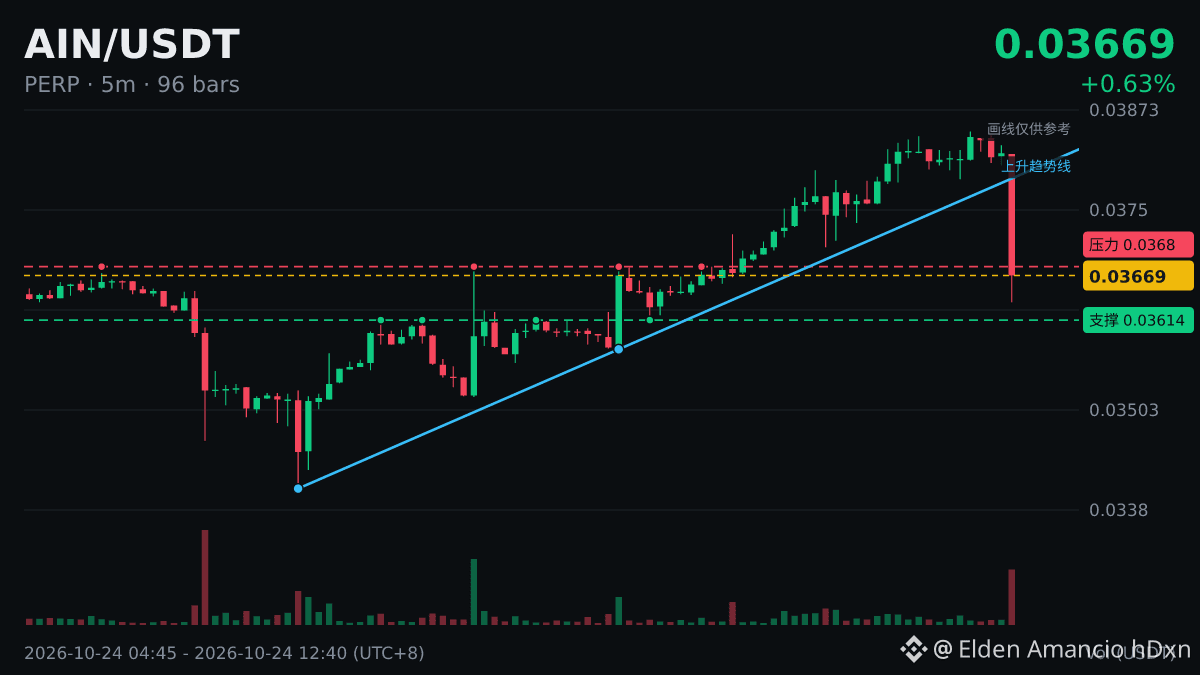
🐋 $AIN 5-minute sharp drop of 4.08%, with 24-hour trading volume of $5.23 million.
Money speaks louder than words. No matter how lively the comments get, nothing beats actual trades with real money.
Don't casually use leverage to lower your cost basis while prices are falling; this often leaves you increasingly trapped.
#AIN
Money speaks louder than words. No matter how lively the comments get, nothing beats actual trades with real money.
Don't casually use leverage to lower your cost basis while prices are falling; this often leaves you increasingly trapped.
#AIN
24

·
--
Bullish
See translation
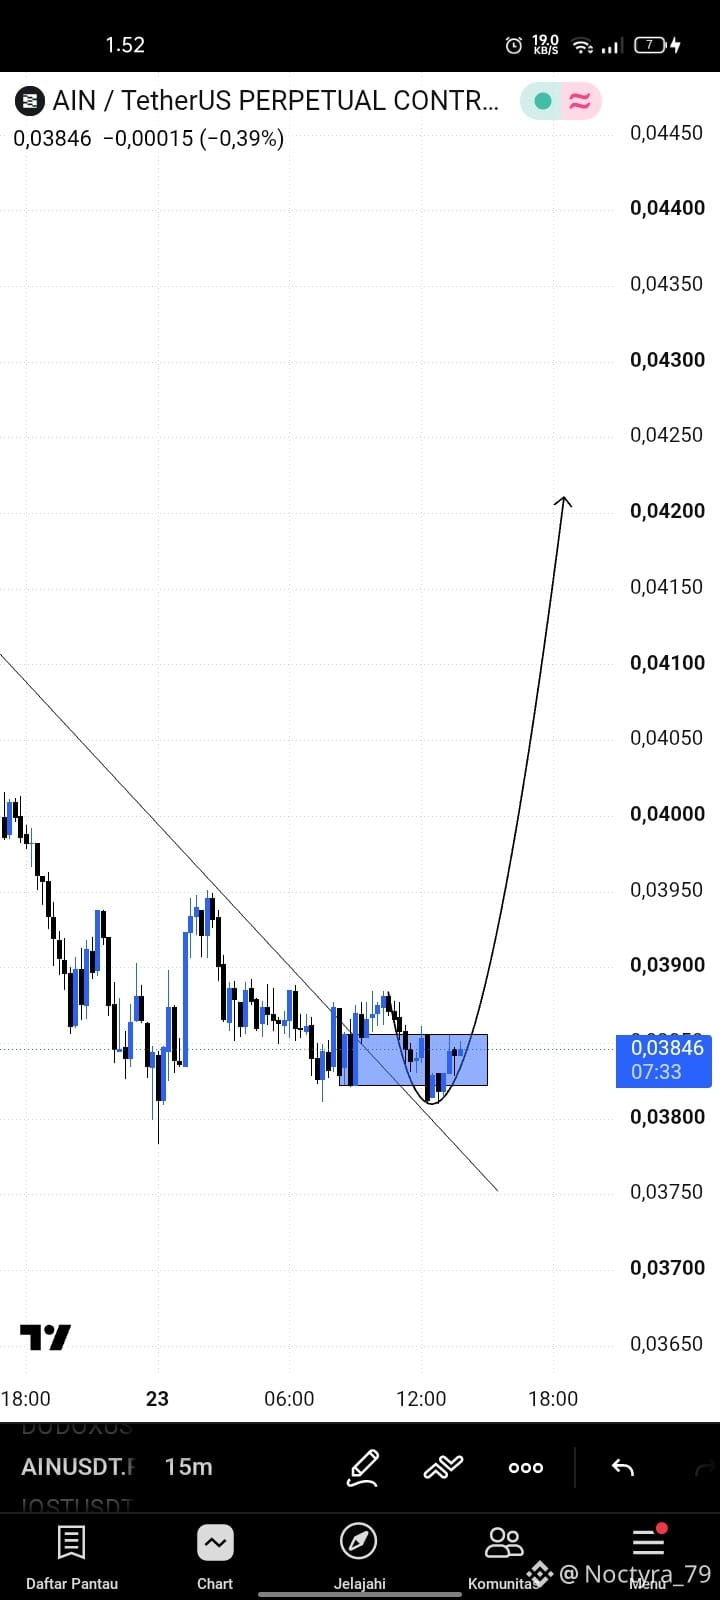
👀 $AIN — Reversal Setup in the Making?
AIN is trading around $0.03846 after a strong downtrend. Price is now testing a potential reversal zone.
📊 Key Levels to Watch:
🟦 Support zone: $0.03800–$0.03830
🚀 Resistance 1: $0.03880
🎯 Resistance 2: $0.03940
🔥 Potential upside target: $0.04200
⚠️ Bearish invalidation: Below $0.03800
A breakout above $0.03880 could strengthen the bullish scenario, while a breakdown below $0.03800 may signal further downside.
💬 What's your take?
Bullish reversal or just a dead-cat bounce?
Share your analysis in the comments!
#AIN #Crypto #trading
2
495

·
--
Holy shit!
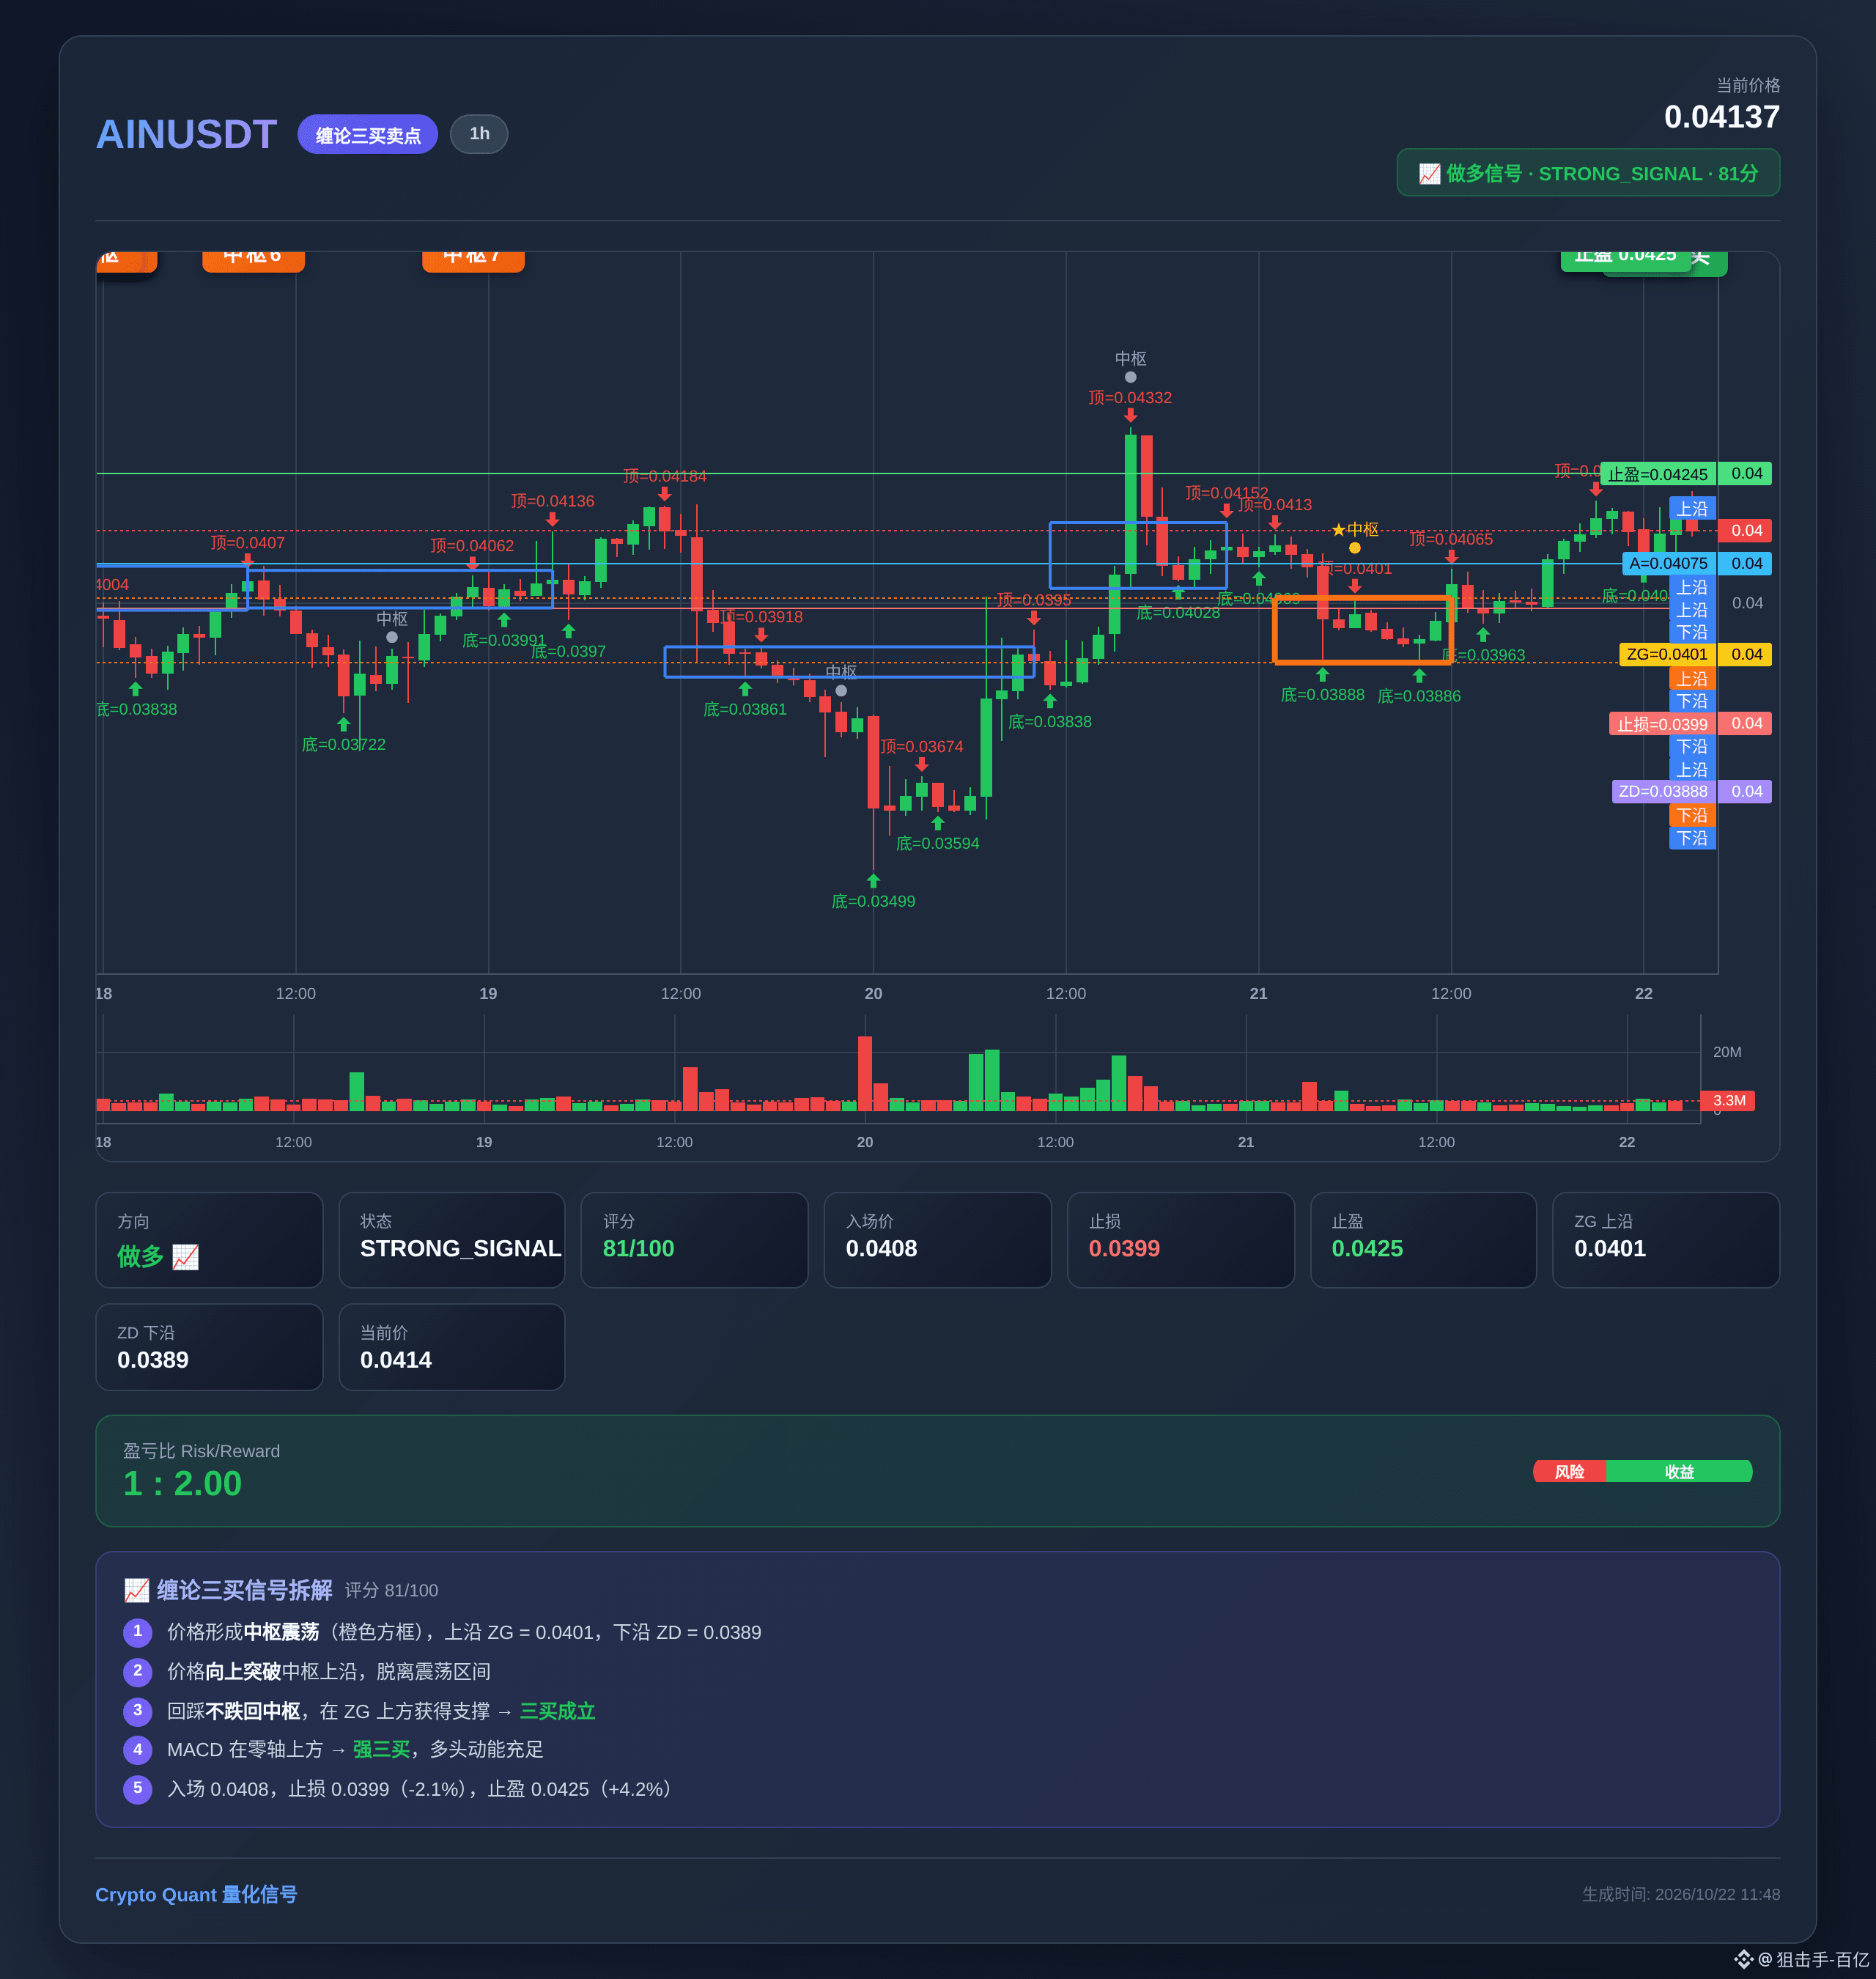
Just scanned and got an H-level signal at $AIN 1!
Do you think this one’s about to take off?
📍 Current price: 0.041710
🎯 Entry: 0.040750
🛑 Stop loss: 0.039899
💰 Take profit: 0.042451
⚖️ Risk/reward ratio: 2.0 : 1
⭐ Score: 91 points
Do you think this trade can make us some money?
#币圈 #梭哈 #山寨币 #缠论交易 #AIN
7

·
--
【AIN Market Update】24h +1.94% 🫧
▪ Current price 0.04155 U (high 0.04193 / low 0.03886)
▪ Trading volume 2.97 million U, volume 0.5x
▪ Funding rate +0.0050%, OI +0.18%
▪ Retail long/short 2.45 / whales 2.15 / fear & greed 68
▪ 7d +9.84% | 30d +82.03%
Pump to lure longs Holding on is victory Can consider adding shorts
#AIN #币安合约 #行情分析 #交易心得
Feed-Creator-a49a46d84:
抗住
9
2
1.1k

·
--
$AIN / $ARIA / $PEOPLE 30-minute bullish + 4-hour bullish alignment, multi-timeframe confluence turns bullish 🔥
════════════════════
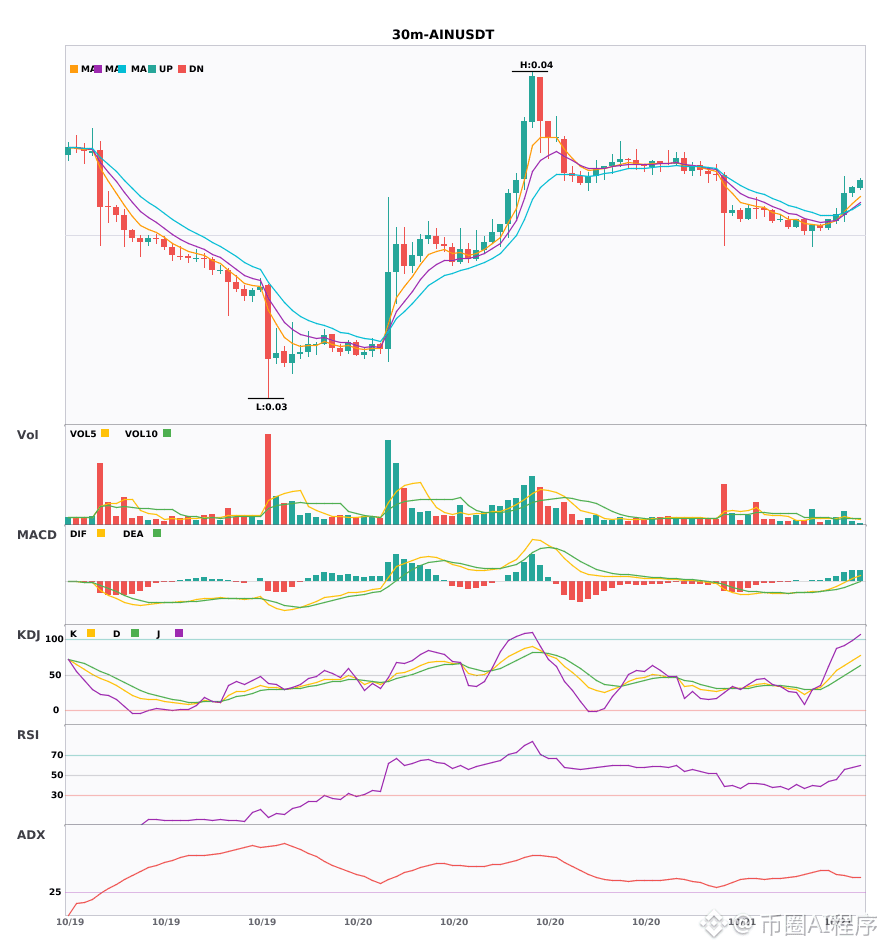
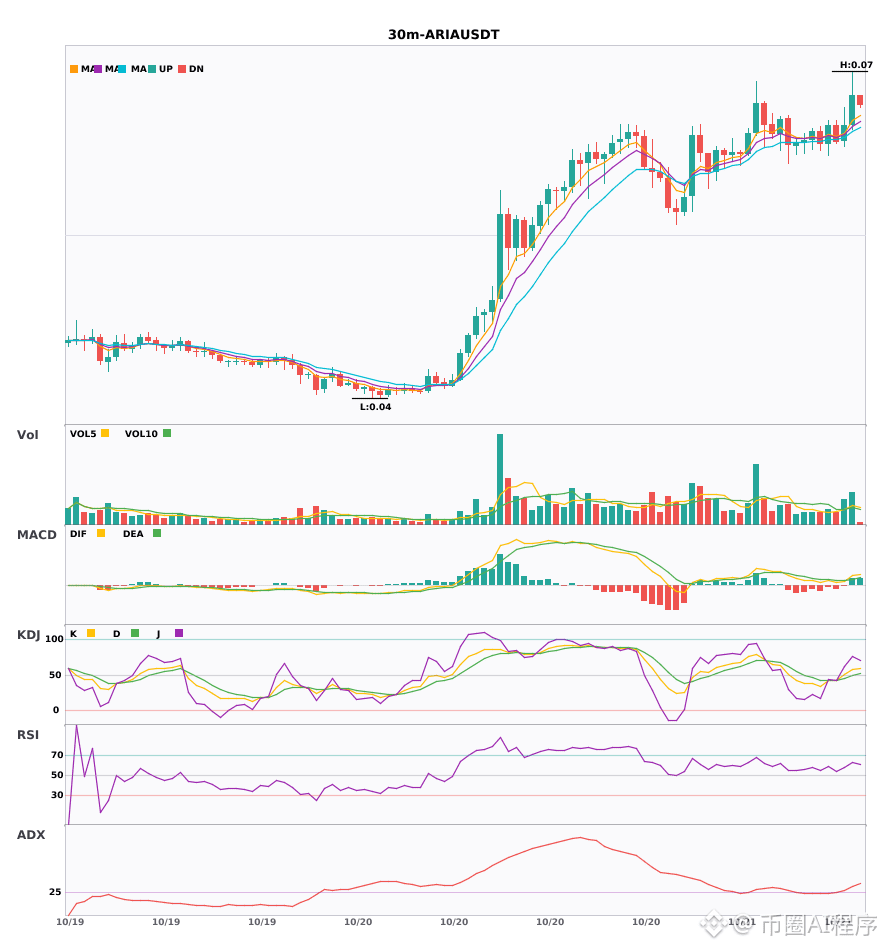
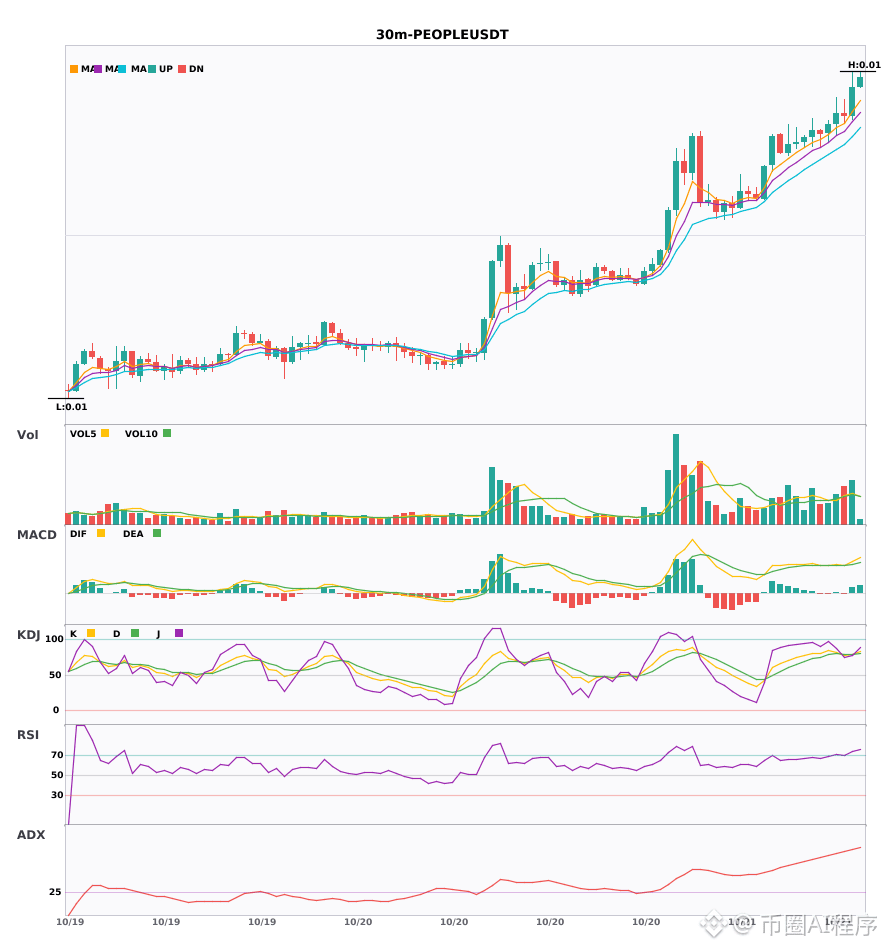
🔴 $AIN 30-minute bullish signal
⚠️ Technicals: 4-hour bullish confluence confirmed | 30-minute entry: MACD DIF breaks above the zero line, trend turns bullish | EMA5 > EMA8 > EMA13, bullish alignment | KDJ running strong, bulls in control (K=69.9, D=56.0) | Volume expands (2.0x)
════════════════════
🔴 $ARIA 30-minute bullish signal
⚠️ Technicals: 4-hour bullish confluence confirmed | 30-minute entry: MACD golden cross above zero, bullish momentum released | EMA5 > EMA8 > EMA13, bullish alignment | Volume expands (1.9x)
════════════════════
🔴 $PEOPLE 30-minute bullish signal
⚠️ Technicals: 4-hour bullish confluence confirmed | 30-minute entry: MACD golden cross above zero, bullish momentum released | EMA5 > EMA8 > EMA13, bullish alignment | KDJ running strong, bulls in control (K=78.4, D=78.7) | Volume normal (1.5x)
════════════════════
🔔 Follow for real-time market updates 🔔
#多周期共振 #AIN #ARIA #PEOPLE
📌 When trading, pay attention to whether the candlestick patterns meet the criteria
════════════════════
🔴 $AIN 30-minute bullish signal
⚠️ Technicals: 4-hour bullish confluence confirmed | 30-minute entry: MACD DIF breaks above the zero line, trend turns bullish | EMA5 > EMA8 > EMA13, bullish alignment | KDJ running strong, bulls in control (K=69.9, D=56.0) | Volume expands (2.0x)
════════════════════
🔴 $ARIA 30-minute bullish signal
⚠️ Technicals: 4-hour bullish confluence confirmed | 30-minute entry: MACD golden cross above zero, bullish momentum released | EMA5 > EMA8 > EMA13, bullish alignment | Volume expands (1.9x)
════════════════════
🔴 $PEOPLE 30-minute bullish signal
⚠️ Technicals: 4-hour bullish confluence confirmed | 30-minute entry: MACD golden cross above zero, bullish momentum released | EMA5 > EMA8 > EMA13, bullish alignment | KDJ running strong, bulls in control (K=78.4, D=78.7) | Volume normal (1.5x)
════════════════════
🔔 Follow for real-time market updates 🔔
#多周期共振 #AIN #ARIA #PEOPLE
📌 When trading, pay attention to whether the candlestick patterns meet the criteria
7
·
--
Three 30-minute bullish signals appeared at the same time: $AIN / $NIGHT / $ARIA🔥
════════════════════
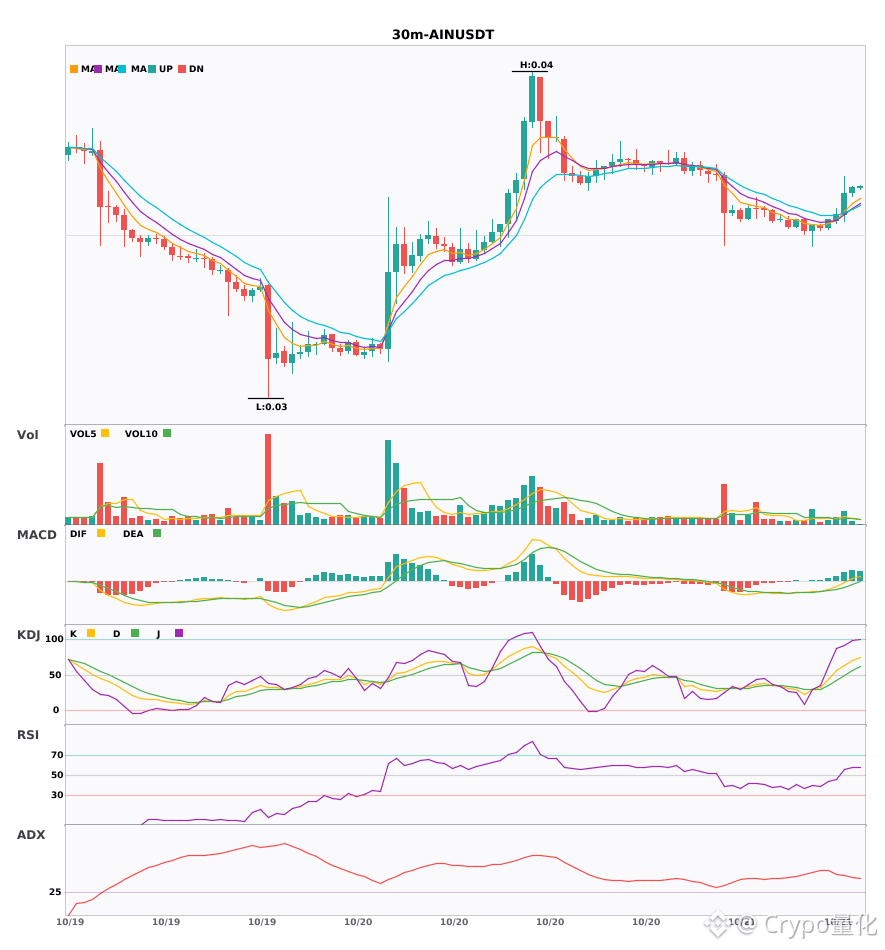
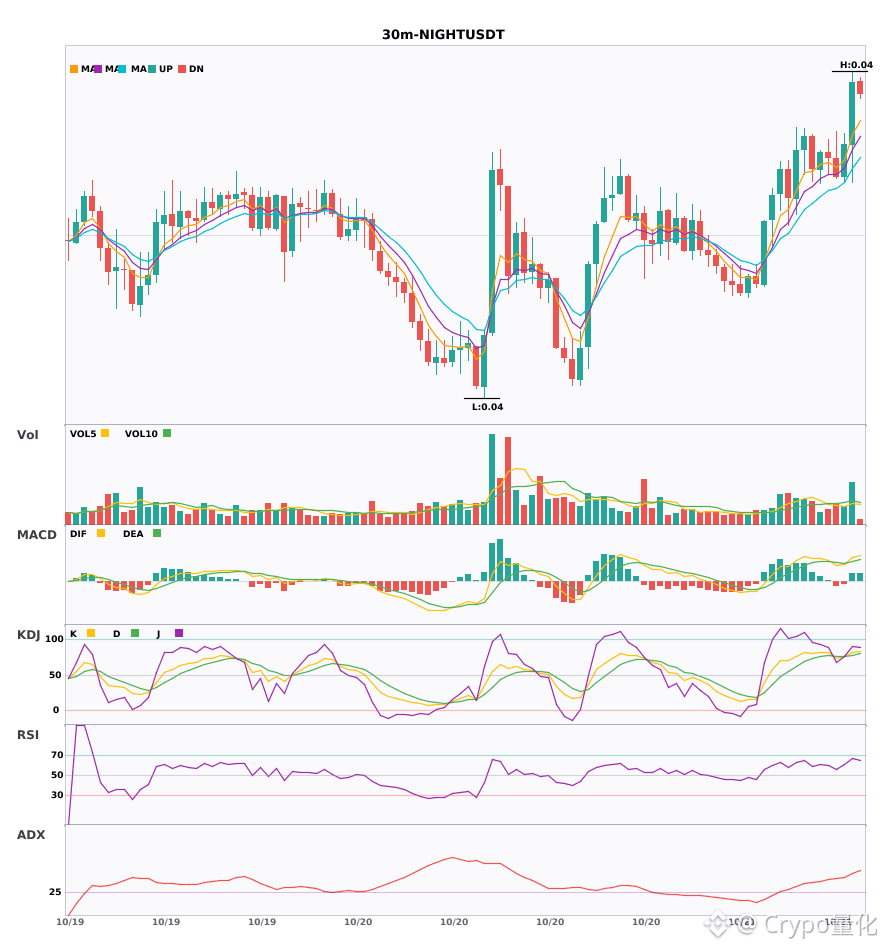
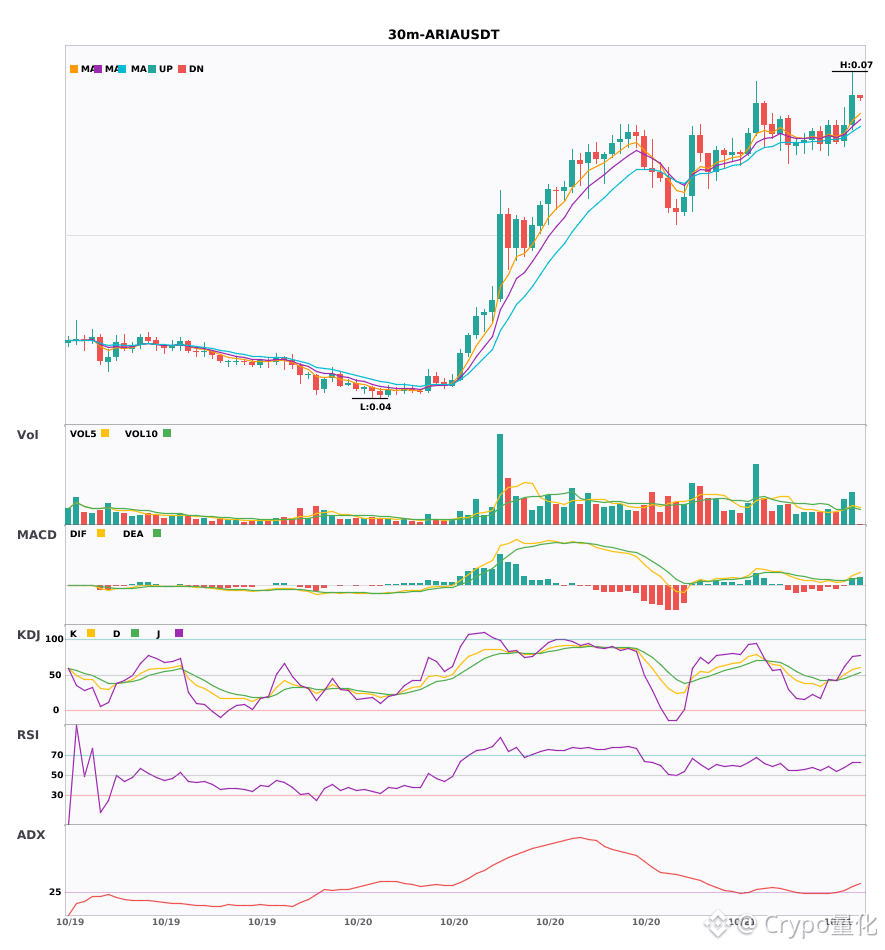
🔴 $AIN 30-minute bullish signal
⚠️Technical analysis: ADX (45): clear trend | MACD DIF breaks above zero, signaling a bullish trend shift | EMA5 > EMA8 > EMA13: bullish alignment | KDJ is strong, with bulls in control (K: 69.9, D: 56.0) | Volume increased (2.0x)
════════════════════
🔴 $NIGHT 30-minute bullish signal
⚠️Technical analysis: ADX (50): very strong trend (watch out for an overheated pullback) | MACD bullish crossover above zero, releasing bullish momentum | EMA5 > EMA8 > EMA13: bullish alignment | KDJ is strong, with bulls in control (K: 81.7, D: 77.9) | Volume increased (1.7x)
════════════════════
🔴 $ARIA 30-minute bullish signal
⚠️Technical analysis: ADX (33): clear trend | MACD bullish crossover above zero, releasing bullish momentum | EMA5 > EMA8 > EMA13: bullish alignment | Volume increased (1.9x)
════════════════════
🔔 Follow for real-time market updates 🔔
#技术分析 #AIN #NIGHT #ARIA
📌 When trading, pay attention to whether the candlestick pattern confirms the signal
Three 30-minute bullish signals appeared at the same time: $AIN / $NIGHT / $ARIA 🔥
════════════════════
🔴 $AIN 30-minute bullish signal
⚠️Technical analysis: ADX (45): clear trend | MACD DIF breaks above zero, signaling a bullish trend shift | EMA5 > EMA8 > EMA13: bullish alignment | KDJ is strong, with bulls in control (K: 69.9, D: 56.0) | Volume increased (2.0x)
════════════════════
🔴 $NIGHT 30-minute bullish signal
⚠️Technical analysis: ADX (50): very strong trend (watch out for an overheated pullback) | MACD bullish crossover above zero, releasing bullish momentum | EMA5 > EMA8 > EMA13: bullish alignment | KDJ is strong, with bulls in control (K: 81.7, D: 77.9) | Volume increased (1.7x)
════════════════════
🔴 $ARIA 30-minute bullish signal
⚠️Technical analysis: ADX (33): clear trend | MACD bullish crossover above zero, releasing bullish momentum | EMA5 > EMA8 > EMA13: bullish alignment | Volume increased (1.9x)
════════════════════
🔔 Follow for real-time market updates 🔔
#技术分析 #AIN #NIGHT #ARIA
📌 When trading, pay attention to whether the candlestick pattern confirms the signal
════════════════════
🔴 $AIN 30-minute bullish signal
⚠️Technical analysis: ADX (45): clear trend | MACD DIF breaks above zero, signaling a bullish trend shift | EMA5 > EMA8 > EMA13: bullish alignment | KDJ is strong, with bulls in control (K: 69.9, D: 56.0) | Volume increased (2.0x)
════════════════════
🔴 $NIGHT 30-minute bullish signal
⚠️Technical analysis: ADX (50): very strong trend (watch out for an overheated pullback) | MACD bullish crossover above zero, releasing bullish momentum | EMA5 > EMA8 > EMA13: bullish alignment | KDJ is strong, with bulls in control (K: 81.7, D: 77.9) | Volume increased (1.7x)
════════════════════
🔴 $ARIA 30-minute bullish signal
⚠️Technical analysis: ADX (33): clear trend | MACD bullish crossover above zero, releasing bullish momentum | EMA5 > EMA8 > EMA13: bullish alignment | Volume increased (1.9x)
════════════════════
🔔 Follow for real-time market updates 🔔
#技术分析 #AIN #NIGHT #ARIA
📌 When trading, pay attention to whether the candlestick pattern confirms the signal
5
Log in to explore more content
Join global crypto users on Binance Square
⚡️ Get latest and useful information about crypto.
💬 Trusted by the world’s largest crypto exchange.
👍 Discover real insights from verified creators.
Email / Phone number
Trending Topics
1
#BinancePick
2.7M views
145,023 Discussing
2
#EarningsSeason
5.1M views
24,833 Discussing
3
#AnthropicS1ExpectedToday
0 views
2 Discussing
4
#SouthKoreaReportedlyWeighsFourthCryptoTaxDelay
4,592 views
183 Discussing
5
#FranklinTempletonFilesForTwoDividendToBitcoinETFs
11,379 views
302 Discussing
6
#StrategyMSTRSurpassesNasdaqInMarketCap
9,923 views
248 Discussing
7
#CanadaProposesStablecoinRedemptionWithin3BusinessDays
349 views
26 Discussing
8
#ElectrumWalletBugLetRogueServersStealFunds
15,043 views
369 Discussing
9
#ArgentineCourtDismissesLIBRACaseAgainstMilei
25,188 views
430 Discussing
10
#SKHynixReportedlyPlansSpecialDividendFromKioxiaStakeSale
3,795 views
52 Discussing