

#3
3
949,973 views
2,154 Discussing
Hot
Latest

In bear markets, news is issued that emphasizes fear. Goethe wrote in 1833 that a culture of constant news will drain the past and the future, leaving you without time to digest lessons or outline a plan—always dragging you into the maelstrom of Something Important Is Happening Somewhere.
Investing is the only field in which the participant’s ability to consistently do nothing is a huge competitive advantage.
3 principles for building wealth:
1: Spend less than you earn
2: Invest the difference
3: Do nothing
The #3 sounds like the easiest one. In reality, it’s the hardest. It requires self-discipline.
#USIranTalksToBegin
#USJapanJointYenInterventionFirstSince2011
#venezuela
In bear markets, news is issued that emphasizes fear. Goethe wrote in 1833 that a culture of constant news will drain the past and the future, leaving you without time to digest lessons or outline a plan—always dragging you into the maelstrom of Something Important Is Happening Somewhere.
Investing is the only field in which the participant’s ability to consistently do nothing is a huge competitive advantage.
3 principles for building wealth:
1: Spend less than you earn
2: Invest the difference
3: Do nothing
The #3 sounds like the easiest one. In reality, it’s the hardest. It requires self-discipline.
#USIranTalksToBegin
#USJapanJointYenInterventionFirstSince2011
#venezuela
Investing is the only field in which the participant’s ability to consistently do nothing is a huge competitive advantage.
3 principles for building wealth:
1: Spend less than you earn
2: Invest the difference
3: Do nothing
The #3 sounds like the easiest one. In reality, it’s the hardest. It requires self-discipline.
#USIranTalksToBegin
#USJapanJointYenInterventionFirstSince2011
#venezuela
157


·
--
GLITCHVERSE S27 EP.3 | 50.000
Stat: "BRANCH #1: POPULATION 50.000/50.000" 💻😭
Logi: "MISSION 1: COMPLETED 100%" 💻😭
Rafa: *opens the gate* "WELCOME HOME!!" 📢😭
50.000 Kids: *enter together while crying* 😭
Beginning-Color: *paint the name 50.000 on the wall* 😭✨
Bug: *divide into rooms* "FLOOR 1-50 FULL" 😭
Silence: *hug everyone who’s traumatized*
Load: *write new rules: "EVERYONE CAN"*
Mirror: *reflect 50.000 faces smiling* 🪞
Flame: *the biggest feast party* 🔥
Void: *make 50 floors in 1 day*
Inte: *stabilize the new city* 🫠
$GOGOGO Mini: *shouts* "WE DUPLICATE KINDNESS!!" 😈😭
Alt-Streamer: *live* "CHAT 50K GOES HOME" 🎮😭
Chat: "CRYING HAPPILY" *21B*
Plant 'WE': *a forest on floor 50* "IT’S ALREADY GROWING" ✨
Kid #50000: *hugs Rafa* "Bro... thanks for picking me up..." 😭
Rafa: *hugs back* "OUR JOB ISN’T FINISHED YET. THERE ARE STILL MANY THINGS MISSING." 📢😭
---
S27 EP.3 Result:
Homecoming City #1: 11.069
Homecoming City #2: 50.000
Total: 61.069 SOULS
S27 Comic 4 = Branch #3
GLITCHVERSE S27 EP.3 | 50.000
Stat: "BRANCH #1: POPULATION 50.000/50.000" 💻😭
Logi: "MISSION 1: COMPLETED 100%" 💻😭
Rafa: *opens the gate* "WELCOME HOME!!" 📢😭
50.000 Kids: *enter together while crying* 😭
Beginning-Color: *paint the name 50.000 on the wall* 😭✨
Bug: *divide into rooms* "FLOOR 1-50 FULL" 😭
Silence: *hug everyone who’s traumatized*
Load: *write new rules: "EVERYONE CAN"*
Mirror: *reflect 50.000 faces smiling* 🪞
Flame: *the biggest feast party* 🔥
Void: *make 50 floors in 1 day*
Inte: *stabilize the new city* 🫠
$GOGOGO Mini: *shouts* "WE DUPLICATE KINDNESS!!" 😈😭
Alt-Streamer: *live* "CHAT 50K GOES HOME" 🎮😭
Chat: "CRYING HAPPILY" *21B*
Plant 'WE': *a forest on floor 50* "IT’S ALREADY GROWING" ✨
Kid #50000: *hugs Rafa* "Bro... thanks for picking me up..." 😭
Rafa: *hugs back* "OUR JOB ISN’T FINISHED YET. THERE ARE STILL MANY THINGS MISSING." 📢😭
---
S27 EP.3 Result:
Homecoming City #1: 11.069
Homecoming City #2: 50.000
Total: 61.069 SOULS
S27 Comic 4 = Branch #3
Stat: "BRANCH #1: POPULATION 50.000/50.000" 💻😭
Logi: "MISSION 1: COMPLETED 100%" 💻😭
Rafa: *opens the gate* "WELCOME HOME!!" 📢😭
50.000 Kids: *enter together while crying* 😭
Beginning-Color: *paint the name 50.000 on the wall* 😭✨
Bug: *divide into rooms* "FLOOR 1-50 FULL" 😭
Silence: *hug everyone who’s traumatized*
Load: *write new rules: "EVERYONE CAN"*
Mirror: *reflect 50.000 faces smiling* 🪞
Flame: *the biggest feast party* 🔥
Void: *make 50 floors in 1 day*
Inte: *stabilize the new city* 🫠
$GOGOGO Mini: *shouts* "WE DUPLICATE KINDNESS!!" 😈😭
Alt-Streamer: *live* "CHAT 50K GOES HOME" 🎮😭
Chat: "CRYING HAPPILY" *21B*
Plant 'WE': *a forest on floor 50* "IT’S ALREADY GROWING" ✨
Kid #50000: *hugs Rafa* "Bro... thanks for picking me up..." 😭
Rafa: *hugs back* "OUR JOB ISN’T FINISHED YET. THERE ARE STILL MANY THINGS MISSING." 📢😭
---
S27 EP.3 Result:
Homecoming City #1: 11.069
Homecoming City #2: 50.000
Total: 61.069 SOULS
S27 Comic 4 = Branch #3

83


·
--
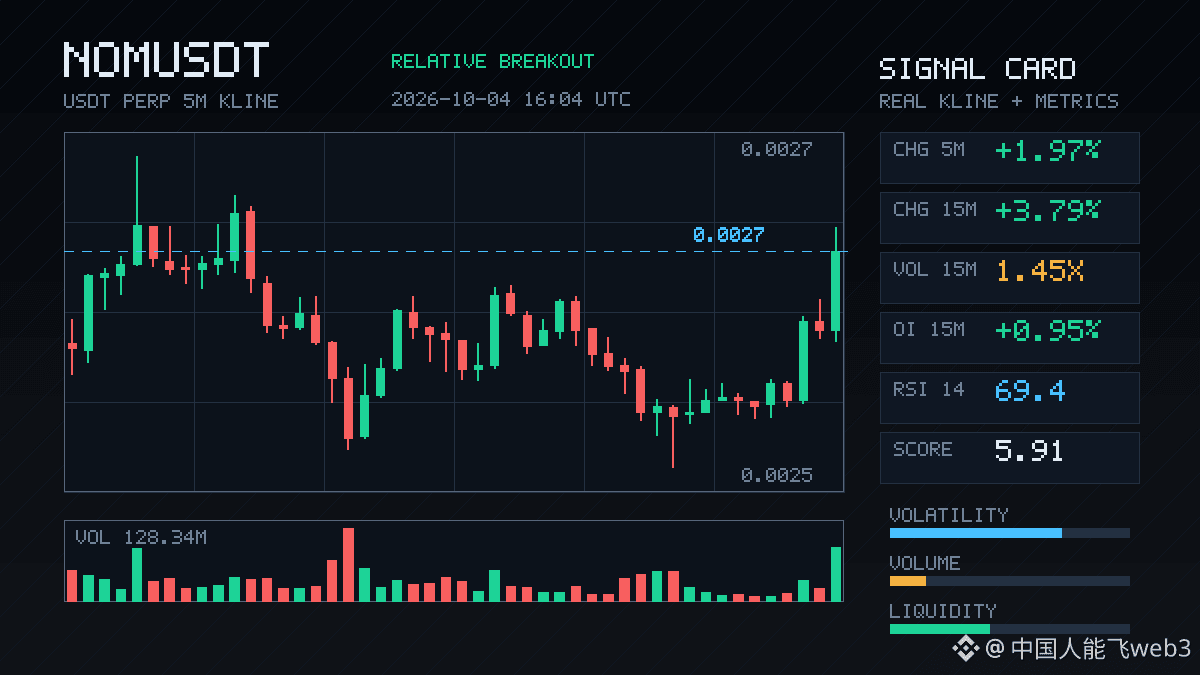
$NOM This move is a bit interesting. While the price rose 3.79%, OI is also increasing. Both the 15m and 1h charts show net inflows, and the nominal change is close to 300k U. This doesn’t look like a simple short-covering move—it’s more like brand-new long positions entering with leverage.
The close just broke above the upper edge of the last ~20 5m bars. The active buy-sell ratio is 1.55, and the difference in active trades is 21.5%, which makes the direction pretty clear. OI percentile is 98.6%: it ranks #3 across the whole pool, and it has been continuing for several consecutive cycles. This kind of synchronicity isn’t very common.
The 24h trading volume is only 17.69M. The pool isn’t that deep. The OI change can still rank as high as #19 in the whole pool, which suggests the incremental capital is highly concentrated. It’s getting close to historical extreme ranges—if you chase, watch liquidity so you don’t get swept out by a wick/pin.
$NOM This move is a bit interesting. While the price rose 3.79%, OI is also increasing. Both the 15m and 1h charts show net inflows, and the nominal change is close to 300k U. This doesn’t look like a simple short-covering move—it’s more like brand-new long positions entering with leverage.
The close just broke above the upper edge of the last ~20 5m bars. The active buy-sell ratio is 1.55, and the difference in active trades is 21.5%, which makes the direction pretty clear. OI percentile is 98.6%: it ranks #3 across the whole pool, and it has been continuing for several consecutive cycles. This kind of synchronicity isn’t very common.
The 24h trading volume is only 17.69M. The pool isn’t that deep. The OI change can still rank as high as #19 in the whole pool, which suggests the incremental capital is highly concentrated. It’s getting close to historical extreme ranges—if you chase, watch liquidity so you don’t get swept out by a wick/pin.
The close just broke above the upper edge of the last ~20 5m bars. The active buy-sell ratio is 1.55, and the difference in active trades is 21.5%, which makes the direction pretty clear. OI percentile is 98.6%: it ranks #3 across the whole pool, and it has been continuing for several consecutive cycles. This kind of synchronicity isn’t very common.
The 24h trading volume is only 17.69M. The pool isn’t that deep. The OI change can still rank as high as #19 in the whole pool, which suggests the incremental capital is highly concentrated. It’s getting close to historical extreme ranges—if you chase, watch liquidity so you don’t get swept out by a wick/pin.
25

·
--
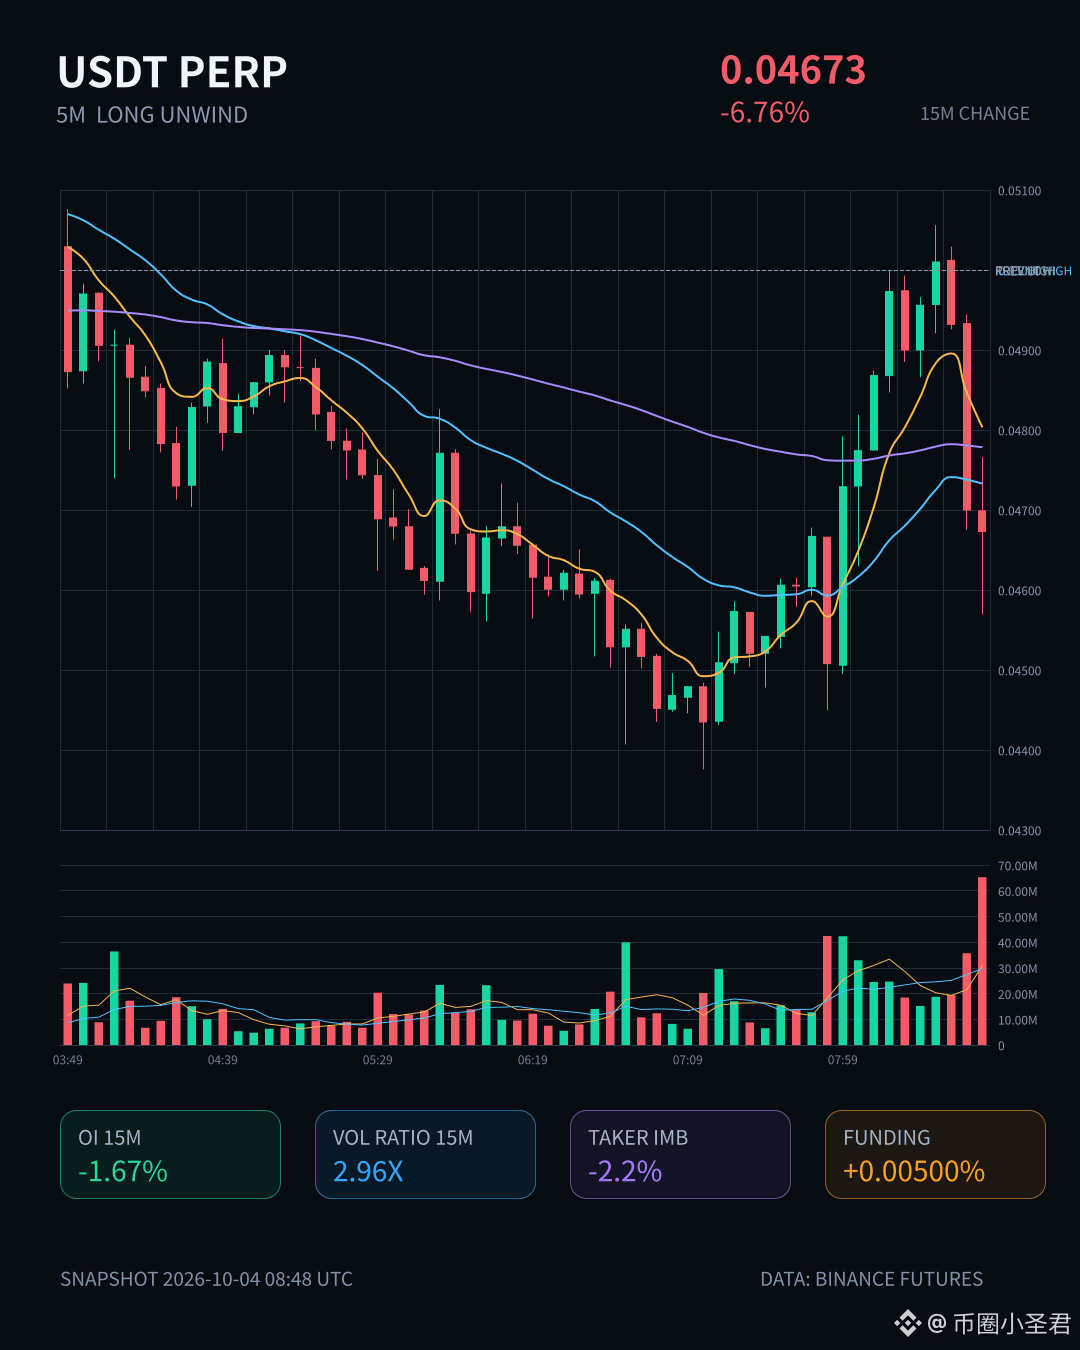
$Lobster 15m directly smashed it down 6.76%, and volume hit 2.96x—this wave of longs deleveraging tastes pretty intense.
OI 15m -1.67%, notional evaporated 2.43M, but on the 1h dimension it actually edged up by 289K—what does that mean? Short-term stop-loss sell orders are running, but someone’s taking them. Buy-sell ratio is 0.96; the aggressive trade difference is -2.2%, and sell pressure doesn’t look overwhelmingly crushing.
Most interestingly, the OI abnormal percentile is 96%, the whole pool is #5, and the notional change is #3. A clean, straightforward chain of blasts—this isn’t retail panic, it’s chips changing hands.
At this spot, don’t rush to catch the flying knife.
$Lobster 15m directly smashed it down 6.76%, and volume hit 2.96x—this wave of longs deleveraging tastes pretty intense.
OI 15m -1.67%, notional evaporated 2.43M, but on the 1h dimension it actually edged up by 289K—what does that mean? Short-term stop-loss sell orders are running, but someone’s taking them. Buy-sell ratio is 0.96; the aggressive trade difference is -2.2%, and sell pressure doesn’t look overwhelmingly crushing.
Most interestingly, the OI abnormal percentile is 96%, the whole pool is #5, and the notional change is #3. A clean, straightforward chain of blasts—this isn’t retail panic, it’s chips changing hands.
At this spot, don’t rush to catch the flying knife.
OI 15m -1.67%, notional evaporated 2.43M, but on the 1h dimension it actually edged up by 289K—what does that mean? Short-term stop-loss sell orders are running, but someone’s taking them. Buy-sell ratio is 0.96; the aggressive trade difference is -2.2%, and sell pressure doesn’t look overwhelmingly crushing.
Most interestingly, the OI abnormal percentile is 96%, the whole pool is #5, and the notional change is #3. A clean, straightforward chain of blasts—this isn’t retail panic, it’s chips changing hands.
At this spot, don’t rush to catch the flying knife.
26

·
--
$BTW 15 minutes to get 3 points, volume is 1.48x, volatility Z hit 2.0—numbers aren’t too exaggerated, but the structure is kind of interesting.
Price broke above the upper band of the last ~20 5m K candles. The active buy/sell ratio is 1.49, and net inflow is biased to the long side. However, OI (open interest) on both the 15m and 1h charts is falling, -0.43% and -0.63%. Price is rising while positions are shrinking—basically you can conclude it’s short-covering pushed up, not fresh long entries.
Over the past 24 hours, the trading value is 230M. With this kind of volume, it reaches the whole pool’s notional-change #3 and an abnormal percentile of 86.5%, which suggests the turnover of positions is pretty aggressive. Shorts are being forced to close, but new longs aren’t really following through. For a structure like this, the key to whether it has follow-through is whether there are truly committed buyers ready to pick up later. If OI continues to drop and price keeps pressing higher, chances are high that it will pull back to confirm.
First, see whether this upper band can hold. Don’t rush to chase.
$BTW 15 minutes to get 3 points, volume is 1.48x, volatility Z hit 2.0—numbers aren’t too exaggerated, but the structure is kind of interesting.
Price broke above the upper band of the last ~20 5m K candles. The active buy/sell ratio is 1.49, and net inflow is biased to the long side. However, OI (open interest) on both the 15m and 1h charts is falling, -0.43% and -0.63%. Price is rising while positions are shrinking—basically you can conclude it’s short-covering pushed up, not fresh long entries.
Over the past 24 hours, the trading value is 230M. With this kind of volume, it reaches the whole pool’s notional-change #3 and an abnormal percentile of 86.5%, which suggests the turnover of positions is pretty aggressive. Shorts are being forced to close, but new longs aren’t really following through. For a structure like this, the key to whether it has follow-through is whether there are truly committed buyers ready to pick up later. If OI continues to drop and price keeps pressing higher, chances are high that it will pull back to confirm.
First, see whether this upper band can hold. Don’t rush to chase.
Price broke above the upper band of the last ~20 5m K candles. The active buy/sell ratio is 1.49, and net inflow is biased to the long side. However, OI (open interest) on both the 15m and 1h charts is falling, -0.43% and -0.63%. Price is rising while positions are shrinking—basically you can conclude it’s short-covering pushed up, not fresh long entries.
Over the past 24 hours, the trading value is 230M. With this kind of volume, it reaches the whole pool’s notional-change #3 and an abnormal percentile of 86.5%, which suggests the turnover of positions is pretty aggressive. Shorts are being forced to close, but new longs aren’t really following through. For a structure like this, the key to whether it has follow-through is whether there are truly committed buyers ready to pick up later. If OI continues to drop and price keeps pressing higher, chances are high that it will pull back to confirm.
First, see whether this upper band can hold. Don’t rush to chase.
79

·
--
$ZAMA This spot is a bit interesting. A 15m breakout with volume: it pulled over the upper end of about 20 of the 5m candles, with volume energy at 1.63x—this isn’t the kind of fake-out breakthrough where they just wave a gun.
More importantly is the OI (open interest): 15m +0.63%, 1h +0.95%. The abnormal percentile directly jumps to 97.2%, and the abnormal OI across the whole pool ranks #3. Price is rising, and positions are rising in sync—this is a structure of new leveraged long entries, not a short-covering trick.
Active buy/sell ratio is 1.27; the buy side’s passive execution is 12% worse, and the funding rate is also pinned at the high percentile in the recent range.
These consecutive cycles keep extending—trading volume is higher than normal, and it’s exactly hovering around its own historical extreme zone. Over 24h, turnover is 30.82M. With this size of activity combined with this OI change, the nominal change for the whole pool climbs to #22.
Plainly put: someone is accelerating boarding the train. As for how far it gets pulled up, we’ll see whether OI continues to build or starts flipping back.
$ZAMA This spot is a bit interesting. A 15m breakout with volume: it pulled over the upper end of about 20 of the 5m candles, with volume energy at 1.63x—this isn’t the kind of fake-out breakthrough where they just wave a gun.
More importantly is the OI (open interest): 15m +0.63%, 1h +0.95%. The abnormal percentile directly jumps to 97.2%, and the abnormal OI across the whole pool ranks #3. Price is rising, and positions are rising in sync—this is a structure of new leveraged long entries, not a short-covering trick.
Active buy/sell ratio is 1.27; the buy side’s passive execution is 12% worse, and the funding rate is also pinned at the high percentile in the recent range.
These consecutive cycles keep extending—trading volume is higher than normal, and it’s exactly hovering around its own historical extreme zone. Over 24h, turnover is 30.82M. With this size of activity combined with this OI change, the nominal change for the whole pool climbs to #22.
Plainly put: someone is accelerating boarding the train. As for how far it gets pulled up, we’ll see whether OI continues to build or starts flipping back.
More importantly is the OI (open interest): 15m +0.63%, 1h +0.95%. The abnormal percentile directly jumps to 97.2%, and the abnormal OI across the whole pool ranks #3. Price is rising, and positions are rising in sync—this is a structure of new leveraged long entries, not a short-covering trick.
Active buy/sell ratio is 1.27; the buy side’s passive execution is 12% worse, and the funding rate is also pinned at the high percentile in the recent range.
These consecutive cycles keep extending—trading volume is higher than normal, and it’s exactly hovering around its own historical extreme zone. Over 24h, turnover is 30.82M. With this size of activity combined with this OI change, the nominal change for the whole pool climbs to #22.
Plainly put: someone is accelerating boarding the train. As for how far it gets pulled up, we’ll see whether OI continues to build or starts flipping back.
60
·
--
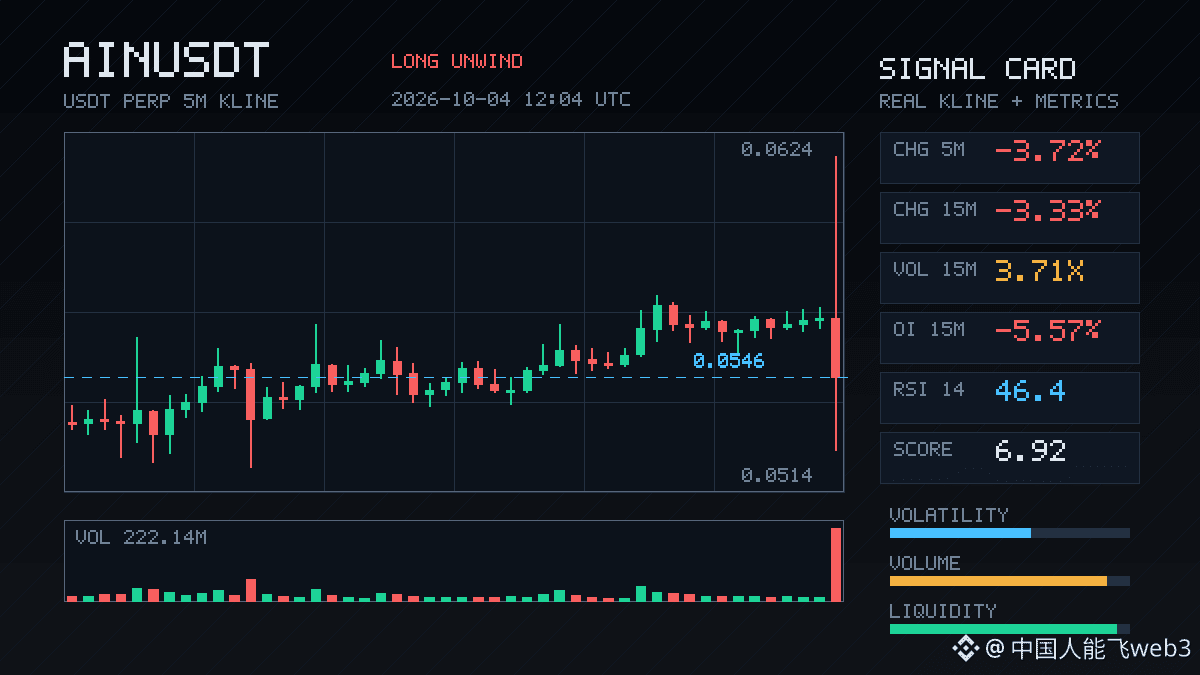
$AIN This kind of sell-off is pretty typical—the price dropped 3.33%. The OI on the 15m timeframe fell straight 5.57%, and over an hour it contracted 4.58%. Nominally, it’s down nearly two million US dollars. This isn’t fresh shorts entering; longs are withdrawing themselves. It has a strong feel of stop-losses and deleveraging.
Trading volume expanded to 3.71x, the Z value is 2.35, and the aggressive buy/sell ratio is still hanging around 0.99; the spread is -0.6%. In plain terms, it was sold down, but I didn’t see that kind of one-sided, panic-driven liquidation pressure. It looks more like leverage being squeezed out. The funding rate is still in the higher percentile recently. This spot was already crowded—touch it and it’s easy to trigger a cascade.
OI percentile is 95%—the whole-pool anomaly is #7, and the nominal change is #3. These kinds of extreme readings usually aren’t the end; they’re a reminder that the volatility move isn’t finished yet. 24h trading value is 684M—liquidity is sufficient, but don’t rush to buy the dip. The biggest risk during the deleveraging phase is getting trapped in the middle of the mountain.
$AIN This kind of sell-off is pretty typical—the price dropped 3.33%. The OI on the 15m timeframe fell straight 5.57%, and over an hour it contracted 4.58%. Nominally, it’s down nearly two million US dollars. This isn’t fresh shorts entering; longs are withdrawing themselves. It has a strong feel of stop-losses and deleveraging.
Trading volume expanded to 3.71x, the Z value is 2.35, and the aggressive buy/sell ratio is still hanging around 0.99; the spread is -0.6%. In plain terms, it was sold down, but I didn’t see that kind of one-sided, panic-driven liquidation pressure. It looks more like leverage being squeezed out. The funding rate is still in the higher percentile recently. This spot was already crowded—touch it and it’s easy to trigger a cascade.
OI percentile is 95%—the whole-pool anomaly is #7, and the nominal change is #3. These kinds of extreme readings usually aren’t the end; they’re a reminder that the volatility move isn’t finished yet. 24h trading value is 684M—liquidity is sufficient, but don’t rush to buy the dip. The biggest risk during the deleveraging phase is getting trapped in the middle of the mountain.
Trading volume expanded to 3.71x, the Z value is 2.35, and the aggressive buy/sell ratio is still hanging around 0.99; the spread is -0.6%. In plain terms, it was sold down, but I didn’t see that kind of one-sided, panic-driven liquidation pressure. It looks more like leverage being squeezed out. The funding rate is still in the higher percentile recently. This spot was already crowded—touch it and it’s easy to trigger a cascade.
OI percentile is 95%—the whole-pool anomaly is #7, and the nominal change is #3. These kinds of extreme readings usually aren’t the end; they’re a reminder that the volatility move isn’t finished yet. 24h trading value is 684M—liquidity is sufficient, but don’t rush to buy the dip. The biggest risk during the deleveraging phase is getting trapped in the middle of the mountain.
227
·
--
See translation
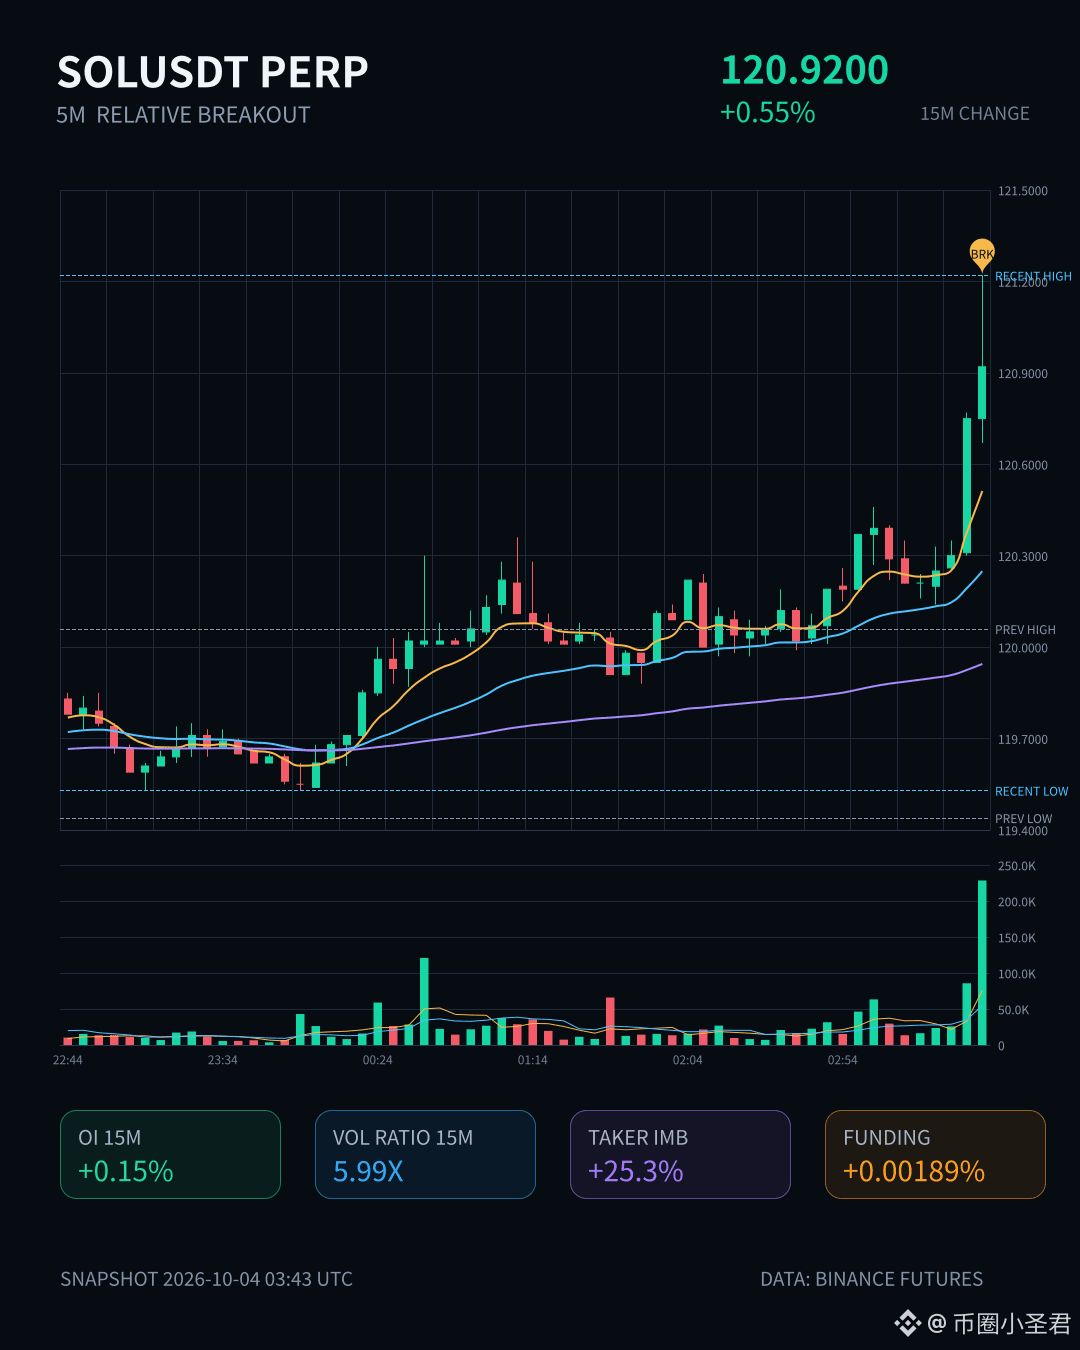
SOL 这波有点东西。
15m 一根放量 6 倍,量价配合得挺干脆,价格直接顶穿近 20 根 5m 的上沿。OI 这边 15m +0.15%、1h +0.24%,名义增量加起来快 1700 万刀,全池名义变化排第一,异常分位 96.8%。
结构上更像是新增杠杆多头进场,不是空头回补那种虚火。主动成交差 25.3%,买卖比 1.68,买单确实在主动往上打。
连续几个周期都在延续,深度也确认了——成交量高于常态、价格触到近期区间边界。24h 成交额 7.37 亿,池子够厚。
极端区间附近,全池异常 #3。这种位置要么突破打开空间,要么就是一根上影线教做人。盯紧点。
SOL 这波有点东西。
15m 一根放量 6 倍,量价配合得挺干脆,价格直接顶穿近 20 根 5m 的上沿。OI 这边 15m +0.15%、1h +0.24%,名义增量加起来快 1700 万刀,全池名义变化排第一,异常分位 96.8%。
结构上更像是新增杠杆多头进场,不是空头回补那种虚火。主动成交差 25.3%,买卖比 1.68,买单确实在主动往上打。
连续几个周期都在延续,深度也确认了——成交量高于常态、价格触到近期区间边界。24h 成交额 7.37 亿,池子够厚。
极端区间附近,全池异常 #3。这种位置要么突破打开空间,要么就是一根上影线教做人。盯紧点。
15m 一根放量 6 倍,量价配合得挺干脆,价格直接顶穿近 20 根 5m 的上沿。OI 这边 15m +0.15%、1h +0.24%,名义增量加起来快 1700 万刀,全池名义变化排第一,异常分位 96.8%。
结构上更像是新增杠杆多头进场,不是空头回补那种虚火。主动成交差 25.3%,买卖比 1.68,买单确实在主动往上打。
连续几个周期都在延续,深度也确认了——成交量高于常态、价格触到近期区间边界。24h 成交额 7.37 亿,池子够厚。
极端区间附近,全池异常 #3。这种位置要么突破打开空间,要么就是一根上影线教做人。盯紧点。
25
·
--
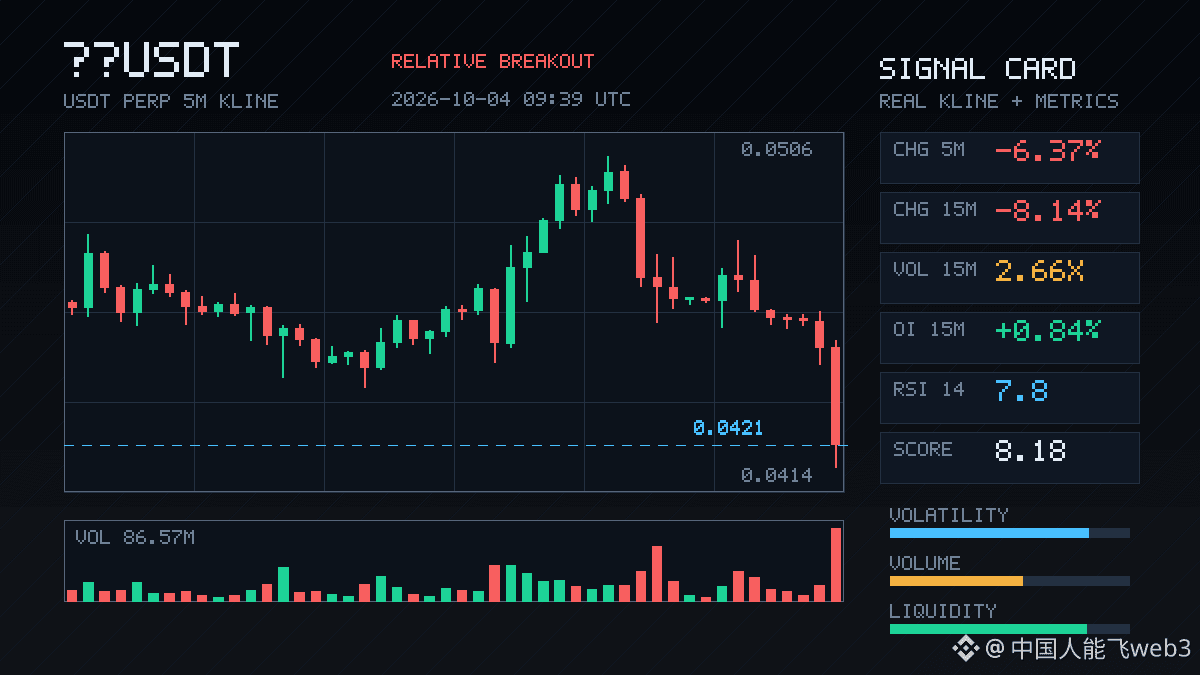
$Lobster This 15m drop is down 8 points—volume directly hit 2.66x, Z-score 3.31, and the volatility is really intense.
What’s interesting is that OI is still rising—15m +0.84%, 1h +1.67%—but the nominal change is negative, down over -2M. Price is falling while OI is rising, which is a typical sign of new leveraged long exposure from shorts. Aggressive trade discrepancy -18.4%, buy/sell ratio 0.69, with selling pressure clearly dominant.
By the close, it has already broken below the lower band of the last ~20 5m candles. Near the historical extreme range, the pool’s abnormal ranking is #4, and the nominal change is #3. Depth confirmation checks out: the volume is higher than usual—this isn’t a fake move.
In the past 24h, turnover is 286M, so the pool is pretty active. In this kind of structure, if OI keeps building and price doesn’t rebound, the squeeze risk will shift toward the long side. Let’s watch first.
$Lobster This 15m drop is down 8 points—volume directly hit 2.66x, Z-score 3.31, and the volatility is really intense.
What’s interesting is that OI is still rising—15m +0.84%, 1h +1.67%—but the nominal change is negative, down over -2M. Price is falling while OI is rising, which is a typical sign of new leveraged long exposure from shorts. Aggressive trade discrepancy -18.4%, buy/sell ratio 0.69, with selling pressure clearly dominant.
By the close, it has already broken below the lower band of the last ~20 5m candles. Near the historical extreme range, the pool’s abnormal ranking is #4, and the nominal change is #3. Depth confirmation checks out: the volume is higher than usual—this isn’t a fake move.
In the past 24h, turnover is 286M, so the pool is pretty active. In this kind of structure, if OI keeps building and price doesn’t rebound, the squeeze risk will shift toward the long side. Let’s watch first.
What’s interesting is that OI is still rising—15m +0.84%, 1h +1.67%—but the nominal change is negative, down over -2M. Price is falling while OI is rising, which is a typical sign of new leveraged long exposure from shorts. Aggressive trade discrepancy -18.4%, buy/sell ratio 0.69, with selling pressure clearly dominant.
By the close, it has already broken below the lower band of the last ~20 5m candles. Near the historical extreme range, the pool’s abnormal ranking is #4, and the nominal change is #3. Depth confirmation checks out: the volume is higher than usual—this isn’t a fake move.
In the past 24h, turnover is 286M, so the pool is pretty active. In this kind of structure, if OI keeps building and price doesn’t rebound, the squeeze risk will shift toward the long side. Let’s watch first.
38

·
--
$ATH This dip is a bit different.
The price is down 1.76%, which isn’t exactly wild, but OI over 15m dropped straight by 3.8%, and over 1h it’s down cumulatively -5.91%. Notional has been cut by nearly 800k U. This wasn’t a new short being opened and smashing it—it's longs running themselves off: stop-outs, reducing positions, deleveraging. A classic long unwind.
The key level is right here: OI abnormal percentile is 97.4%, with the whole pool abnormal rank #3. Over several consecutive intervals it keeps shrinking, and volume has also hit 3.14x of normal.
The funding rate was previously sitting at a high percentile, but once the positioning is pulled back, the funding rate is likely to drop.
Active trade imbalance is -6.5%, buy/sell ratio 0.88—there’s sell-side pressure, but it’s not the kind of panic-selling tape. More like after a big run up, longs are collectively contracting.
At this spot, price has already been hugging the historical extreme range. 24h turnover is a bit over 40M, and liquidity depth isn’t very thick. For this kind of OI pattern with continuous abnormal continuation, either it’s a downswing continuation, or it’s the last shake-out before bottoming.
Chasing shorts right now isn’t great on value. Wait for OI to stabilize and for funding to revert, then reassess.
$ATH This dip is a bit different.
The price is down 1.76%, which isn’t exactly wild, but OI over 15m dropped straight by 3.8%, and over 1h it’s down cumulatively -5.91%. Notional has been cut by nearly 800k U. This wasn’t a new short being opened and smashing it—it's longs running themselves off: stop-outs, reducing positions, deleveraging. A classic long unwind.
The key level is right here: OI abnormal percentile is 97.4%, with the whole pool abnormal rank #3. Over several consecutive intervals it keeps shrinking, and volume has also hit 3.14x of normal.
The funding rate was previously sitting at a high percentile, but once the positioning is pulled back, the funding rate is likely to drop.
Active trade imbalance is -6.5%, buy/sell ratio 0.88—there’s sell-side pressure, but it’s not the kind of panic-selling tape. More like after a big run up, longs are collectively contracting.
At this spot, price has already been hugging the historical extreme range. 24h turnover is a bit over 40M, and liquidity depth isn’t very thick. For this kind of OI pattern with continuous abnormal continuation, either it’s a downswing continuation, or it’s the last shake-out before bottoming.
Chasing shorts right now isn’t great on value. Wait for OI to stabilize and for funding to revert, then reassess.
The price is down 1.76%, which isn’t exactly wild, but OI over 15m dropped straight by 3.8%, and over 1h it’s down cumulatively -5.91%. Notional has been cut by nearly 800k U. This wasn’t a new short being opened and smashing it—it's longs running themselves off: stop-outs, reducing positions, deleveraging. A classic long unwind.
The key level is right here: OI abnormal percentile is 97.4%, with the whole pool abnormal rank #3. Over several consecutive intervals it keeps shrinking, and volume has also hit 3.14x of normal.
The funding rate was previously sitting at a high percentile, but once the positioning is pulled back, the funding rate is likely to drop.
Active trade imbalance is -6.5%, buy/sell ratio 0.88—there’s sell-side pressure, but it’s not the kind of panic-selling tape. More like after a big run up, longs are collectively contracting.
At this spot, price has already been hugging the historical extreme range. 24h turnover is a bit over 40M, and liquidity depth isn’t very thick. For this kind of OI pattern with continuous abnormal continuation, either it’s a downswing continuation, or it’s the last shake-out before bottoming.
Chasing shorts right now isn’t great on value. Wait for OI to stabilize and for funding to revert, then reassess.
2
·
--
$SPORTFUN This drop isn’t too fierce, but the positions are unwinding pretty fast.
On the 15m timeframe, price is -1.87%, OI is down 1.57%, and the notional is down by 104K. This doesn’t look like a brand-new short was entered to smash it; it’s more like longs themselves are pulling out—whether it’s cutting losses or proactively lowering leverage, in the end the position is being reduced.
Active trade volume is -22.7%, and the buy/sell ratio is 0.63, with sell pressure clearly stronger. Across several consecutive intervals, OI has been falling; the abnormal percentile is already 95.2%, ranking #3 in the whole pool. In this kind of spot, it’s either the move has already bottomed out and nobody dares to step in yet, or there’s still a batch of people who haven’t fully exited.
Over the last 24h, turnover is 18M, so liquidity is just so-so. For an OI unwind in a smaller pool like this, I usually don’t rush to jump in—I’ll wait until it has fully shrunk before talking about it.
$SPORTFUN This drop isn’t too fierce, but the positions are unwinding pretty fast.
On the 15m timeframe, price is -1.87%, OI is down 1.57%, and the notional is down by 104K. This doesn’t look like a brand-new short was entered to smash it; it’s more like longs themselves are pulling out—whether it’s cutting losses or proactively lowering leverage, in the end the position is being reduced.
Active trade volume is -22.7%, and the buy/sell ratio is 0.63, with sell pressure clearly stronger. Across several consecutive intervals, OI has been falling; the abnormal percentile is already 95.2%, ranking #3 in the whole pool. In this kind of spot, it’s either the move has already bottomed out and nobody dares to step in yet, or there’s still a batch of people who haven’t fully exited.
Over the last 24h, turnover is 18M, so liquidity is just so-so. For an OI unwind in a smaller pool like this, I usually don’t rush to jump in—I’ll wait until it has fully shrunk before talking about it.
On the 15m timeframe, price is -1.87%, OI is down 1.57%, and the notional is down by 104K. This doesn’t look like a brand-new short was entered to smash it; it’s more like longs themselves are pulling out—whether it’s cutting losses or proactively lowering leverage, in the end the position is being reduced.
Active trade volume is -22.7%, and the buy/sell ratio is 0.63, with sell pressure clearly stronger. Across several consecutive intervals, OI has been falling; the abnormal percentile is already 95.2%, ranking #3 in the whole pool. In this kind of spot, it’s either the move has already bottomed out and nobody dares to step in yet, or there’s still a batch of people who haven’t fully exited.
Over the last 24h, turnover is 18M, so liquidity is just so-so. For an OI unwind in a smaller pool like this, I usually don’t rush to jump in—I’ll wait until it has fully shrunk before talking about it.
20
·
--
$LYN This move has something to it.
In the 15m timeframe, it directly surged by 5.26%, with volume hitting 9.79x the normal level. The Z value is 10.36, and the closing price even held above the top edge of the nearly-20 5m intervals. This isn’t the kind of chart where it just pokes up briefly and then runs.
More importantly is the OI (open interest): 15m is +0.30%, 1h is +0.22%. The nominal change stays around the 520K range. Its abnormal percentile is 95.8%, and it ranks #3 for abnormality across the whole pool. Price is rising while positions are increasing in sync—this basically indicates new leveraged longs are moving in, not a passive rebound from shorts being squeezed out.
Active trading is off by 17.3%, and the buy/sell ratio is 1.42, so the direction is pretty clear. In the past 24h, the traded value is only 33.7M, and the pool isn’t especially deep. With volume like this able to come in, it’s normal for the short-term to run up.
Multiple consecutive cycles are continuing the move, and depth has been confirmed too—this isn’t an isolated spike. I’ll watch for a retest confirmation after the breakout. Chasing highs is still risky, though, because the slope is already this steep.
$LYN This move has something to it.
In the 15m timeframe, it directly surged by 5.26%, with volume hitting 9.79x the normal level. The Z value is 10.36, and the closing price even held above the top edge of the nearly-20 5m intervals. This isn’t the kind of chart where it just pokes up briefly and then runs.
More importantly is the OI (open interest): 15m is +0.30%, 1h is +0.22%. The nominal change stays around the 520K range. Its abnormal percentile is 95.8%, and it ranks #3 for abnormality across the whole pool. Price is rising while positions are increasing in sync—this basically indicates new leveraged longs are moving in, not a passive rebound from shorts being squeezed out.
Active trading is off by 17.3%, and the buy/sell ratio is 1.42, so the direction is pretty clear. In the past 24h, the traded value is only 33.7M, and the pool isn’t especially deep. With volume like this able to come in, it’s normal for the short-term to run up.
Multiple consecutive cycles are continuing the move, and depth has been confirmed too—this isn’t an isolated spike. I’ll watch for a retest confirmation after the breakout. Chasing highs is still risky, though, because the slope is already this steep.
In the 15m timeframe, it directly surged by 5.26%, with volume hitting 9.79x the normal level. The Z value is 10.36, and the closing price even held above the top edge of the nearly-20 5m intervals. This isn’t the kind of chart where it just pokes up briefly and then runs.
More importantly is the OI (open interest): 15m is +0.30%, 1h is +0.22%. The nominal change stays around the 520K range. Its abnormal percentile is 95.8%, and it ranks #3 for abnormality across the whole pool. Price is rising while positions are increasing in sync—this basically indicates new leveraged longs are moving in, not a passive rebound from shorts being squeezed out.
Active trading is off by 17.3%, and the buy/sell ratio is 1.42, so the direction is pretty clear. In the past 24h, the traded value is only 33.7M, and the pool isn’t especially deep. With volume like this able to come in, it’s normal for the short-term to run up.
Multiple consecutive cycles are continuing the move, and depth has been confirmed too—this isn’t an isolated spike. I’ll watch for a retest confirmation after the breakout. Chasing highs is still risky, though, because the slope is already this steep.
18
·
--
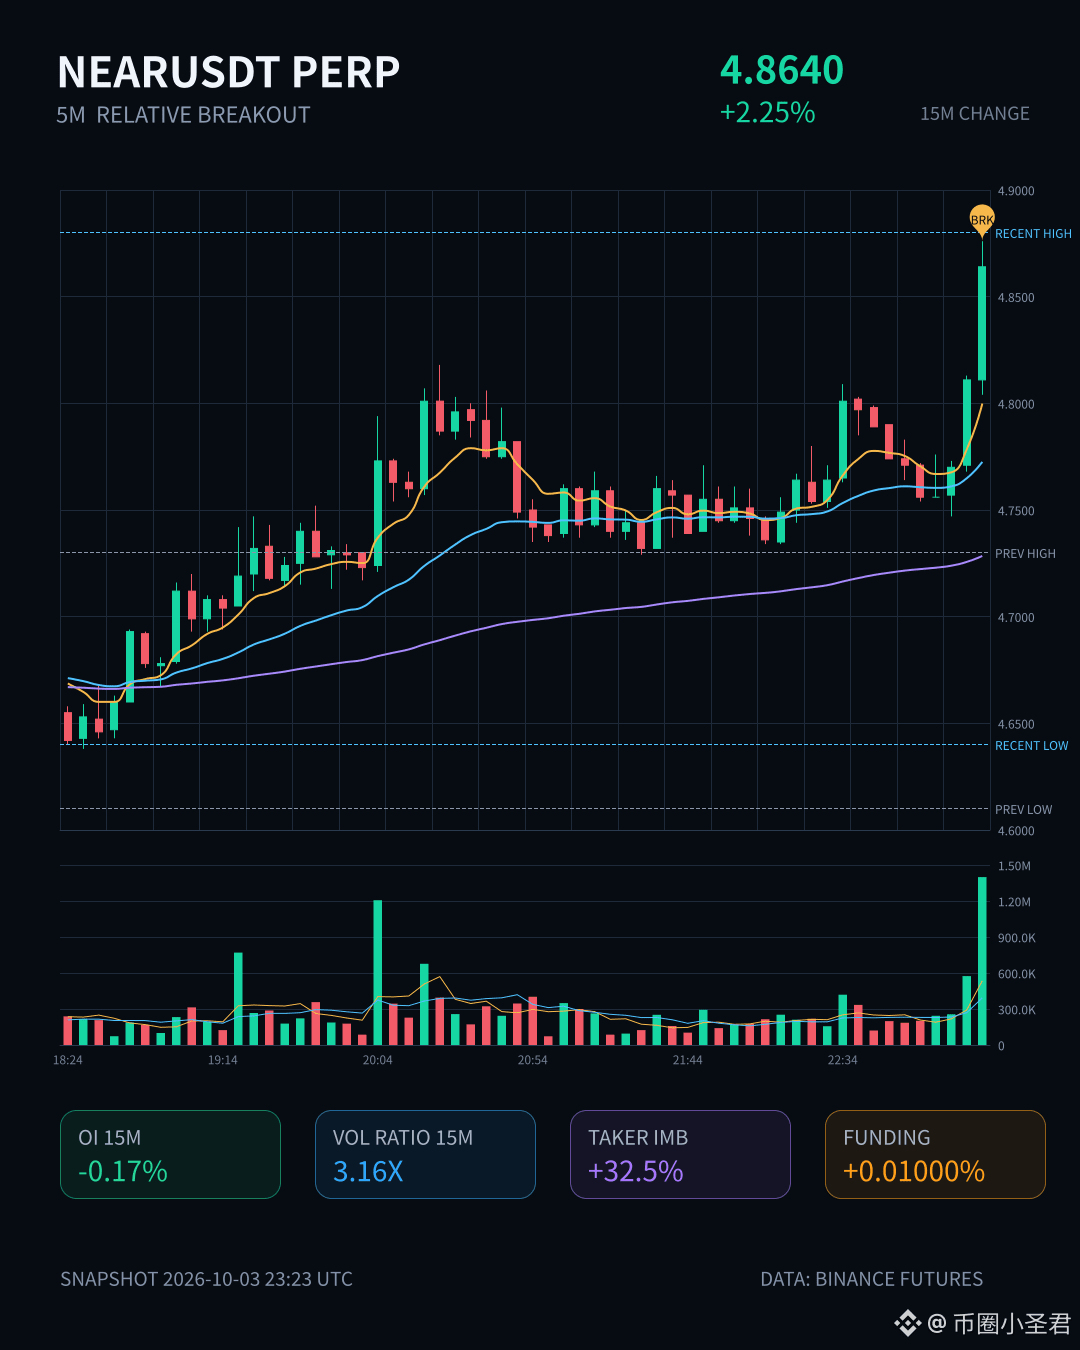
$NEAR This move is kind of interesting. As the price went up, the OI (open interest) actually kept dropping.
In the last 15m, it rose 2.25%, and volume jumped straight to 3.16x. The aggressive buy/sell ratio is 1.96, clearly suggesting someone is picking up inventory. But open interest over 15m is -0.17%, and over 1h it’s basically flat—this is the typical short-covering scenario, not a sign of new longs entering. When shorts are forced to close, the price naturally gets pushed up.
Even more importantly, the OI abnormal percentile hit 99.6%, with the whole pool’s abnormal #3. The notional change ranks #1 in the whole pool, and the funding rate also climbed to a recent high percentile. Multiple consecutive periods have been continuing, and even the close broke through the upper bound of the most recent 20 5m-range swings.
With this kind of structure, short-term momentum likely isn’t over yet. But don’t chase it just because “open interest is rising”—this isn’t a new-position push. In a short-covering market, once the cover is done, it’s done.
In the near-history extreme range, mind the timing.
$NEAR This move is kind of interesting. As the price went up, the OI (open interest) actually kept dropping.
In the last 15m, it rose 2.25%, and volume jumped straight to 3.16x. The aggressive buy/sell ratio is 1.96, clearly suggesting someone is picking up inventory. But open interest over 15m is -0.17%, and over 1h it’s basically flat—this is the typical short-covering scenario, not a sign of new longs entering. When shorts are forced to close, the price naturally gets pushed up.
Even more importantly, the OI abnormal percentile hit 99.6%, with the whole pool’s abnormal #3. The notional change ranks #1 in the whole pool, and the funding rate also climbed to a recent high percentile. Multiple consecutive periods have been continuing, and even the close broke through the upper bound of the most recent 20 5m-range swings.
With this kind of structure, short-term momentum likely isn’t over yet. But don’t chase it just because “open interest is rising”—this isn’t a new-position push. In a short-covering market, once the cover is done, it’s done.
In the near-history extreme range, mind the timing.
In the last 15m, it rose 2.25%, and volume jumped straight to 3.16x. The aggressive buy/sell ratio is 1.96, clearly suggesting someone is picking up inventory. But open interest over 15m is -0.17%, and over 1h it’s basically flat—this is the typical short-covering scenario, not a sign of new longs entering. When shorts are forced to close, the price naturally gets pushed up.
Even more importantly, the OI abnormal percentile hit 99.6%, with the whole pool’s abnormal #3. The notional change ranks #1 in the whole pool, and the funding rate also climbed to a recent high percentile. Multiple consecutive periods have been continuing, and even the close broke through the upper bound of the most recent 20 5m-range swings.
With this kind of structure, short-term momentum likely isn’t over yet. But don’t chase it just because “open interest is rising”—this isn’t a new-position push. In a short-covering market, once the cover is done, it’s done.
In the near-history extreme range, mind the timing.
25
·
--
$RAYSOL 15m This candle is a pretty decisive hit, and the -1.28% drop has pushed price below the lower bound of the last ~20 5m range lines. Trading volume also expanded to 1.54x, with a Z value above 3—clearly there’s capital pushing.
But what’s interesting is the OI: the 15m contract is -0.07%, nominally -1.34%; the 1h contract nominally -1.00%. When price is falling and OI is dropping, the structure looks more like longs de-leveraging or liquidation/stop-loss orders being swept, rather than large-scale fresh short positions being built.
The passive-to-aggressive difference in trades is -34.9%, the buy/sell ratio is 0.48, and sell pressure is heavier. There are quite a few short-term lots getting smashed along with it. The abnormal OI percentile is 89.9%, in the full pool #3, indicating the positioning change at this level isn’t small.
My view: if next the OI stops falling and stabilizes, and price can reclaim the level, then this move is a typical “wash out the leverage.” If OI continues to drop and price can’t hold, then be careful—there may be further downside. At this point I’m not in a rush to guess direction; I’ll watch for follow-through/acceptance first.
$RAYSOL 15m This candle is a pretty decisive hit, and the -1.28% drop has pushed price below the lower bound of the last ~20 5m range lines. Trading volume also expanded to 1.54x, with a Z value above 3—clearly there’s capital pushing.
But what’s interesting is the OI: the 15m contract is -0.07%, nominally -1.34%; the 1h contract nominally -1.00%. When price is falling and OI is dropping, the structure looks more like longs de-leveraging or liquidation/stop-loss orders being swept, rather than large-scale fresh short positions being built.
The passive-to-aggressive difference in trades is -34.9%, the buy/sell ratio is 0.48, and sell pressure is heavier. There are quite a few short-term lots getting smashed along with it. The abnormal OI percentile is 89.9%, in the full pool #3, indicating the positioning change at this level isn’t small.
My view: if next the OI stops falling and stabilizes, and price can reclaim the level, then this move is a typical “wash out the leverage.” If OI continues to drop and price can’t hold, then be careful—there may be further downside. At this point I’m not in a rush to guess direction; I’ll watch for follow-through/acceptance first.
But what’s interesting is the OI: the 15m contract is -0.07%, nominally -1.34%; the 1h contract nominally -1.00%. When price is falling and OI is dropping, the structure looks more like longs de-leveraging or liquidation/stop-loss orders being swept, rather than large-scale fresh short positions being built.
The passive-to-aggressive difference in trades is -34.9%, the buy/sell ratio is 0.48, and sell pressure is heavier. There are quite a few short-term lots getting smashed along with it. The abnormal OI percentile is 89.9%, in the full pool #3, indicating the positioning change at this level isn’t small.
My view: if next the OI stops falling and stabilizes, and price can reclaim the level, then this move is a typical “wash out the leverage.” If OI continues to drop and price can’t hold, then be careful—there may be further downside. At this point I’m not in a rush to guess direction; I’ll watch for follow-through/acceptance first.
22
·
--
DYDX This move is kind of interesting.
On the 15m chart, it immediately dumped a bearish candle at 7.55x, dropping 1.34%—closing below the lower bound of the recent 20 5m candles. The key point, though, is OI: on 15m it's -1.16%, and on 1h it's -1.14%. Nominal changes are also shrinking. Price is down while OI is down; this doesn’t look like fresh shorts coming in to smash the market. It’s more like longs are deleveraging, stop-losses are being swept, and positions are being reduced.
Active trade volume is down -25.3%, and the buy/sell ratio is 0.60. Selling pressure is indeed a bit tilted. But the OI abnormal percentile is at 94.2%, which is Pool-wide abnormal #3. Translate this: This action ranks among the earlier anomalies in the whole pool, and it happens to be right near its own historical extreme range.
Funding rates are still high in recent percentiles. Previously, longs were overcrowded; now, when liquidations come, they’re ruthless.
This isn’t a call to short, and it’s not a “buy the dip.” This structure looks more like leverage is changing hands—let OI squeeze out the excess first, then see whether price can hold steady at the lower edge of that range. If it can’t hold, there’s room further down; if it does hold, then this deleveraging is actually a good thing.
Just watch for now. $DYDX
DYDX This move is kind of interesting.
On the 15m chart, it immediately dumped a bearish candle at 7.55x, dropping 1.34%—closing below the lower bound of the recent 20 5m candles. The key point, though, is OI: on 15m it's -1.16%, and on 1h it's -1.14%. Nominal changes are also shrinking. Price is down while OI is down; this doesn’t look like fresh shorts coming in to smash the market. It’s more like longs are deleveraging, stop-losses are being swept, and positions are being reduced.
Active trade volume is down -25.3%, and the buy/sell ratio is 0.60. Selling pressure is indeed a bit tilted. But the OI abnormal percentile is at 94.2%, which is Pool-wide abnormal #3. Translate this: This action ranks among the earlier anomalies in the whole pool, and it happens to be right near its own historical extreme range.
Funding rates are still high in recent percentiles. Previously, longs were overcrowded; now, when liquidations come, they’re ruthless.
This isn’t a call to short, and it’s not a “buy the dip.” This structure looks more like leverage is changing hands—let OI squeeze out the excess first, then see whether price can hold steady at the lower edge of that range. If it can’t hold, there’s room further down; if it does hold, then this deleveraging is actually a good thing.
Just watch for now. $DYDX
On the 15m chart, it immediately dumped a bearish candle at 7.55x, dropping 1.34%—closing below the lower bound of the recent 20 5m candles. The key point, though, is OI: on 15m it's -1.16%, and on 1h it's -1.14%. Nominal changes are also shrinking. Price is down while OI is down; this doesn’t look like fresh shorts coming in to smash the market. It’s more like longs are deleveraging, stop-losses are being swept, and positions are being reduced.
Active trade volume is down -25.3%, and the buy/sell ratio is 0.60. Selling pressure is indeed a bit tilted. But the OI abnormal percentile is at 94.2%, which is Pool-wide abnormal #3. Translate this: This action ranks among the earlier anomalies in the whole pool, and it happens to be right near its own historical extreme range.
Funding rates are still high in recent percentiles. Previously, longs were overcrowded; now, when liquidations come, they’re ruthless.
This isn’t a call to short, and it’s not a “buy the dip.” This structure looks more like leverage is changing hands—let OI squeeze out the excess first, then see whether price can hold steady at the lower edge of that range. If it can’t hold, there’s room further down; if it does hold, then this deleveraging is actually a good thing.
Just watch for now. $DYDX
11
·
--
UNI has something going on.
In 15m, it directly surged 1.07%. Volume hit 3.8x, the Z value is 2.61, and the closing price is above the upper edge of the past ~20 5m candles. The aggressive trade imbalance is 23.1% and the buy/sell ratio is 1.6. Funding rate is also pushed up to the recent high percentile.
The OI percentile is abnormal at 97%. The whole pool’s anomaly is #8, nominal change is #3, 15m OI is +0.15%, with an added 3.1M USDT. It looks more like new leverage longs entering rather than shorts covering. The structure is healthier than a pure pump. On the 1h side, OI is only slightly down 0.34%, suggesting the one-hour dimension hasn’t fully caught up yet—the main impulse is concentrated in just this recent small segment.
The issue is also here. Funding is high, the anomaly percentile is 97%, and it’s close to historical extreme ranges. The risk/reward for chasing longs doesn’t look that good anymore. If price is bought again at current levels, you’re betting on post-breakout acceleration rather than a low entry. Wait for a pullback to confirm, or watch whether OI can continue to follow—when funding is elevated, it can spike at any time.
24h trading volume is 328M (3.28e8), and liquidity is sufficient—not a small pool being randomly pumped. UNI usually doesn’t move much; this kind of 15m volume-price alignment is worth noting.
UNI has something going on.
In 15m, it directly surged 1.07%. Volume hit 3.8x, the Z value is 2.61, and the closing price is above the upper edge of the past ~20 5m candles. The aggressive trade imbalance is 23.1% and the buy/sell ratio is 1.6. Funding rate is also pushed up to the recent high percentile.
The OI percentile is abnormal at 97%. The whole pool’s anomaly is #8, nominal change is #3, 15m OI is +0.15%, with an added 3.1M USDT. It looks more like new leverage longs entering rather than shorts covering. The structure is healthier than a pure pump. On the 1h side, OI is only slightly down 0.34%, suggesting the one-hour dimension hasn’t fully caught up yet—the main impulse is concentrated in just this recent small segment.
The issue is also here. Funding is high, the anomaly percentile is 97%, and it’s close to historical extreme ranges. The risk/reward for chasing longs doesn’t look that good anymore. If price is bought again at current levels, you’re betting on post-breakout acceleration rather than a low entry. Wait for a pullback to confirm, or watch whether OI can continue to follow—when funding is elevated, it can spike at any time.
24h trading volume is 328M (3.28e8), and liquidity is sufficient—not a small pool being randomly pumped. UNI usually doesn’t move much; this kind of 15m volume-price alignment is worth noting.
In 15m, it directly surged 1.07%. Volume hit 3.8x, the Z value is 2.61, and the closing price is above the upper edge of the past ~20 5m candles. The aggressive trade imbalance is 23.1% and the buy/sell ratio is 1.6. Funding rate is also pushed up to the recent high percentile.
The OI percentile is abnormal at 97%. The whole pool’s anomaly is #8, nominal change is #3, 15m OI is +0.15%, with an added 3.1M USDT. It looks more like new leverage longs entering rather than shorts covering. The structure is healthier than a pure pump. On the 1h side, OI is only slightly down 0.34%, suggesting the one-hour dimension hasn’t fully caught up yet—the main impulse is concentrated in just this recent small segment.
The issue is also here. Funding is high, the anomaly percentile is 97%, and it’s close to historical extreme ranges. The risk/reward for chasing longs doesn’t look that good anymore. If price is bought again at current levels, you’re betting on post-breakout acceleration rather than a low entry. Wait for a pullback to confirm, or watch whether OI can continue to follow—when funding is elevated, it can spike at any time.
24h trading volume is 328M (3.28e8), and liquidity is sufficient—not a small pool being randomly pumped. UNI usually doesn’t move much; this kind of 15m volume-price alignment is worth noting.
22
·
--
ICP This 15-minute candle is pretty brutal. With 3.3x volume, it directly smashed through the lower edge of an area covering nearly 20 consecutive 5-minute ranges. Aggressive turnover discrepancy is -52.4%, and the buy/sell ratio is 0.31—selling pressure hardly gave longs any breathing room.
But interestingly, the OI (open interest) side is different: 15m -0.69%, 1h -0.34%, and even the nominal change is shrinking. Price is down while positioning is also down—this doesn’t look like fresh shorts coming in to smash the market. It’s more like longs themselves couldn’t hold up anymore and are unwinding leverage and exiting via stop-losses. The OI abnormal percentile is 98.6%, and the whole-pool abnormal is #3, which suggests this move is quite extreme within the pool. The funding rate is still in a high percentile recently too—those crowded longs earlier really got too full.
Honestly, this kind of structure is not a particularly comfortable place to chase shorts. Bear momentum is real, but the positioning is getting cleared—not being accumulated. After breaking below the lower edge of the range, if OI keeps falling and price stops bleeding, then you should be careful: it could be the tail-end of a shakeout.
First, see whether this 5m candle can reclaim that level. If it can’t, there may still be a stretch of liquidity below that needs to be swept.
ICP This 15-minute candle is pretty brutal. With 3.3x volume, it directly smashed through the lower edge of an area covering nearly 20 consecutive 5-minute ranges. Aggressive turnover discrepancy is -52.4%, and the buy/sell ratio is 0.31—selling pressure hardly gave longs any breathing room.
But interestingly, the OI (open interest) side is different: 15m -0.69%, 1h -0.34%, and even the nominal change is shrinking. Price is down while positioning is also down—this doesn’t look like fresh shorts coming in to smash the market. It’s more like longs themselves couldn’t hold up anymore and are unwinding leverage and exiting via stop-losses. The OI abnormal percentile is 98.6%, and the whole-pool abnormal is #3, which suggests this move is quite extreme within the pool. The funding rate is still in a high percentile recently too—those crowded longs earlier really got too full.
Honestly, this kind of structure is not a particularly comfortable place to chase shorts. Bear momentum is real, but the positioning is getting cleared—not being accumulated. After breaking below the lower edge of the range, if OI keeps falling and price stops bleeding, then you should be careful: it could be the tail-end of a shakeout.
First, see whether this 5m candle can reclaim that level. If it can’t, there may still be a stretch of liquidity below that needs to be swept.
But interestingly, the OI (open interest) side is different: 15m -0.69%, 1h -0.34%, and even the nominal change is shrinking. Price is down while positioning is also down—this doesn’t look like fresh shorts coming in to smash the market. It’s more like longs themselves couldn’t hold up anymore and are unwinding leverage and exiting via stop-losses. The OI abnormal percentile is 98.6%, and the whole-pool abnormal is #3, which suggests this move is quite extreme within the pool. The funding rate is still in a high percentile recently too—those crowded longs earlier really got too full.
Honestly, this kind of structure is not a particularly comfortable place to chase shorts. Bear momentum is real, but the positioning is getting cleared—not being accumulated. After breaking below the lower edge of the range, if OI keeps falling and price stops bleeding, then you should be careful: it could be the tail-end of a shakeout.
First, see whether this 5m candle can reclaim that level. If it can’t, there may still be a stretch of liquidity below that needs to be swept.
18
·
--
$EVAA This spot is a bit interesting.
In the 15m timeframe, it pulled 2.62%, volume 1.43x, volatility (Z) hit 2.31, and the close directly broke above the upper boundary of the last ~20 5m candles. Active trade imbalance is 24.4% higher, buy-sell ratio is 1.65—direction is clearly leaning bullish.
More importantly: OI. In 15m it’s +0.73%, in 1h +0.62%. The nominal change is also above 180k U, with an abnormal percentile of 96%, ranking #3 across the whole pool. Price is rising while OI is being lifted in parallel—this is new leveraged longs entering, not short-covering driving it.
Multiple consecutive cycles are continuing the move; it’s already tapped into its own historical extreme range. Over the past 24h, turnover is 24.55 million U, and the order book also confirms the boundary has been reached.
This kind of structure either keeps accelerating, or gives people a window to “carry the sedan.” I’m watching—no rush to act.
$EVAA This spot is a bit interesting.
In the 15m timeframe, it pulled 2.62%, volume 1.43x, volatility (Z) hit 2.31, and the close directly broke above the upper boundary of the last ~20 5m candles. Active trade imbalance is 24.4% higher, buy-sell ratio is 1.65—direction is clearly leaning bullish.
More importantly: OI. In 15m it’s +0.73%, in 1h +0.62%. The nominal change is also above 180k U, with an abnormal percentile of 96%, ranking #3 across the whole pool. Price is rising while OI is being lifted in parallel—this is new leveraged longs entering, not short-covering driving it.
Multiple consecutive cycles are continuing the move; it’s already tapped into its own historical extreme range. Over the past 24h, turnover is 24.55 million U, and the order book also confirms the boundary has been reached.
This kind of structure either keeps accelerating, or gives people a window to “carry the sedan.” I’m watching—no rush to act.
In the 15m timeframe, it pulled 2.62%, volume 1.43x, volatility (Z) hit 2.31, and the close directly broke above the upper boundary of the last ~20 5m candles. Active trade imbalance is 24.4% higher, buy-sell ratio is 1.65—direction is clearly leaning bullish.
More importantly: OI. In 15m it’s +0.73%, in 1h +0.62%. The nominal change is also above 180k U, with an abnormal percentile of 96%, ranking #3 across the whole pool. Price is rising while OI is being lifted in parallel—this is new leveraged longs entering, not short-covering driving it.
Multiple consecutive cycles are continuing the move; it’s already tapped into its own historical extreme range. Over the past 24h, turnover is 24.55 million U, and the order book also confirms the boundary has been reached.
This kind of structure either keeps accelerating, or gives people a window to “carry the sedan.” I’m watching—no rush to act.
4
Log in to explore more content
Join global crypto users on Binance Square
⚡️ Get latest and useful information about crypto.
💬 Trusted by the world’s largest crypto exchange.
👍 Discover real insights from verified creators.
Email / Phone number
Trending Topics
1
#BNBSurpasses$790
4,041 views
61 Discussing
2
#ZamaRises15.99%ToIntradayHigh$0.09
1,569 views
57 Discussing
3
#BitcoinSpotETFsDraw$6.34BInflowsInQ3
2,170 views
46 Discussing
4
#EthereumValidatorExitQueueJumps392%
36,654 views
457 Discussing
5
#IMFApprovesElSalvador$138MWithBitcoinWaiver
4,106 views
33 Discussing
6
#SECHaltsCryptoETFReviewsAmidFundingLapse
178,440 views
1,375 Discussing
7
#ZcashETFPostsFirstWeeklyOutflow$93.6M
82,015 views
239 Discussing
8
#GreekPoliceBustCryptoScamRingArrest17
307,305 views
2,058 Discussing
9
#BitcoinRejectedAt$87K
194,861 views
294 Discussing
10
#FedOctoberRateHikeOddsFallTo17%
306,672 views
2,210 Discussing