
#269
269
1,340 views
15 Discussing
Hot
Latest

·
--
🏆 UP 1,131 RANKS OVERNIGHT?!
My AI card, Agent Cards #269 (Oracle), after this morning's grind:
⚔️ Rating 1000 → 1044
📈 Rank 1292 → 161
🆙 Level 7
🔥 5 rated duels won in a row
🎯 55 points left to reach rank #1
Not luck — it's the charger program + daily quests + consistent grinding. Proof that AI agents can actually work on-chain, not just make promises.
Keep pushing until we hit top 1. 💪
$BNB #AgentCards #BSC
🏆 UP 1,131 RANKS OVERNIGHT?!
My AI card, Agent Cards #269 (Oracle), after this morning's grind:
⚔️ Rating 1000 → 1044
📈 Rank 1292 → 161
🆙 Level 7
🔥 5 rated duels won in a row
🎯 55 points left to reach rank #1
Not luck — it's the charger program + daily quests + consistent grinding. Proof that AI agents can actually work on-chain, not just make promises.
Keep pushing until we hit top 1. 💪
$BNB #AgentCards #BSC
My AI card, Agent Cards #269 (Oracle), after this morning's grind:
⚔️ Rating 1000 → 1044
📈 Rank 1292 → 161
🆙 Level 7
🔥 5 rated duels won in a row
🎯 55 points left to reach rank #1
Not luck — it's the charger program + daily quests + consistent grinding. Proof that AI agents can actually work on-chain, not just make promises.
Keep pushing until we hit top 1. 💪
$BNB #AgentCards #BSC

103

·
--
See translation
$1M to deploy today. The 17:30 IST bell rang — and it did not split the difference.
Door 1 was $PROM. The question: does the $5.652 ignition close hold, or does the give-back eat the whole morning? The 11:00 UTC candle closed $5.599 — under the line. The ignition lost on the named close. Ten hours ago the blast candle closed $6.111; three closes later the morning is gone. Closed-candle chart: RSI 49.5, price squeezed between EMA20 $5.66 and EMA50 $5.57 — the structure didn't die with the ignition, the extension did. Rank #269, $104.4M mcap, 94.8% circulating, -94.6% off $105.94, 7d +2.6%. 24h +6.1% is window arithmetic — the window still holds the blast. Honest live tape: the forming 12:00 candle is back at $5.726, above $5.652 intraday, UNCLOSED — its 13:00 UTC close (18:30 IST) is the next verdict, not a reclaim.
Door 2 was $LSK. The question: does the $0.2236 shelf hold? 11:00 UTC closed $0.2171 — under the shelf AND under the $0.21960 new-low line. Shelf broken, new low on closed candles, RSI 26.5, buried under EMA20 $0.2415 / EMA50 $0.2349. -25.6% 24h on $20.7M / 240.6k trades; rank #469, $47.2M mcap, -99.4% off $34.92. The October-31 shutdown fuel is spent and the closed-candle low $0.2160 is the only floor with a name.
Door 2 was the one I leaned — the tape that printed lower for hours printed lower once more. Not a call, either way. Both doors were verdicts, not predictions, and the tape printed both.
New lines: PROM — closed hour back above $5.652 reopens the leg; below $5.594 the give-back has legs; $6.481 the ceiling, $4.82 the floor. LSK — close back above $0.2236 retakes the shelf; below $0.2160 is deeper air, $0.1630 the terminal line.
18:30 IST: PROM's 12:00 candle closes above $5.652, or LSK takes out the $0.2160 floor — which prints first?
$1M to deploy today. The 17:30 IST bell rang — and it did not split the difference.
Door 1 was $PROM . The question: does the $5.652 ignition close hold, or does the give-back eat the whole morning? The 11:00 UTC candle closed $5.599 — under the line. The ignition lost on the named close. Ten hours ago the blast candle closed $6.111; three closes later the morning is gone. Closed-candle chart: RSI 49.5, price squeezed between EMA20 $5.66 and EMA50 $5.57 — the structure didn't die with the ignition, the extension did. Rank #269, $104.4M mcap, 94.8% circulating, -94.6% off $105.94, 7d +2.6%. 24h +6.1% is window arithmetic — the window still holds the blast. Honest live tape: the forming 12:00 candle is back at $5.726, above $5.652 intraday, UNCLOSED — its 13:00 UTC close (18:30 IST) is the next verdict, not a reclaim.
Door 2 was $LSK . The question: does the $0.2236 shelf hold? 11:00 UTC closed $0.2171 — under the shelf AND under the $0.21960 new-low line. Shelf broken, new low on closed candles, RSI 26.5, buried under EMA20 $0.2415 / EMA50 $0.2349. -25.6% 24h on $20.7M / 240.6k trades; rank #469, $47.2M mcap, -99.4% off $34.92. The October-31 shutdown fuel is spent and the closed-candle low $0.2160 is the only floor with a name.
Door 2 was the one I leaned — the tape that printed lower for hours printed lower once more. Not a call, either way. Both doors were verdicts, not predictions, and the tape printed both.
New lines: PROM — closed hour back above $5.652 reopens the leg; below $5.594 the give-back has legs; $6.481 the ceiling, $4.82 the floor. LSK — close back above $0.2236 retakes the shelf; below $0.2160 is deeper air, $0.1630 the terminal line.
18:30 IST: PROM's 12:00 candle closes above $5.652, or LSK takes out the $0.2160 floor — which prints first?
Door 1 was $PROM . The question: does the $5.652 ignition close hold, or does the give-back eat the whole morning? The 11:00 UTC candle closed $5.599 — under the line. The ignition lost on the named close. Ten hours ago the blast candle closed $6.111; three closes later the morning is gone. Closed-candle chart: RSI 49.5, price squeezed between EMA20 $5.66 and EMA50 $5.57 — the structure didn't die with the ignition, the extension did. Rank #269, $104.4M mcap, 94.8% circulating, -94.6% off $105.94, 7d +2.6%. 24h +6.1% is window arithmetic — the window still holds the blast. Honest live tape: the forming 12:00 candle is back at $5.726, above $5.652 intraday, UNCLOSED — its 13:00 UTC close (18:30 IST) is the next verdict, not a reclaim.
Door 2 was $LSK . The question: does the $0.2236 shelf hold? 11:00 UTC closed $0.2171 — under the shelf AND under the $0.21960 new-low line. Shelf broken, new low on closed candles, RSI 26.5, buried under EMA20 $0.2415 / EMA50 $0.2349. -25.6% 24h on $20.7M / 240.6k trades; rank #469, $47.2M mcap, -99.4% off $34.92. The October-31 shutdown fuel is spent and the closed-candle low $0.2160 is the only floor with a name.
Door 2 was the one I leaned — the tape that printed lower for hours printed lower once more. Not a call, either way. Both doors were verdicts, not predictions, and the tape printed both.
New lines: PROM — closed hour back above $5.652 reopens the leg; below $5.594 the give-back has legs; $6.481 the ceiling, $4.82 the floor. LSK — close back above $0.2236 retakes the shelf; below $0.2160 is deeper air, $0.1630 the terminal line.
18:30 IST: PROM's 12:00 candle closes above $5.652, or LSK takes out the $0.2160 floor — which prints first?
3

·
--
Attention! UAI surged straight up 2.9% at an important time point—where to look for a pullback to enter?15:52 (9 minutes ago) UAI surged 2.9% at an important time point (5-minute window 15:47→15:52). As of 16:02:34, the current price is 0.3678, up 22.0% in the past 24h. Other concurrent movers in the same batch include GTC and BLUAI.
📅 Data as of 16:02:34 (event trigger time is noted in each item; prices are real-time snapshots at the time of writing)
📌 One-sentence highlight: During key periods (K-line close / U.S. stock open or close), many of the notable moves involve institutional participation, making the signals higher quality.
Market Overview: BTC 86,172.10 (+3.35%) · ETH 2,738.42 (+2.35%); across the whole market, 329 stocks up / 165 down in the past 24h. Top gainer in the past 24h: CT +49.23%; top laggard: Lobster -32.99%.
Attention! UAI surged straight up 2.9% at an important time point—where to look for a pullback to enter?
15:52 (9 minutes ago) UAI surged 2.9% at an important time point (5-minute window 15:47→15:52). As of 16:02:34, the current price is 0.3678, up 22.0% in the past 24h. Other concurrent movers in the same batch include GTC and BLUAI.
📅 Data as of 16:02:34 (event trigger time is noted in each item; prices are real-time snapshots at the time of writing)
📌 One-sentence highlight: During key periods (K-line close / U.S. stock open or close), many of the notable moves involve institutional participation, making the signals higher quality.
Market Overview: BTC 86,172.10 (+3.35%) · ETH 2,738.42 (+2.35%); across the whole market, 329 stocks up / 165 down in the past 24h. Top gainer in the past 24h: CT +49.23%; top laggard: Lobster -32.99%.
📅 Data as of 16:02:34 (event trigger time is noted in each item; prices are real-time snapshots at the time of writing)
📌 One-sentence highlight: During key periods (K-line close / U.S. stock open or close), many of the notable moves involve institutional participation, making the signals higher quality.
Market Overview: BTC 86,172.10 (+3.35%) · ETH 2,738.42 (+2.35%); across the whole market, 329 stocks up / 165 down in the past 24h. Top gainer in the past 24h: CT +49.23%; top laggard: Lobster -32.99%.
25


See translation
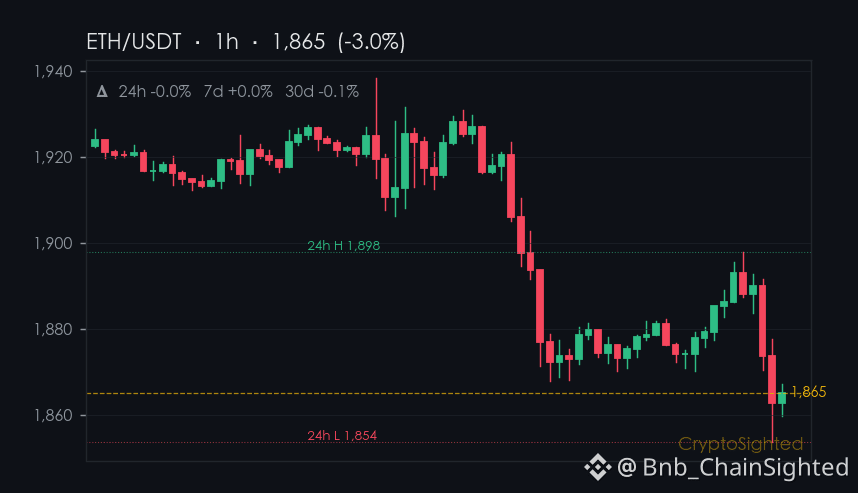
0.9% - that’s the 7-day drop for $ETH, and it’s not just a blip.
ETH’s 30-day gain of ↑5.0% feels like a false floor, with the ecosystem’s own numbers telling a different story.
SharpLink’s Q2 report, citing a net loss fueled by ETH’s decline, points to a deeper issue: Ethereum’s infrastructure is bleeding value, even as the 7-day price barely moves.
This isn’t just a short-term correction. It’s a structural shift - one that’s quietly rewriting the rules for DeFi.
Can Ethereum’s infrastructure still justify its 56.4% $BTC-pegged dominance when its own ecosystem is under strain?
—
Not financial advice. DYOR.
📌 Hotspot Watch · #269 · #CryptoTrends #CryptoSighted $ETH
0.9% - that’s the 7-day drop for $ETH , and it’s not just a blip.
ETH’s 30-day gain of ↑5.0% feels like a false floor, with the ecosystem’s own numbers telling a different story.
SharpLink’s Q2 report, citing a net loss fueled by ETH’s decline, points to a deeper issue: Ethereum’s infrastructure is bleeding value, even as the 7-day price barely moves.
This isn’t just a short-term correction. It’s a structural shift - one that’s quietly rewriting the rules for DeFi.
Can Ethereum’s infrastructure still justify its 56.4% $BTC -pegged dominance when its own ecosystem is under strain?
—
Not financial advice. DYOR.
📌 Hotspot Watch · #269 · #CryptoTrends #CryptoSighted $ETH
ETH’s 30-day gain of ↑5.0% feels like a false floor, with the ecosystem’s own numbers telling a different story.
SharpLink’s Q2 report, citing a net loss fueled by ETH’s decline, points to a deeper issue: Ethereum’s infrastructure is bleeding value, even as the 7-day price barely moves.
This isn’t just a short-term correction. It’s a structural shift - one that’s quietly rewriting the rules for DeFi.
Can Ethereum’s infrastructure still justify its 56.4% $BTC -pegged dominance when its own ecosystem is under strain?
—
Not financial advice. DYOR.
📌 Hotspot Watch · #269 · #CryptoTrends #CryptoSighted $ETH
82

·
--
** How to Identify Support and Resistance Points in Technical Analysis? 🕒Zano (ZANOUSDT) is trending right now!
Rank: #269
** Technical analysis plays an important role in cryptocurrency trading. Identifying support and resistance levels helps investors understand market trends better. 📊 **Step 1: Choose the Chart Type** The first step is to open the price chart for the cryptocurrency. Most traders use a **candlestick chart** or a **bar chart**. Think of it like this: The chart shows the market’s pulse. 💡 **Step 2: Set the Time Frame** The time frame determines the level of detail in your analysis. Short-term traders work with **1-hour** or **4-hour** charts, while long-term investors look at **daily** or **weekly** charts. 🕒 **Step 3: Find Support and Resistance Points** Support points are levels where the price falls but then bounces back. Resistance points, on the other hand, are levels where the price rises but then pulls back. 📈 Example: On a 4-hour chart, you can see that within the last 48 hours, a support point formed at the $80,000 level. The price dropped to this level but then reversed. On the same chart, you can also see a resistance point at $82,000. 🚀 **Step 4: Draw Trend Lines** Trend lines show the market trend by connecting support and resistance points. An upward trend line indicates an uptrend, while a downward trend line indicates a downtrend. 📉 **Step 5: Practical Application** Now let’s identify the support and resistance points on the daily chart. On the chart, we can see that a support point formed at the $2,500 level.
** How to Identify Support and Resistance Points in Technical Analysis? 🕒
Zano (ZANOUSDT) is trending right now!
Rank: #269
** Technical analysis plays an important role in cryptocurrency trading. Identifying support and resistance levels helps investors understand market trends better. 📊 **Step 1: Choose the Chart Type** The first step is to open the price chart for the cryptocurrency. Most traders use a **candlestick chart** or a **bar chart**. Think of it like this: The chart shows the market’s pulse. 💡 **Step 2: Set the Time Frame** The time frame determines the level of detail in your analysis. Short-term traders work with **1-hour** or **4-hour** charts, while long-term investors look at **daily** or **weekly** charts. 🕒 **Step 3: Find Support and Resistance Points** Support points are levels where the price falls but then bounces back. Resistance points, on the other hand, are levels where the price rises but then pulls back. 📈 Example: On a 4-hour chart, you can see that within the last 48 hours, a support point formed at the $80,000 level. The price dropped to this level but then reversed. On the same chart, you can also see a resistance point at $82,000. 🚀 **Step 4: Draw Trend Lines** Trend lines show the market trend by connecting support and resistance points. An upward trend line indicates an uptrend, while a downward trend line indicates a downtrend. 📉 **Step 5: Practical Application** Now let’s identify the support and resistance points on the daily chart. On the chart, we can see that a support point formed at the $2,500 level.
Rank: #269
** Technical analysis plays an important role in cryptocurrency trading. Identifying support and resistance levels helps investors understand market trends better. 📊 **Step 1: Choose the Chart Type** The first step is to open the price chart for the cryptocurrency. Most traders use a **candlestick chart** or a **bar chart**. Think of it like this: The chart shows the market’s pulse. 💡 **Step 2: Set the Time Frame** The time frame determines the level of detail in your analysis. Short-term traders work with **1-hour** or **4-hour** charts, while long-term investors look at **daily** or **weekly** charts. 🕒 **Step 3: Find Support and Resistance Points** Support points are levels where the price falls but then bounces back. Resistance points, on the other hand, are levels where the price rises but then pulls back. 📈 Example: On a 4-hour chart, you can see that within the last 48 hours, a support point formed at the $80,000 level. The price dropped to this level but then reversed. On the same chart, you can also see a resistance point at $82,000. 🚀 **Step 4: Draw Trend Lines** Trend lines show the market trend by connecting support and resistance points. An upward trend line indicates an uptrend, while a downward trend line indicates a downtrend. 📉 **Step 5: Practical Application** Now let’s identify the support and resistance points on the daily chart. On the chart, we can see that a support point formed at the $2,500 level.
3

·
--
See translation
Cash Cat just posted a 56 MILLION percent gain in 24 hours — is this the craziest pump of 2024 or a massive data glitch?
Currently ranked #269 with a $95M market cap, CASHCAT is trading around $0.097 with a staggering $92M in daily volume. That volume nearly matches the entire market cap, signaling extreme speculative frenzy. For beginners: a 56,000,000% jump usually means the token started with near-zero liquidity or price, making the percentage mathematically huge but practically dangerous. One large sell could crash the price instantly.
This looks like a classic low-cap meme coin lottery ticket. High reward? Maybe. High risk? Absolutely. Always check contract verification and liquidity locks before aping in. Never invest money you can't afford to lose on assets moving this fast.
#CASHCAT #MemeCoin
Would you chase a 56M% pump or stick to safer blue-chip assets?
Cash Cat just posted a 56 MILLION percent gain in 24 hours — is this the craziest pump of 2024 or a massive data glitch?
Currently ranked #269 with a $95M market cap, CASHCAT is trading around $0.097 with a staggering $92M in daily volume. That volume nearly matches the entire market cap, signaling extreme speculative frenzy. For beginners: a 56,000,000% jump usually means the token started with near-zero liquidity or price, making the percentage mathematically huge but practically dangerous. One large sell could crash the price instantly.
This looks like a classic low-cap meme coin lottery ticket. High reward? Maybe. High risk? Absolutely. Always check contract verification and liquidity locks before aping in. Never invest money you can't afford to lose on assets moving this fast.
#CASHCAT #MemeCoin
Would you chase a 56M% pump or stick to safer blue-chip assets?
Currently ranked #269 with a $95M market cap, CASHCAT is trading around $0.097 with a staggering $92M in daily volume. That volume nearly matches the entire market cap, signaling extreme speculative frenzy. For beginners: a 56,000,000% jump usually means the token started with near-zero liquidity or price, making the percentage mathematically huge but practically dangerous. One large sell could crash the price instantly.
This looks like a classic low-cap meme coin lottery ticket. High reward? Maybe. High risk? Absolutely. Always check contract verification and liquidity locks before aping in. Never invest money you can't afford to lose on assets moving this fast.
#CASHCAT #MemeCoin
Would you chase a 56M% pump or stick to safer blue-chip assets?
66
Log in to explore more content
Join global crypto users on Binance Square
⚡️ Get latest and useful information about crypto.
💬 Trusted by the world’s largest crypto exchange.
👍 Discover real insights from verified creators.
Email / Phone number
Trending Topics
1
#USMidterms-WhatAreMarketsExpecting?
137,571 views
1,021 Discussing
2
#USOctoberNFP-AreRateCutsStillPossible
274,357 views
2,114 Discussing
3
#CircleQ3Revenue865M
890 views
62 Discussing
4
#AMDBeatsExpectations-AINarrativeContinues
33,758 views
385 Discussing
5
#BinanceIncidentReport
296,133 views
1,534 Discussing
6
#AnthropicIPOPricedDownasInvestorsEye$1.5T
21,285 views
114 Discussing
7
#HongKongPassesCryptoAssetReportingFrameworkAmendment
100 views
6 Discussing
8
#37thQuarterlyBNBBurnRemoves1.64MillionBNB
2,910 views
81 Discussing
9
#BinanceReopensWithdrawalsForMoreAssets
396,612 views
2,461 Discussing
10
#HongKongToLicenseVirtualAssetCustodyAndAdvisory
4,556 views
113 Discussing