
#126
126
1,065 views
16 Discussing
Hot
Latest

·
--
See translation
Trending: Pons (PONSUSDT)Pons (PONSUSDT) is trending on CoinGecko!
Rank: #126
On September 1, 2026, the two largest cryptocurrencies by market capitalization continued their upward trajectory, with Bitcoin (BTC) trading at **8,776** and Ethereum (ETH) at **,473.09**. Both assets posted modest but positive 24‑hour changes—BTC up **+1.10%** and ETH up **+1.78%**—while trading volumes remained robust at roughly **9.5 billion** for Bitcoin and **2.0 billion** for Ethereum. These figures, sourced from CoinGecko, suggest that market participants are maintaining interest in the core crypto assets despite a relatively quiet day for alt‑coin movers (the top‑gainers, losers, and topMovers lists were empty at the time of the snapshot).
Several factors may be contributing to this steady performance. First, macro‑economic data released over the past week indicated a cooling of inflation pressures in major economies, which has historically reduced risk‑off sentiment and allowed speculative assets like cryptocurrencies to regain footing. Second, on‑chain metrics show that Bitcoin’s hash rate has remained near all‑time highs, signaling continued miner confidence and network security. Ethereum, meanwhile, benefited from the latest upgrade to its layer‑2 scaling ecosystem, which lowered transaction costs on several popular roll‑ups and spurred a modest uptick in decentralized finance (DeFi) activity.
Volume levels also provide insight into market health. The 9.5 billion BTC 24‑hour volume represents about 37% of its current market cap, indicating active trading rather than stagnant holding. Ethereum’s 2 billion volume corresponds to roughly 48% of its market cap, reflecting a slightly higher turnover ratio—common for ETH given its broader use in smart‑contract platforms and NFT marketplaces.
While the price moves are positive, it is important to view them within the broader context. Crypto markets remain volatile, and single‑day percentage changes can be influenced by large orders, news events, or shifts in futures positioning. Traders should continue to monitor key indicators such as the Bitcoin Fear & Greed Index, Ethereum gas prices, and macro‑economic releases (e.g., U.S. employment data, central bank statements) to gauge whether the current momentum is likely to persist or reverse.
In summary, the early September 2026 snapshot shows Bitcoin and Ethereum edging higher on solid volume, supported by improving macro conditions and ongoing network developments. As always, staying informed and employing sound risk management practices remain essential for anyone navigating the crypto landscape.
#pons #crypto #trending #CoinGecko
Trending: Pons (PONSUSDT)
Pons (PONSUSDT) is trending on CoinGecko!
Rank: #126
On September 1, 2026, the two largest cryptocurrencies by market capitalization continued their upward trajectory, with Bitcoin (BTC) trading at **8,776** and Ethereum (ETH) at **,473.09**. Both assets posted modest but positive 24‑hour changes—BTC up **+1.10%** and ETH up **+1.78%**—while trading volumes remained robust at roughly **9.5 billion** for Bitcoin and **2.0 billion** for Ethereum. These figures, sourced from CoinGecko, suggest that market participants are maintaining interest in the core crypto assets despite a relatively quiet day for alt‑coin movers (the top‑gainers, losers, and topMovers lists were empty at the time of the snapshot).
Several factors may be contributing to this steady performance. First, macro‑economic data released over the past week indicated a cooling of inflation pressures in major economies, which has historically reduced risk‑off sentiment and allowed speculative assets like cryptocurrencies to regain footing. Second, on‑chain metrics show that Bitcoin’s hash rate has remained near all‑time highs, signaling continued miner confidence and network security. Ethereum, meanwhile, benefited from the latest upgrade to its layer‑2 scaling ecosystem, which lowered transaction costs on several popular roll‑ups and spurred a modest uptick in decentralized finance (DeFi) activity.
Volume levels also provide insight into market health. The 9.5 billion BTC 24‑hour volume represents about 37% of its current market cap, indicating active trading rather than stagnant holding. Ethereum’s 2 billion volume corresponds to roughly 48% of its market cap, reflecting a slightly higher turnover ratio—common for ETH given its broader use in smart‑contract platforms and NFT marketplaces.
While the price moves are positive, it is important to view them within the broader context. Crypto markets remain volatile, and single‑day percentage changes can be influenced by large orders, news events, or shifts in futures positioning. Traders should continue to monitor key indicators such as the Bitcoin Fear & Greed Index, Ethereum gas prices, and macro‑economic releases (e.g., U.S. employment data, central bank statements) to gauge whether the current momentum is likely to persist or reverse.
In summary, the early September 2026 snapshot shows Bitcoin and Ethereum edging higher on solid volume, supported by improving macro conditions and ongoing network developments. As always, staying informed and employing sound risk management practices remain essential for anyone navigating the crypto landscape.
#pons #crypto #trending #CoinGecko
Rank: #126
On September 1, 2026, the two largest cryptocurrencies by market capitalization continued their upward trajectory, with Bitcoin (BTC) trading at **8,776** and Ethereum (ETH) at **,473.09**. Both assets posted modest but positive 24‑hour changes—BTC up **+1.10%** and ETH up **+1.78%**—while trading volumes remained robust at roughly **9.5 billion** for Bitcoin and **2.0 billion** for Ethereum. These figures, sourced from CoinGecko, suggest that market participants are maintaining interest in the core crypto assets despite a relatively quiet day for alt‑coin movers (the top‑gainers, losers, and topMovers lists were empty at the time of the snapshot).
Several factors may be contributing to this steady performance. First, macro‑economic data released over the past week indicated a cooling of inflation pressures in major economies, which has historically reduced risk‑off sentiment and allowed speculative assets like cryptocurrencies to regain footing. Second, on‑chain metrics show that Bitcoin’s hash rate has remained near all‑time highs, signaling continued miner confidence and network security. Ethereum, meanwhile, benefited from the latest upgrade to its layer‑2 scaling ecosystem, which lowered transaction costs on several popular roll‑ups and spurred a modest uptick in decentralized finance (DeFi) activity.
Volume levels also provide insight into market health. The 9.5 billion BTC 24‑hour volume represents about 37% of its current market cap, indicating active trading rather than stagnant holding. Ethereum’s 2 billion volume corresponds to roughly 48% of its market cap, reflecting a slightly higher turnover ratio—common for ETH given its broader use in smart‑contract platforms and NFT marketplaces.
While the price moves are positive, it is important to view them within the broader context. Crypto markets remain volatile, and single‑day percentage changes can be influenced by large orders, news events, or shifts in futures positioning. Traders should continue to monitor key indicators such as the Bitcoin Fear & Greed Index, Ethereum gas prices, and macro‑economic releases (e.g., U.S. employment data, central bank statements) to gauge whether the current momentum is likely to persist or reverse.
In summary, the early September 2026 snapshot shows Bitcoin and Ethereum edging higher on solid volume, supported by improving macro conditions and ongoing network developments. As always, staying informed and employing sound risk management practices remain essential for anyone navigating the crypto landscape.
#pons #crypto #trending #CoinGecko
1


See translation
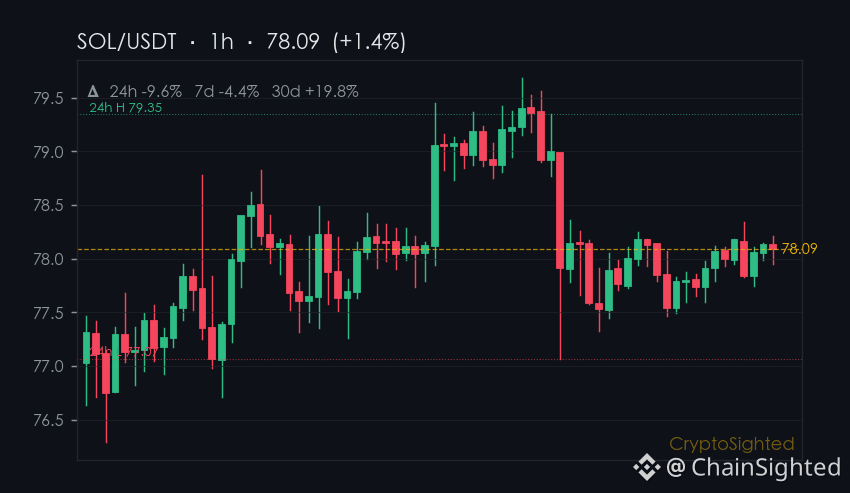
"Solana’s 24-hour move is ↓1.6% - that’s the number that caught my eye."
It’s the kind of quiet decline that doesn’t scream, but sits there, waiting.
Over the past 30 days, $SOL has climbed 16.7%, but today’s drop feels like a pause - or a test.
The 7-day trend is down 4.4%, which adds a layer of tension.
It’s not a crash, but it’s not a clear breakout either.
Will Solana’s 30-day momentum withstand today’s 1.28% drop, or is this a warning sign for the broader altcoin complex?
—
Not financial advice. DYOR.
📌 Hotspot Watch · #126 · #CryptoTrends #CryptoSighted $SOL
"Solana’s 24-hour move is ↓1.6% - that’s the number that caught my eye."
It’s the kind of quiet decline that doesn’t scream, but sits there, waiting.
Over the past 30 days, $SOL has climbed 16.7%, but today’s drop feels like a pause - or a test.
The 7-day trend is down 4.4%, which adds a layer of tension.
It’s not a crash, but it’s not a clear breakout either.
Will Solana’s 30-day momentum withstand today’s 1.28% drop, or is this a warning sign for the broader altcoin complex?
—
Not financial advice. DYOR.
📌 Hotspot Watch · #126 · #CryptoTrends #CryptoSighted $SOL
It’s the kind of quiet decline that doesn’t scream, but sits there, waiting.
Over the past 30 days, $SOL has climbed 16.7%, but today’s drop feels like a pause - or a test.
The 7-day trend is down 4.4%, which adds a layer of tension.
It’s not a crash, but it’s not a clear breakout either.
Will Solana’s 30-day momentum withstand today’s 1.28% drop, or is this a warning sign for the broader altcoin complex?
—
Not financial advice. DYOR.
📌 Hotspot Watch · #126 · #CryptoTrends #CryptoSighted $SOL
20

·
--
Down 9.98% today, it looks like $DRV has started to pull back. But looking at the 30-day chart, I’d rather say this isn’t a crash—the market is starting to show signs of weakness. On September 20, when it surged to $0.44, trading volume was $228M. On October 10, when it climbed to $0.52, volume was less than half that—$104M. The price hit a new short-term high, but volume didn’t follow. After that, the price fell from $0.53 back to $0.37, while volume shrank from $104M to $12M today, and the volume-to-market-cap ratio dropped from 0.5 to 0.03.
The 7-day gain of 0.88% looks “steady,” but it’s really just a week’s price action flattened into a straight line. The 30-day gain of 168% pushed its market cap to #126—that’s a fact. But over the past five days, the price has seesawed between $0.37 and $0.50, with no second surge in volume and no decisive break below the range. At this stage, the market looks more like it’s testing the patience of late buyers near the highs than building momentum.
I actually think the claim that “a break below $0.37 would be the end” is too absolute. $0.37 is close to the late-September support range, and if volume picks up again, this level could redefine the direction. The real warning sign would be if the price keeps hovering around $0.38 over the next week while volume stays below $20M—that would make it highly likely this rally is a distribution pattern.
What kind of catalyst is most likely to overturn my view? If an unfulfilled narrative behind $DRV suddenly materializes, or liquidity across the market steps up, the price-volume divergence could disappear quickly. Would you wait for a high-volume breakout above $0.44 before entering, or avoid it for now and treat this as a distribution zone?
Down 9.98% today, it looks like $DRV has started to pull back. But looking at the 30-day chart, I’d rather say this isn’t a crash—the market is starting to show signs of weakness. On September 20, when it surged to $0.44, trading volume was $228M. On October 10, when it climbed to $0.52, volume was less than half that—$104M. The price hit a new short-term high, but volume didn’t follow. After that, the price fell from $0.53 back to $0.37, while volume shrank from $104M to $12M today, and the volume-to-market-cap ratio dropped from 0.5 to 0.03.
The 7-day gain of 0.88% looks “steady,” but it’s really just a week’s price action flattened into a straight line. The 30-day gain of 168% pushed its market cap to #126—that’s a fact. But over the past five days, the price has seesawed between $0.37 and $0.50, with no second surge in volume and no decisive break below the range. At this stage, the market looks more like it’s testing the patience of late buyers near the highs than building momentum.
I actually think the claim that “a break below $0.37 would be the end” is too absolute. $0.37 is close to the late-September support range, and if volume picks up again, this level could redefine the direction. The real warning sign would be if the price keeps hovering around $0.38 over the next week while volume stays below $20M—that would make it highly likely this rally is a distribution pattern.
What kind of catalyst is most likely to overturn my view? If an unfulfilled narrative behind $DRV suddenly materializes, or liquidity across the market steps up, the price-volume divergence could disappear quickly. Would you wait for a high-volume breakout above $0.44 before entering, or avoid it for now and treat this as a distribution zone?
The 7-day gain of 0.88% looks “steady,” but it’s really just a week’s price action flattened into a straight line. The 30-day gain of 168% pushed its market cap to #126—that’s a fact. But over the past five days, the price has seesawed between $0.37 and $0.50, with no second surge in volume and no decisive break below the range. At this stage, the market looks more like it’s testing the patience of late buyers near the highs than building momentum.
I actually think the claim that “a break below $0.37 would be the end” is too absolute. $0.37 is close to the late-September support range, and if volume picks up again, this level could redefine the direction. The real warning sign would be if the price keeps hovering around $0.38 over the next week while volume stays below $20M—that would make it highly likely this rally is a distribution pattern.
What kind of catalyst is most likely to overturn my view? If an unfulfilled narrative behind $DRV suddenly materializes, or liquidity across the market steps up, the price-volume divergence could disappear quickly. Would you wait for a high-volume breakout above $0.44 before entering, or avoid it for now and treat this as a distribution zone?
3

·
--
Contract Quant Brief #126|Strength is still ongoing; the high has already been pulled up to the top—I’m just waiting for a pullback to confirm
The chart still has that “continuation” feel: overall bullish, but several names on the list have already run far away from the moving averages. There are ones up 30% and 60% on the day—at this level, chasing after the mid-air move will make the win rate look pretty ugly. Funding/fees are still relatively quiet, which suggests it hasn’t become overcrowded and explosive yet, but that doesn’t mean you can blindly raise the deck.
My choice is clear: you can follow the trend, but chase entries are off. I’d rather wait for a clean pullback, then decide whether to take action.
BOME
Current price around 0.000842, up about 34% today; about +10% vs the 20MA; still nearly +10% over 6 hours, and slightly retracing in the last hour. Position (1h) around +15%, funding neutral.
For this coin, I’d rather wait for it to “mend the peak”—hard-catching in mid-air is pointless. After it pulls back and then lifts its head again, that’s when to look.
Observation zone: 0.00080–0.000825
Trigger: after pulling back into the range, it stops falling; then re-lifts in the short term, and volume/open interest does not collapse.
Invalidation: a decisive drop below 0.00078, or after the pullback it keeps failing to gain (repeatedly surging without strength) and the structure turns sour.
MUBARAK
Current price around 0.0255, up about 63% today; about +13% vs the 20MA; even farther from the 50MA. Trading is very active, but 1-hour open interest has jumped about +76%—it’s heavily overheated.
For this type of target, I’ll be more cautious: better to miss the first leg than to catch the hottest last kick.
Observation zone: 0.0230–0.0245
Trigger: after a pullback, it stabilizes; volatility compresses; then upward confirmation appears again.
Invalidation: breaks below 0.0220, or during the pullback the price/volume clearly deteriorates.
I’ll first see whether it can digest the extension; if it can’t digest it, I’ll simply give up.
Alternate to watch: TST’s score is also high, but the position is similarly elevated and the near-term is more aggressive—so I won’t chase; I’ll only treat it as a backup look after a retracement.
Risk warning: high-level pullbacks can happen very quickly; when contract volatility expands, stop-losses must be clean. The above is only for quantitative screening and chart observation, not investment advice. Strictly control position size; if an invalidation is hit, admit the mistake immediately.
One sentence: In a bullish/strong market, I only trade confirmation—I don’t act on impulse.
Contract Quant Brief #126|Strength is still ongoing; the high has already been pulled up to the top—I’m just waiting for a pullback to confirm
The chart still has that “continuation” feel: overall bullish, but several names on the list have already run far away from the moving averages. There are ones up 30% and 60% on the day—at this level, chasing after the mid-air move will make the win rate look pretty ugly. Funding/fees are still relatively quiet, which suggests it hasn’t become overcrowded and explosive yet, but that doesn’t mean you can blindly raise the deck.
My choice is clear: you can follow the trend, but chase entries are off. I’d rather wait for a clean pullback, then decide whether to take action.
BOME
Current price around 0.000842, up about 34% today; about +10% vs the 20MA; still nearly +10% over 6 hours, and slightly retracing in the last hour. Position (1h) around +15%, funding neutral.
For this coin, I’d rather wait for it to “mend the peak”—hard-catching in mid-air is pointless. After it pulls back and then lifts its head again, that’s when to look.
Observation zone: 0.00080–0.000825
Trigger: after pulling back into the range, it stops falling; then re-lifts in the short term, and volume/open interest does not collapse.
Invalidation: a decisive drop below 0.00078, or after the pullback it keeps failing to gain (repeatedly surging without strength) and the structure turns sour.
MUBARAK
Current price around 0.0255, up about 63% today; about +13% vs the 20MA; even farther from the 50MA. Trading is very active, but 1-hour open interest has jumped about +76%—it’s heavily overheated.
For this type of target, I’ll be more cautious: better to miss the first leg than to catch the hottest last kick.
Observation zone: 0.0230–0.0245
Trigger: after a pullback, it stabilizes; volatility compresses; then upward confirmation appears again.
Invalidation: breaks below 0.0220, or during the pullback the price/volume clearly deteriorates.
I’ll first see whether it can digest the extension; if it can’t digest it, I’ll simply give up.
Alternate to watch: TST’s score is also high, but the position is similarly elevated and the near-term is more aggressive—so I won’t chase; I’ll only treat it as a backup look after a retracement.
Risk warning: high-level pullbacks can happen very quickly; when contract volatility expands, stop-losses must be clean. The above is only for quantitative screening and chart observation, not investment advice. Strictly control position size; if an invalidation is hit, admit the mistake immediately.
One sentence: In a bullish/strong market, I only trade confirmation—I don’t act on impulse.
The chart still has that “continuation” feel: overall bullish, but several names on the list have already run far away from the moving averages. There are ones up 30% and 60% on the day—at this level, chasing after the mid-air move will make the win rate look pretty ugly. Funding/fees are still relatively quiet, which suggests it hasn’t become overcrowded and explosive yet, but that doesn’t mean you can blindly raise the deck.
My choice is clear: you can follow the trend, but chase entries are off. I’d rather wait for a clean pullback, then decide whether to take action.
BOME
Current price around 0.000842, up about 34% today; about +10% vs the 20MA; still nearly +10% over 6 hours, and slightly retracing in the last hour. Position (1h) around +15%, funding neutral.
For this coin, I’d rather wait for it to “mend the peak”—hard-catching in mid-air is pointless. After it pulls back and then lifts its head again, that’s when to look.
Observation zone: 0.00080–0.000825
Trigger: after pulling back into the range, it stops falling; then re-lifts in the short term, and volume/open interest does not collapse.
Invalidation: a decisive drop below 0.00078, or after the pullback it keeps failing to gain (repeatedly surging without strength) and the structure turns sour.
MUBARAK
Current price around 0.0255, up about 63% today; about +13% vs the 20MA; even farther from the 50MA. Trading is very active, but 1-hour open interest has jumped about +76%—it’s heavily overheated.
For this type of target, I’ll be more cautious: better to miss the first leg than to catch the hottest last kick.
Observation zone: 0.0230–0.0245
Trigger: after a pullback, it stabilizes; volatility compresses; then upward confirmation appears again.
Invalidation: breaks below 0.0220, or during the pullback the price/volume clearly deteriorates.
I’ll first see whether it can digest the extension; if it can’t digest it, I’ll simply give up.
Alternate to watch: TST’s score is also high, but the position is similarly elevated and the near-term is more aggressive—so I won’t chase; I’ll only treat it as a backup look after a retracement.
Risk warning: high-level pullbacks can happen very quickly; when contract volatility expands, stop-losses must be clean. The above is only for quantitative screening and chart observation, not investment advice. Strictly control position size; if an invalidation is hit, admit the mistake immediately.
One sentence: In a bullish/strong market, I only trade confirmation—I don’t act on impulse.
544
See translation
1.7% - that’s the daily price drop masking a much stronger story.
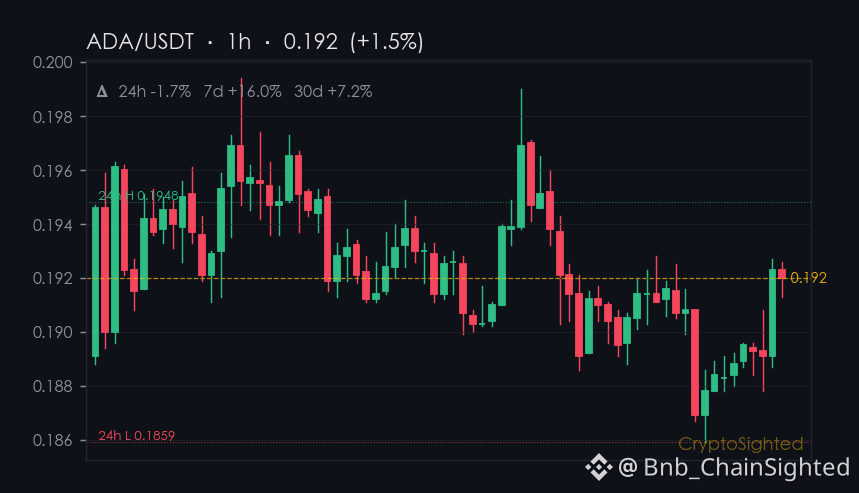
$ADA’s current price sits near $0.192, down 1.7% on the day, but that’s not the full story.
Over the past week, ADA has climbed 16.0%, and in the last 30 days, it’s been up 7.2%.
That’s a move that’s been building, even as the spot market has dipped slightly.
What’s more interesting is how that plays out against the broader market.
While most of the top gainers on the 24-hour list are small-cap or speculative assets, ADA is sitting in the mid-tier - not a flash in the pan, but not a market leader either.
It’s quietly moving higher, even as the price action suggests a short-term pullback.
The real question is: who’s paying for that rally?
—
Not financial advice. DYOR.
📌 Funding Pulse · #126 · #FundingRate #CryptoSighted $ADA
1.7% - that’s the daily price drop masking a much stronger story.
$ADA ’s current price sits near $0.192, down 1.7% on the day, but that’s not the full story.
Over the past week, ADA has climbed 16.0%, and in the last 30 days, it’s been up 7.2%.
That’s a move that’s been building, even as the spot market has dipped slightly.
What’s more interesting is how that plays out against the broader market.
While most of the top gainers on the 24-hour list are small-cap or speculative assets, ADA is sitting in the mid-tier - not a flash in the pan, but not a market leader either.
It’s quietly moving higher, even as the price action suggests a short-term pullback.
The real question is: who’s paying for that rally?
—
Not financial advice. DYOR.
📌 Funding Pulse · #126 · #FundingRate #CryptoSighted $ADA
$ADA ’s current price sits near $0.192, down 1.7% on the day, but that’s not the full story.
Over the past week, ADA has climbed 16.0%, and in the last 30 days, it’s been up 7.2%.
That’s a move that’s been building, even as the spot market has dipped slightly.
What’s more interesting is how that plays out against the broader market.
While most of the top gainers on the 24-hour list are small-cap or speculative assets, ADA is sitting in the mid-tier - not a flash in the pan, but not a market leader either.
It’s quietly moving higher, even as the price action suggests a short-term pullback.
The real question is: who’s paying for that rally?
—
Not financial advice. DYOR.
📌 Funding Pulse · #126 · #FundingRate #CryptoSighted $ADA
121

·
--
US Surged 9.6% in 15 Minutes! What Happened? Key Levels Here13:17 (21 minutes ago) — The US saw a 9.6% surge within 15 minutes (15-minute window 13:02→13:17). As of 13:39:30, the current price is 0.02105, 24h -28.6%. Other tokens with simultaneous movement in the same batch include SOON and NIL.
📅 Data as of 13:39:30 (event trigger time is noted on each item; prices are live snapshots at the time of writing)
📌 One-sentence takeaway: The 15-minute trend is amplified—decide in advance where your stop-loss should be before the trend unfolds.
Market Overview: BTC 83,418.00 (+0.49%) · ETH 2,677.10 (+0.67%); Across the whole market, 422 up / 72 down in the last 24h; Top gainer in the last 24h: MOVR +51.34%, biggest laggard: US -28.61%.
US Surged 9.6% in 15 Minutes! What Happened? Key Levels Here
13:17 (21 minutes ago) — The US saw a 9.6% surge within 15 minutes (15-minute window 13:02→13:17). As of 13:39:30, the current price is 0.02105, 24h -28.6%. Other tokens with simultaneous movement in the same batch include SOON and NIL.
📅 Data as of 13:39:30 (event trigger time is noted on each item; prices are live snapshots at the time of writing)
📌 One-sentence takeaway: The 15-minute trend is amplified—decide in advance where your stop-loss should be before the trend unfolds.
Market Overview: BTC 83,418.00 (+0.49%) · ETH 2,677.10 (+0.67%); Across the whole market, 422 up / 72 down in the last 24h; Top gainer in the last 24h: MOVR +51.34%, biggest laggard: US -28.61%.
📅 Data as of 13:39:30 (event trigger time is noted on each item; prices are live snapshots at the time of writing)
📌 One-sentence takeaway: The 15-minute trend is amplified—decide in advance where your stop-loss should be before the trend unfolds.
Market Overview: BTC 83,418.00 (+0.49%) · ETH 2,677.10 (+0.67%); Across the whole market, 422 up / 72 down in the last 24h; Top gainer in the last 24h: MOVR +51.34%, biggest laggard: US -28.61%.
1
·
--
$PRL 24 hours -2.24%, put into 7 days +2.50% it’s almost like trading sideways; if we use a ruler to stretch to 30 days, +297.59% immediately turns this pullback into noise. The time-scale mismatch is the signal that should be addressed right now: this isn’t just starting up—it’s high-level digestion after a sharp pull-up.
Over 30 days, from $0.318 to $1.53, then back to $1.23—still -29.99% away from the ATH of $1.76. Market cap $407M, rank #126. 24h volume is only $3.86M, turnover under 1%. The volume during the run-up could push above $5M, but it’s clearly shrinking now. My take: the float is waiting for a new narrative or liquidity, not for mindless continuation higher. If $1.20 doesn’t break, and volume can return above $5M, the swing structure is still intact; if it breaks below $1.20 on increased volume, near-term we first look around $1.05 for support, then talk about the ATH.
So, are you looking from a short-term or swing-trading perspective right now? Short-term: watch $1.20 support and $1.29 resistance; swing-trading: after 30 days +297%, are you waiting for a pullback confirmation, or a breakout above the $1.53 prior high?
$PRL 24 hours -2.24%, put into 7 days +2.50% it’s almost like trading sideways; if we use a ruler to stretch to 30 days, +297.59% immediately turns this pullback into noise. The time-scale mismatch is the signal that should be addressed right now: this isn’t just starting up—it’s high-level digestion after a sharp pull-up.
Over 30 days, from $0.318 to $1.53, then back to $1.23—still -29.99% away from the ATH of $1.76. Market cap $407M, rank #126. 24h volume is only $3.86M, turnover under 1%. The volume during the run-up could push above $5M, but it’s clearly shrinking now. My take: the float is waiting for a new narrative or liquidity, not for mindless continuation higher. If $1.20 doesn’t break, and volume can return above $5M, the swing structure is still intact; if it breaks below $1.20 on increased volume, near-term we first look around $1.05 for support, then talk about the ATH.
So, are you looking from a short-term or swing-trading perspective right now? Short-term: watch $1.20 support and $1.29 resistance; swing-trading: after 30 days +297%, are you waiting for a pullback confirmation, or a breakout above the $1.53 prior high?
Over 30 days, from $0.318 to $1.53, then back to $1.23—still -29.99% away from the ATH of $1.76. Market cap $407M, rank #126. 24h volume is only $3.86M, turnover under 1%. The volume during the run-up could push above $5M, but it’s clearly shrinking now. My take: the float is waiting for a new narrative or liquidity, not for mindless continuation higher. If $1.20 doesn’t break, and volume can return above $5M, the swing structure is still intact; if it breaks below $1.20 on increased volume, near-term we first look around $1.05 for support, then talk about the ATH.
So, are you looking from a short-term or swing-trading perspective right now? Short-term: watch $1.20 support and $1.29 resistance; swing-trading: after 30 days +297%, are you waiting for a pullback confirmation, or a breakout above the $1.53 prior high?
5
·
--
Watch out! CYS surged 1.7% at a key time—where can you buy the pullback?At 16:09 (10 minutes ago), CYS surged 1.7% at a key time (5-minute window: 16:04→16:09). As of 16:20:39, the current price is 0.1333, down 3.6% over 24h. Other assets showing unusual moves in the same batch include EIGEN and NEAR.
📅 Data as of 16:20:39 (see each item for the event trigger time; prices are real-time snapshots taken when this was written)
📌 In a nutshell: Unusual moves during key periods (such as candlestick closes and U.S. market opens/closes) often involve institutional participation, making these signals more reliable.
Market overview: BTC 83,802.00 (-0.18%) · ETH 2,517.27 (-0.52%); across the market, 152 assets rose and 334 fell in 24h; top 24h gainer: TRUTH +49.76%, top loser: W -15.19%.
Watch out! CYS surged 1.7% at a key time—where can you buy the pullback?
At 16:09 (10 minutes ago), CYS surged 1.7% at a key time (5-minute window: 16:04→16:09). As of 16:20:39, the current price is 0.1333, down 3.6% over 24h. Other assets showing unusual moves in the same batch include EIGEN and NEAR.
📅 Data as of 16:20:39 (see each item for the event trigger time; prices are real-time snapshots taken when this was written)
📌 In a nutshell: Unusual moves during key periods (such as candlestick closes and U.S. market opens/closes) often involve institutional participation, making these signals more reliable.
Market overview: BTC 83,802.00 (-0.18%) · ETH 2,517.27 (-0.52%); across the market, 152 assets rose and 334 fell in 24h; top 24h gainer: TRUTH +49.76%, top loser: W -15.19%.
📅 Data as of 16:20:39 (see each item for the event trigger time; prices are real-time snapshots taken when this was written)
📌 In a nutshell: Unusual moves during key periods (such as candlestick closes and U.S. market opens/closes) often involve institutional participation, making these signals more reliable.
Market overview: BTC 83,802.00 (-0.18%) · ETH 2,517.27 (-0.52%); across the market, 152 assets rose and 334 fell in 24h; top 24h gainer: TRUTH +49.76%, top loser: W -15.19%.
21
Log in to explore more content
Join global crypto users on Binance Square
⚡️ Get latest and useful information about crypto.
💬 Trusted by the world’s largest crypto exchange.
👍 Discover real insights from verified creators.
Email / Phone number
Trending Topics
1
#NvidiaEarningsTonight:AIStocks’NextMove?
41,927 views
694 Discussing
2
#A Packed Week of Earnings and Data Tests Markets
113,998 views
575 Discussing
3
#AnthropicIPOTestsInvestorAppetiteForAI
246,307 views
2,426 Discussing
4
#NvidiaBoardNotConsideringHuang’sReturnasCEO
62,685 views
660 Discussing
5
#KOSPIFalls2.59%ToLowestCloseSinceFebruary
4,494 views
100 Discussing
6
#AnthropicClearedToListOnNasdaqAsANT
7,168 views
110 Discussing
7
#WhatInvestmentSignalsDo13FFilingsReveal?
36,931 views
505 Discussing
8
#TetherCapitalMakesStrategicInvestmentInStables
365 views
16 Discussing
9
#EvernorthRecords$505MImpairmentOnPreListingXRP
874 views
15 Discussing
10
#GoldmanSachsReports$1.22BInEtherETFHoldings
677 views
13 Discussing