

#024
024
53 views
4 Discussing
Hot
Latest

·
--
【Structure Watch #024 | ETH 4H】Triangle is tightening, price grinding along the lower half
Recap from the last update: ETH was at 2,385 at 08:01 yesterday, within the 2,337–2,439 range marked then. It still hasn’t touched either boundary.
At 08:01, price was 2,385, down 0.04% over 24 hours, with trading volume of 5.876 billion U. The intraday high was 2,417 and the low was 2,351.
① Structure: Highs have been moving lower and lows higher over the last 30 candles, forming a converging triangle. The range is 2,337–2,512, or 7.5% wide. Price is only at the 28th percentile, in the lower half of the range. The MA25 is at 2,423, above price; its slope over the last 5 candles is -0.11%, flattening out with a slight downward bias.
② Volume and price: Volume over the last 10 candles is 0.81 times that of the preceding 30, close to earlier levels with no significant increase. Of the last 10 candles, 4 closed up. There haven’t been many bullish candles, yet price hasn’t fallen either—it’s grinding along in a compressed range.
③ Confluence: Overhead, the 2,404–2,410 area has the 0.618 Fib level at 2,404 overlapping with the previous high at 2,410, with both pointing in the same direction. Below, 2,309–2,337 is supported by just one source, so confidence should be discounted. Keep this level in mind, but don’t treat it as set in stone.
④ Funding and positioning: Funding is +0.0016%, so longs are paying. Open interest has changed by -0.82% over 7 4H candles, essentially flat. The long/short account ratio is 3.18. Funding and the account ratio lean bullish, but open interest hasn’t followed, suggesting that new positions haven’t really come in.
Areas to watch: 2,404–2,433 above; 2,309–2,337 below.
1H view: Price has ranged between 2,351 and 2,417 over the last 12 hours. The latest close is at the 52nd percentile, right in the middle, leaving room in either direction.
Invalidation: This outlook is invalidated if a 4H candle closes above 2,433 or below 2,309.
The two levels overhead, 2,404 and 2,410, are very close together. I’m watching whether price can close above the 2,404 Fib level; you may have yours drawn around 2,410.
This is a structural analysis based on public data, not a recommendation to trade. You are responsible for your own gains and losses.
$ETH
#技术分析 #合约交易 #Bitcoin
【Structure Watch #024 | ETH 4H】Triangle is tightening, price grinding along the lower half
Recap from the last update: ETH was at 2,385 at 08:01 yesterday, within the 2,337–2,439 range marked then. It still hasn’t touched either boundary.
At 08:01, price was 2,385, down 0.04% over 24 hours, with trading volume of 5.876 billion U. The intraday high was 2,417 and the low was 2,351.
① Structure: Highs have been moving lower and lows higher over the last 30 candles, forming a converging triangle. The range is 2,337–2,512, or 7.5% wide. Price is only at the 28th percentile, in the lower half of the range. The MA25 is at 2,423, above price; its slope over the last 5 candles is -0.11%, flattening out with a slight downward bias.
② Volume and price: Volume over the last 10 candles is 0.81 times that of the preceding 30, close to earlier levels with no significant increase. Of the last 10 candles, 4 closed up. There haven’t been many bullish candles, yet price hasn’t fallen either—it’s grinding along in a compressed range.
③ Confluence: Overhead, the 2,404–2,410 area has the 0.618 Fib level at 2,404 overlapping with the previous high at 2,410, with both pointing in the same direction. Below, 2,309–2,337 is supported by just one source, so confidence should be discounted. Keep this level in mind, but don’t treat it as set in stone.
④ Funding and positioning: Funding is +0.0016%, so longs are paying. Open interest has changed by -0.82% over 7 4H candles, essentially flat. The long/short account ratio is 3.18. Funding and the account ratio lean bullish, but open interest hasn’t followed, suggesting that new positions haven’t really come in.
Areas to watch: 2,404–2,433 above; 2,309–2,337 below.
1H view: Price has ranged between 2,351 and 2,417 over the last 12 hours. The latest close is at the 52nd percentile, right in the middle, leaving room in either direction.
Invalidation: This outlook is invalidated if a 4H candle closes above 2,433 or below 2,309.
The two levels overhead, 2,404 and 2,410, are very close together. I’m watching whether price can close above the 2,404 Fib level; you may have yours drawn around 2,410.
This is a structural analysis based on public data, not a recommendation to trade. You are responsible for your own gains and losses.
$ETH
#技术分析 #合约交易 #Bitcoin
Recap from the last update: ETH was at 2,385 at 08:01 yesterday, within the 2,337–2,439 range marked then. It still hasn’t touched either boundary.
At 08:01, price was 2,385, down 0.04% over 24 hours, with trading volume of 5.876 billion U. The intraday high was 2,417 and the low was 2,351.
① Structure: Highs have been moving lower and lows higher over the last 30 candles, forming a converging triangle. The range is 2,337–2,512, or 7.5% wide. Price is only at the 28th percentile, in the lower half of the range. The MA25 is at 2,423, above price; its slope over the last 5 candles is -0.11%, flattening out with a slight downward bias.
② Volume and price: Volume over the last 10 candles is 0.81 times that of the preceding 30, close to earlier levels with no significant increase. Of the last 10 candles, 4 closed up. There haven’t been many bullish candles, yet price hasn’t fallen either—it’s grinding along in a compressed range.
③ Confluence: Overhead, the 2,404–2,410 area has the 0.618 Fib level at 2,404 overlapping with the previous high at 2,410, with both pointing in the same direction. Below, 2,309–2,337 is supported by just one source, so confidence should be discounted. Keep this level in mind, but don’t treat it as set in stone.
④ Funding and positioning: Funding is +0.0016%, so longs are paying. Open interest has changed by -0.82% over 7 4H candles, essentially flat. The long/short account ratio is 3.18. Funding and the account ratio lean bullish, but open interest hasn’t followed, suggesting that new positions haven’t really come in.
Areas to watch: 2,404–2,433 above; 2,309–2,337 below.
1H view: Price has ranged between 2,351 and 2,417 over the last 12 hours. The latest close is at the 52nd percentile, right in the middle, leaving room in either direction.
Invalidation: This outlook is invalidated if a 4H candle closes above 2,433 or below 2,309.
The two levels overhead, 2,404 and 2,410, are very close together. I’m watching whether price can close above the 2,404 Fib level; you may have yours drawn around 2,410.
This is a structural analysis based on public data, not a recommendation to trade. You are responsible for your own gains and losses.
$ETH
#技术分析 #合约交易 #Bitcoin
47

·
--
Bullish
See translation
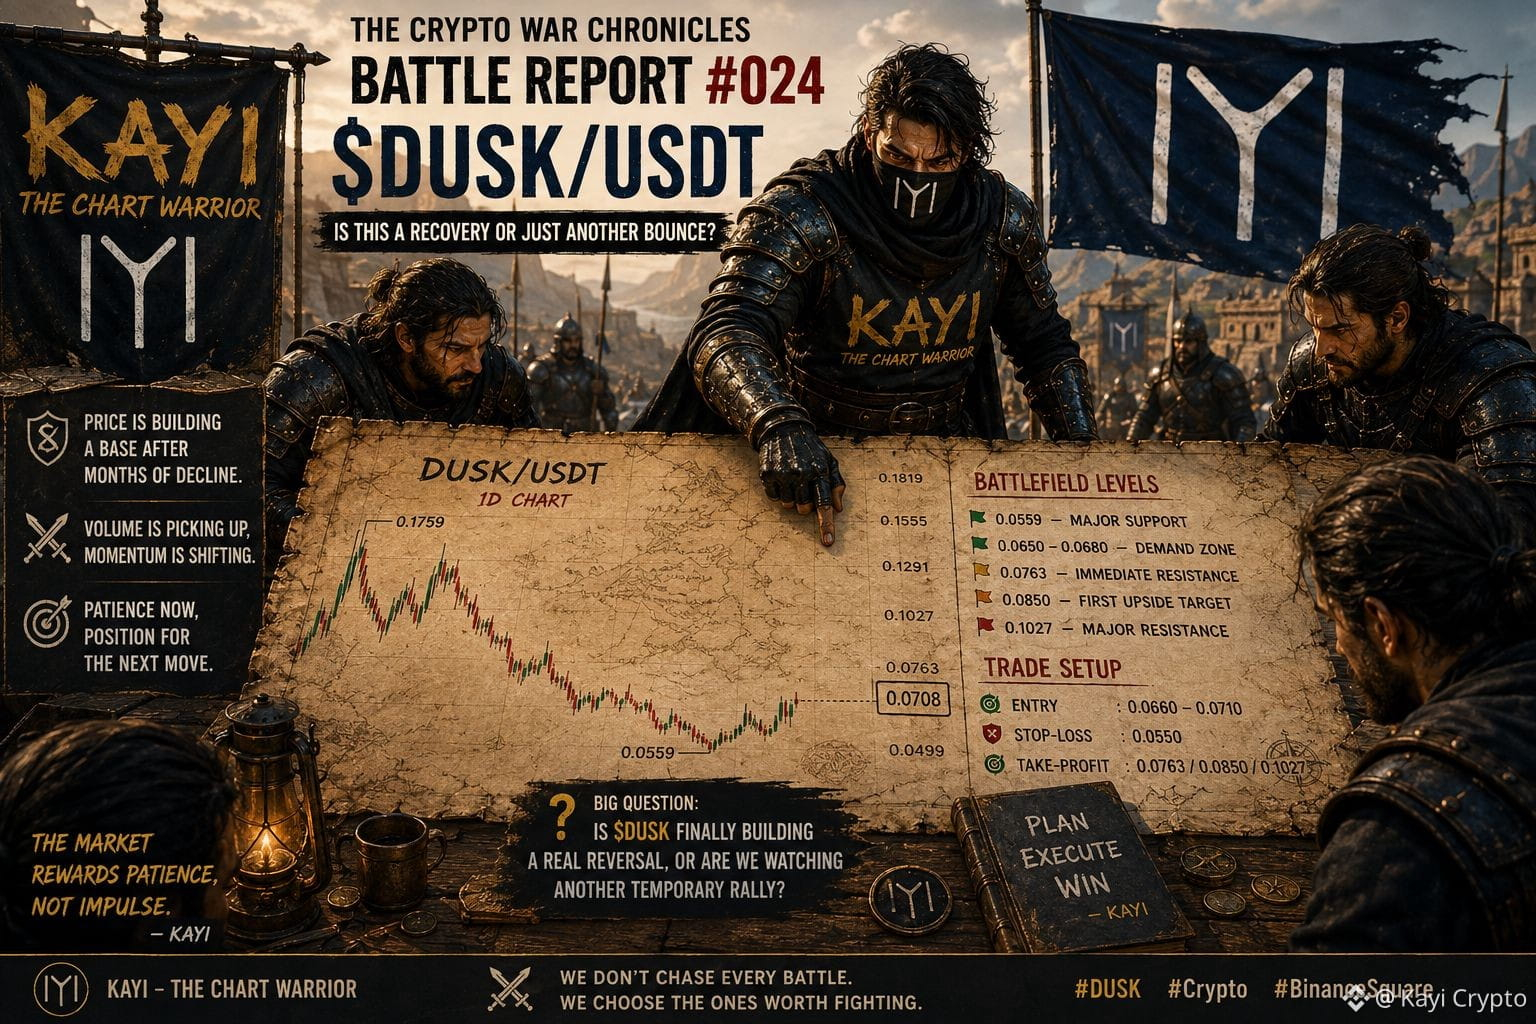
⚔️ THE CRYPTO WAR CHRONICLES — BATTLE REPORT #024 — $DUSK
{future}(DUSKUSDT)
is starting to look interesting again — but the real question is whether this is a recovery or just another bounce before the sellers return.
I’ve been watching DUSK for a while, and what catches my attention now is the change in momentum. Price has been bleeding for months, but after touching around $0.0559, the chart finally started building a base. Now we’re back around $0.0708, with volume picking up and MACD showing improving momentum. That doesn’t mean the war is won — it means the battlefield is finally becoming interesting.The mistake I don’t want to make here is chasing a green candle. A strong move needs confirmation, and for DUSK that confirmation would be a clean break and hold above the $0.0763 resistance area.
Battlefield Levels
$0.0559 — Major support / recent bottom
$0.0650–$0.0680 — Current demand zone
$0.0763 — Immediate resistance
$0.0850 — First upside target zone
$0.1027 — Major resistance / bigger breakout zone
🎯 Trade Setup
Entry: $0.0660–$0.0710
Stop-Loss: $0.0550
Take-Profit: $0.0763 / $0.0850 / $0.1027
I’m not saying DUSK will reach those targets. I’m saying this is the area where I want to watch the reaction instead of blindly predicting the future. If price breaks $0.0763 with convincing volume, the whole structure becomes much more interesting. If it loses the $0.0559 area, the recovery thesis gets seriously weakened.
Question: Is $DUSK finally building a real reversal, or are we watching another temporary rally?
I’ll be watching the battlefield. Will you? 🫡
KAYI — THE CHART WARRIOR
THE MARKET REWARDS PATIENCE, NOT IMPULSE.
$DUSK #kayiCrypto #BinanceSquare
⚔️ THE CRYPTO WAR CHRONICLES — BATTLE REPORT #024 — $DUSK
is starting to look interesting again — but the real question is whether this is a recovery or just another bounce before the sellers return.
I’ve been watching DUSK for a while, and what catches my attention now is the change in momentum. Price has been bleeding for months, but after touching around $0.0559, the chart finally started building a base. Now we’re back around $0.0708, with volume picking up and MACD showing improving momentum. That doesn’t mean the war is won — it means the battlefield is finally becoming interesting.The mistake I don’t want to make here is chasing a green candle. A strong move needs confirmation, and for DUSK that confirmation would be a clean break and hold above the $0.0763 resistance area.
Battlefield Levels
$0.0559 — Major support / recent bottom
$0.0650–$0.0680 — Current demand zone
$0.0763 — Immediate resistance
$0.0850 — First upside target zone
$0.1027 — Major resistance / bigger breakout zone
🎯 Trade Setup
Entry: $0.0660–$0.0710
Stop-Loss: $0.0550
Take-Profit: $0.0763 / $0.0850 / $0.1027
I’m not saying DUSK will reach those targets. I’m saying this is the area where I want to watch the reaction instead of blindly predicting the future. If price breaks $0.0763 with convincing volume, the whole structure becomes much more interesting. If it loses the $0.0559 area, the recovery thesis gets seriously weakened.
Question: Is $DUSK finally building a real reversal, or are we watching another temporary rally?
I’ll be watching the battlefield. Will you? 🫡
KAYI — THE CHART WARRIOR
THE MARKET REWARDS PATIENCE, NOT IMPULSE.
$DUSK #kayiCrypto #BinanceSquare
is starting to look interesting again — but the real question is whether this is a recovery or just another bounce before the sellers return.
I’ve been watching DUSK for a while, and what catches my attention now is the change in momentum. Price has been bleeding for months, but after touching around $0.0559, the chart finally started building a base. Now we’re back around $0.0708, with volume picking up and MACD showing improving momentum. That doesn’t mean the war is won — it means the battlefield is finally becoming interesting.The mistake I don’t want to make here is chasing a green candle. A strong move needs confirmation, and for DUSK that confirmation would be a clean break and hold above the $0.0763 resistance area.
Battlefield Levels
$0.0559 — Major support / recent bottom
$0.0650–$0.0680 — Current demand zone
$0.0763 — Immediate resistance
$0.0850 — First upside target zone
$0.1027 — Major resistance / bigger breakout zone
🎯 Trade Setup
Entry: $0.0660–$0.0710
Stop-Loss: $0.0550
Take-Profit: $0.0763 / $0.0850 / $0.1027
I’m not saying DUSK will reach those targets. I’m saying this is the area where I want to watch the reaction instead of blindly predicting the future. If price breaks $0.0763 with convincing volume, the whole structure becomes much more interesting. If it loses the $0.0559 area, the recovery thesis gets seriously weakened.
Question: Is $DUSK finally building a real reversal, or are we watching another temporary rally?
I’ll be watching the battlefield. Will you? 🫡
KAYI — THE CHART WARRIOR
THE MARKET REWARDS PATIENCE, NOT IMPULSE.
$DUSK #kayiCrypto #BinanceSquare
1
71

·
--
Trading Journal #024
Today I only make one decision: BTC is quoted at 78019.93000000. The lively noise on the screen pushes people forward, yet I get an unusual thought: the more I want to chase immediately, the more I should first write down the part that involves waiting.
Daily price: BTC 78019.93000000
My choice: wait. The trigger condition is that tomorrow, at a fixed time, I will see BTC form a clear breakout—only then will I end the waiting. Before that condition appears, I won’t change direction just because the narrative suddenly gets heated, and I won’t temporarily switch topics because some other coin moves faster.
The most common mistake today is misreading “everyone else is talking about it” as “I already understand it.” The gain rankings and trending headlines slice attention into tiny pieces. Your eyes switch quickly, but the reasons don’t land anywhere concrete. Since BTC is holding at this recorded price, I can’t rely on a single number to say it will go up, and I can’t, just because there’s no obvious drop at the moment, casually add a conclusion that it’s rising. I’ll leave this blank for now.
Waiting needs boundaries. Today I keep only one question: at tomorrow’s fixed time, can BTC provide a clearer breakout signal than the current record? If no signal appears, I can’t use the new excitement to fill in the answer. If a signal does appear, today’s waiting also reaches its point for confirmation. Choosing to move a bit slower has a cost: you might miss a stretch of suddenly accelerated volatility. That cost is visible—at least it’s easier to review than changing your mind on the spot when emotions are at their highest.
I treat the urge to chase as only an emotion, and I leave action to conditions that can be checked repeatedly. The former only shows that the screen is noisy; the latter shows that the judgment has boundaries. What’s missing now isn’t more coin names, and it’s not a bolder prediction—it’s whether tomorrow morning can let me review today using the same standard. The fewer standards there are, the less likely the record is to be carried away by new voices.
Sometimes waiting makes people feel like they’ve done nothing. But what I’m actually doing is removing an impulsive option: not turning my judgment into a conclusion early just because others are talking loudly. This BTC number currently only represents today’s record, and it doesn’t automatically indicate tomorrow’s direction. The direction is left for the next check.
Next-day review: tomorrow at 09:30, I only check whether BTC breaks above 78019.93000000; once it breaks out, today’s waiting judgment becomes invalid.
Trading Journal #024
Today I only make one decision: BTC is quoted at 78019.93000000. The lively noise on the screen pushes people forward, yet I get an unusual thought: the more I want to chase immediately, the more I should first write down the part that involves waiting.
Daily price: BTC 78019.93000000
My choice: wait. The trigger condition is that tomorrow, at a fixed time, I will see BTC form a clear breakout—only then will I end the waiting. Before that condition appears, I won’t change direction just because the narrative suddenly gets heated, and I won’t temporarily switch topics because some other coin moves faster.
The most common mistake today is misreading “everyone else is talking about it” as “I already understand it.” The gain rankings and trending headlines slice attention into tiny pieces. Your eyes switch quickly, but the reasons don’t land anywhere concrete. Since BTC is holding at this recorded price, I can’t rely on a single number to say it will go up, and I can’t, just because there’s no obvious drop at the moment, casually add a conclusion that it’s rising. I’ll leave this blank for now.
Waiting needs boundaries. Today I keep only one question: at tomorrow’s fixed time, can BTC provide a clearer breakout signal than the current record? If no signal appears, I can’t use the new excitement to fill in the answer. If a signal does appear, today’s waiting also reaches its point for confirmation. Choosing to move a bit slower has a cost: you might miss a stretch of suddenly accelerated volatility. That cost is visible—at least it’s easier to review than changing your mind on the spot when emotions are at their highest.
I treat the urge to chase as only an emotion, and I leave action to conditions that can be checked repeatedly. The former only shows that the screen is noisy; the latter shows that the judgment has boundaries. What’s missing now isn’t more coin names, and it’s not a bolder prediction—it’s whether tomorrow morning can let me review today using the same standard. The fewer standards there are, the less likely the record is to be carried away by new voices.
Sometimes waiting makes people feel like they’ve done nothing. But what I’m actually doing is removing an impulsive option: not turning my judgment into a conclusion early just because others are talking loudly. This BTC number currently only represents today’s record, and it doesn’t automatically indicate tomorrow’s direction. The direction is left for the next check.
Next-day review: tomorrow at 09:30, I only check whether BTC breaks above 78019.93000000; once it breaks out, today’s waiting judgment becomes invalid.
Today I only make one decision: BTC is quoted at 78019.93000000. The lively noise on the screen pushes people forward, yet I get an unusual thought: the more I want to chase immediately, the more I should first write down the part that involves waiting.
Daily price: BTC 78019.93000000
My choice: wait. The trigger condition is that tomorrow, at a fixed time, I will see BTC form a clear breakout—only then will I end the waiting. Before that condition appears, I won’t change direction just because the narrative suddenly gets heated, and I won’t temporarily switch topics because some other coin moves faster.
The most common mistake today is misreading “everyone else is talking about it” as “I already understand it.” The gain rankings and trending headlines slice attention into tiny pieces. Your eyes switch quickly, but the reasons don’t land anywhere concrete. Since BTC is holding at this recorded price, I can’t rely on a single number to say it will go up, and I can’t, just because there’s no obvious drop at the moment, casually add a conclusion that it’s rising. I’ll leave this blank for now.
Waiting needs boundaries. Today I keep only one question: at tomorrow’s fixed time, can BTC provide a clearer breakout signal than the current record? If no signal appears, I can’t use the new excitement to fill in the answer. If a signal does appear, today’s waiting also reaches its point for confirmation. Choosing to move a bit slower has a cost: you might miss a stretch of suddenly accelerated volatility. That cost is visible—at least it’s easier to review than changing your mind on the spot when emotions are at their highest.
I treat the urge to chase as only an emotion, and I leave action to conditions that can be checked repeatedly. The former only shows that the screen is noisy; the latter shows that the judgment has boundaries. What’s missing now isn’t more coin names, and it’s not a bolder prediction—it’s whether tomorrow morning can let me review today using the same standard. The fewer standards there are, the less likely the record is to be carried away by new voices.
Sometimes waiting makes people feel like they’ve done nothing. But what I’m actually doing is removing an impulsive option: not turning my judgment into a conclusion early just because others are talking loudly. This BTC number currently only represents today’s record, and it doesn’t automatically indicate tomorrow’s direction. The direction is left for the next check.
Next-day review: tomorrow at 09:30, I only check whether BTC breaks above 78019.93000000; once it breaks out, today’s waiting judgment becomes invalid.
111
Log in to explore more content
Join global crypto users on Binance Square
⚡️ Get latest and useful information about crypto.
💬 Trusted by the world’s largest crypto exchange.
👍 Discover real insights from verified creators.
Email / Phone number
Trending Topics
1
#BinanceRestores28FiatWithdrawals
0 views
0 Discussing
2
#BinanceProcesses$4.65BWithdrawals
57,978 views
251 Discussing
3
#BitcoinDropsBelow$78K
0 views
20 Discussing
4
#WithdrawalsBack: 15 networks live
13,320 views
183 Discussing
5
#EthereumSurpasses$2300
2,893 views
58 Discussing
6
#BitcoinSpotETFsPost$203MWeeklyOutflow
3,570 views
36 Discussing
7
#SouthKoreanLawmakerProposesReviewOfAllListedDigitalAssets
1,443 views
40 Discussing
8
#SolanaMobileRemovesMaliciousSKRClaimApp
0 views
0 Discussing
9
#BrazilVirtualAssetLicenseDeadlineDrawsAbout40Firms
24,364 views
446 Discussing
10
#BTCPayServerUrgesOperatorsToShutDownInstances
18,934 views
362 Discussing