
Crypto4light
5.7k Posts

Crypto4light
 Square Verified+
Report
Block User
Find everywhere - @Crypto4light 🔥 | Daily trading ideas | My custom indicators analysis | Educational content | Crypto News |

Level 1 Creator
Open Trade
Frequent Trader
5.9 Years
0 Following
68.4K+ Followers
40.4K+ Liked
1 Badges
Posts
Portfolio
All
Quotes
Videos
Live
PINNED
·
--

Article
See translation
The best indicators set for tradingCrypto4light Indicators Set
I spent a lot of time with backtesting and coding to create this set. 6 indicators which can cut all noise on your charts and bring more light in your trading strategy.🐳 Trade ON indicator
➡️ Buy/Sell The signal appears when you can open a position for buying or selling. Stop Loss can be set according to your risk management. Entry into the position can be at the appearance of the Buy/Sell signal and the closing of the candle. Stop Loss by the body or wick of this candle. Another entry option is to wait for the closing of 40-50% of the body of the candle on which you saw the Buy/Sell signal. Stop Loss by the body or wick of the candle on which you saw the Buy/Sell signal. On example you can see 35% profit on spot, 4H timeframe trade. Sometimes you can see signal just blinking, so wait until signal confirmed or try go to lower timeframe to see confirmation for entry by your risk management and strategy.
➡️ Red or Green triangles
Once a Buy/Sell signal appears and you enter a position, you have several options. It all depends on your trading style and risk management.
The first option - If, for example, you entered on the Buy signal, you can close the purchase at the appearance of the Take Profit signal, or at the appearance of the Sell signal, and open a position in another direction.The second option, after opening a position when triangles appear, this is a signal to close a certain percentage of the position in the plus. With each new triangle, you can close % of your position and move the Stop Loss to breakeven.The third option, after opening a position at the appearance of triangles, closing a full position and looking for a possible option to open a position in the other direction, closing the position after the triangles should take place at the appearance of the main Buy/Sell signal.
➡️ Take Profit
➡️ Two identical signals in a row
🐳 Direction indicator
Circles will appear from above or below. The circles will signal that the main market makers are starting to reduce or gain their position. Big players always need liquidity, so they can build or reduce a position for quite a long time. Round dots are not the main signal for tradingA red or green triangle signals a final change in the local or global trend, depending on your timeframe. Market Makers or players with large positions have exited the market, or conversely gained enough position to change the direction of price movement.The green and red solid lines are the levels where the trend is most likely to end
The green and red dashed lines are the levels where the big players are more likely to start gradually selling off or gaining a position to change the trend before the momentum. In the style settings, you can change the input positions of each of the lines, for yourself or for a specific asset. But the settings are already set in the most optimal way.
🐳 ADZ (Accumulation/Distribution Zones)
The red solid zone shows the zone where the big players will complete the sale of their position.The solid green area shows where the big players will accumulate their positions.The middle blue zone shows where medium and small players start to accumulate or sell off their positions.The yellow zone inside the blue zone shows a trend change and this means that most likely the big players have already gained a position to start selling or gaining it depending on the timeframe in which you are trading.
🐳 Take Profit indicator
The first lower "Buy" line, when the price drops to this line is a good point to enter a position or gradually build a position.The bottom green line "Fundamental price" is the real value of the asset. Sometimes when the media background about the asset is negative and buyers are not interested in the asset, the price can fall below its fundamental price. Then this is the best time to buy the asset.The first upper Take Profit line is a line where you can lock part of the profit or close the entire position. There is a possibility of opening a short position if you trade on the futures market
The very top Exit line is the line where you need to close 100% of the trade position. If you are an investor, you do not need to close the entire position and exit the asset, because all lines are dynamic and change depending on the cycle in which the asset is located.
🐳 Market Mood Indicator
On different timeframes, you can view the mood that is currently present in the market. Trend, euphoria, position selection, or lack of interest.
Red and orange color - fear and overbought in the market
Green - Accumulation and purchases on the market
Yellow - Gradual set of position
White - purchases and lack of interest from small investors
Blue - Neutral mood in the market
I rename color zones so you can turn on alerts and easier understand notifications. Some colors got 2 alerts because of gradation based on input data, so you can choose any. You should understand on downtrend for example orange zone can be still be a belief sentiment because traders belief price will not drop.
Dark red - Euphoria
Light red - Thrill
Orange (light and dark) - Belief / Strong Belief
Yellow - Optimism
Green - Hope
Light blue - Disbelief
Dark blue - Capitulation
White - Depression
🐳 Money Power Indicator
When the asset reaches one of the zones, it can serve as a good signal to close a part of the position or to start a gradual acquisition of the position according to your trading timeframe.
An almost ideal signal for deciding whether to enter or exit a position would be a divergence on the price chart and the curve on the Money Power indicator. If you are in a long position, for example, and you see that the price on the chart continues to rise, but in the overbought zone, the lines of the Money Power indicator show lower highs, this is a signal that a large player has almost completely sold out his position on this timeframe.
Of course, the price may continue to grow for some time depending on the timeframe, but such indicators usually indicate the outflow of money from large investors and small players will not be able to keep the asset from falling for a long time. Everything is the same but in a different direction in the oversold zone. When a big player gradually gains a position and we see that the money flow curve goes up, and the price on the chart and candles show lower minimums. This will be a great signal to enter a position. You can enter or close a position by analyzing older timeframes W, 3D 1D depending on your trading style.
In new version you also can find a new signals (explanation with default colors, but you can modify it to your theme)
Yellow block - Whales sell or close % of position
Yellow block with arrow down - Whales strong sell
Blue block - Whales buy
Blue block with arrow up - Whales strong buy
Triangle down - Bearish RSI divergency
Triangle Up - Bullish RSI divergency
Red Circle - Bearish MACD divergency
Green Circle - Bullish MACD divergency
I am not a financial advisor. All indicators created with my own personal experience. Do NOT trade or invest based only on indicators. Always do your own research and due diligence before investing.
All indicators can be used on different timeframes. The higher timeframe, the stronger signal. Your entry or exit point should be base on several indicators from the set, your trading strategy and your risk management. Indicators cannot predict or analyze future events in the world, the release of data in economic reports, statements in the media by public figures, so always follow your risk management when you open trades.
☑️ Always follow risk management and this set of indicators will help you. I wish you successful trading.
#trading #crypto
The best indicators set for trading
Crypto4light Indicators Set
I spent a lot of time with backtesting and coding to create this set. 6 indicators which can cut all noise on your charts and bring more light in your trading strategy.🐳 Trade ON indicator
➡️ Buy/Sell The signal appears when you can open a position for buying or selling. Stop Loss can be set according to your risk management. Entry into the position can be at the appearance of the Buy/Sell signal and the closing of the candle. Stop Loss by the body or wick of this candle. Another entry option is to wait for the closing of 40-50% of the body of the candle on which you saw the Buy/Sell signal. Stop Loss by the body or wick of the candle on which you saw the Buy/Sell signal. On example you can see 35% profit on spot, 4H timeframe trade. Sometimes you can see signal just blinking, so wait until signal confirmed or try go to lower timeframe to see confirmation for entry by your risk management and strategy.
➡️ Red or Green triangles
Once a Buy/Sell signal appears and you enter a position, you have several options. It all depends on your trading style and risk management.
The first option - If, for example, you entered on the Buy signal, you can close the purchase at the appearance of the Take Profit signal, or at the appearance of the Sell signal, and open a position in another direction.The second option, after opening a position when triangles appear, this is a signal to close a certain percentage of the position in the plus. With each new triangle, you can close % of your position and move the Stop Loss to breakeven.The third option, after opening a position at the appearance of triangles, closing a full position and looking for a possible option to open a position in the other direction, closing the position after the triangles should take place at the appearance of the main Buy/Sell signal.
➡️ Take Profit
➡️ Two identical signals in a row
🐳 Direction indicator
Circles will appear from above or below. The circles will signal that the main market makers are starting to reduce or gain their position. Big players always need liquidity, so they can build or reduce a position for quite a long time. Round dots are not the main signal for tradingA red or green triangle signals a final change in the local or global trend, depending on your timeframe. Market Makers or players with large positions have exited the market, or conversely gained enough position to change the direction of price movement.The green and red solid lines are the levels where the trend is most likely to end
The green and red dashed lines are the levels where the big players are more likely to start gradually selling off or gaining a position to change the trend before the momentum. In the style settings, you can change the input positions of each of the lines, for yourself or for a specific asset. But the settings are already set in the most optimal way.
🐳 ADZ (Accumulation/Distribution Zones)
The red solid zone shows the zone where the big players will complete the sale of their position.The solid green area shows where the big players will accumulate their positions.The middle blue zone shows where medium and small players start to accumulate or sell off their positions.The yellow zone inside the blue zone shows a trend change and this means that most likely the big players have already gained a position to start selling or gaining it depending on the timeframe in which you are trading.
🐳 Take Profit indicator
The first lower "Buy" line, when the price drops to this line is a good point to enter a position or gradually build a position.The bottom green line "Fundamental price" is the real value of the asset. Sometimes when the media background about the asset is negative and buyers are not interested in the asset, the price can fall below its fundamental price. Then this is the best time to buy the asset.The first upper Take Profit line is a line where you can lock part of the profit or close the entire position. There is a possibility of opening a short position if you trade on the futures market
The very top Exit line is the line where you need to close 100% of the trade position. If you are an investor, you do not need to close the entire position and exit the asset, because all lines are dynamic and change depending on the cycle in which the asset is located.
🐳 Market Mood Indicator
On different timeframes, you can view the mood that is currently present in the market. Trend, euphoria, position selection, or lack of interest.
Red and orange color - fear and overbought in the market
Green - Accumulation and purchases on the market
Yellow - Gradual set of position
White - purchases and lack of interest from small investors
Blue - Neutral mood in the market
I rename color zones so you can turn on alerts and easier understand notifications. Some colors got 2 alerts because of gradation based on input data, so you can choose any. You should understand on downtrend for example orange zone can be still be a belief sentiment because traders belief price will not drop.
Dark red - Euphoria
Light red - Thrill
Orange (light and dark) - Belief / Strong Belief
Yellow - Optimism
Green - Hope
Light blue - Disbelief
Dark blue - Capitulation
White - Depression
🐳 Money Power Indicator
When the asset reaches one of the zones, it can serve as a good signal to close a part of the position or to start a gradual acquisition of the position according to your trading timeframe.
An almost ideal signal for deciding whether to enter or exit a position would be a divergence on the price chart and the curve on the Money Power indicator. If you are in a long position, for example, and you see that the price on the chart continues to rise, but in the overbought zone, the lines of the Money Power indicator show lower highs, this is a signal that a large player has almost completely sold out his position on this timeframe.
Of course, the price may continue to grow for some time depending on the timeframe, but such indicators usually indicate the outflow of money from large investors and small players will not be able to keep the asset from falling for a long time. Everything is the same but in a different direction in the oversold zone. When a big player gradually gains a position and we see that the money flow curve goes up, and the price on the chart and candles show lower minimums. This will be a great signal to enter a position. You can enter or close a position by analyzing older timeframes W, 3D 1D depending on your trading style.
In new version you also can find a new signals (explanation with default colors, but you can modify it to your theme)
Yellow block - Whales sell or close % of position
Yellow block with arrow down - Whales strong sell
Blue block - Whales buy
Blue block with arrow up - Whales strong buy
Triangle down - Bearish RSI divergency
Triangle Up - Bullish RSI divergency
Red Circle - Bearish MACD divergency
Green Circle - Bullish MACD divergency
I am not a financial advisor. All indicators created with my own personal experience. Do NOT trade or invest based only on indicators. Always do your own research and due diligence before investing.
All indicators can be used on different timeframes. The higher timeframe, the stronger signal. Your entry or exit point should be base on several indicators from the set, your trading strategy and your risk management. Indicators cannot predict or analyze future events in the world, the release of data in economic reports, statements in the media by public figures, so always follow your risk management when you open trades.
☑️ Always follow risk management and this set of indicators will help you. I wish you successful trading.
#trading #crypto
I spent a lot of time with backtesting and coding to create this set. 6 indicators which can cut all noise on your charts and bring more light in your trading strategy.🐳 Trade ON indicator
➡️ Buy/Sell The signal appears when you can open a position for buying or selling. Stop Loss can be set according to your risk management. Entry into the position can be at the appearance of the Buy/Sell signal and the closing of the candle. Stop Loss by the body or wick of this candle. Another entry option is to wait for the closing of 40-50% of the body of the candle on which you saw the Buy/Sell signal. Stop Loss by the body or wick of the candle on which you saw the Buy/Sell signal. On example you can see 35% profit on spot, 4H timeframe trade. Sometimes you can see signal just blinking, so wait until signal confirmed or try go to lower timeframe to see confirmation for entry by your risk management and strategy.
➡️ Red or Green triangles
Once a Buy/Sell signal appears and you enter a position, you have several options. It all depends on your trading style and risk management.
The first option - If, for example, you entered on the Buy signal, you can close the purchase at the appearance of the Take Profit signal, or at the appearance of the Sell signal, and open a position in another direction.The second option, after opening a position when triangles appear, this is a signal to close a certain percentage of the position in the plus. With each new triangle, you can close % of your position and move the Stop Loss to breakeven.The third option, after opening a position at the appearance of triangles, closing a full position and looking for a possible option to open a position in the other direction, closing the position after the triangles should take place at the appearance of the main Buy/Sell signal.
➡️ Take Profit
➡️ Two identical signals in a row
🐳 Direction indicator
Circles will appear from above or below. The circles will signal that the main market makers are starting to reduce or gain their position. Big players always need liquidity, so they can build or reduce a position for quite a long time. Round dots are not the main signal for tradingA red or green triangle signals a final change in the local or global trend, depending on your timeframe. Market Makers or players with large positions have exited the market, or conversely gained enough position to change the direction of price movement.The green and red solid lines are the levels where the trend is most likely to end
The green and red dashed lines are the levels where the big players are more likely to start gradually selling off or gaining a position to change the trend before the momentum. In the style settings, you can change the input positions of each of the lines, for yourself or for a specific asset. But the settings are already set in the most optimal way.
🐳 ADZ (Accumulation/Distribution Zones)
The red solid zone shows the zone where the big players will complete the sale of their position.The solid green area shows where the big players will accumulate their positions.The middle blue zone shows where medium and small players start to accumulate or sell off their positions.The yellow zone inside the blue zone shows a trend change and this means that most likely the big players have already gained a position to start selling or gaining it depending on the timeframe in which you are trading.
🐳 Take Profit indicator
The first lower "Buy" line, when the price drops to this line is a good point to enter a position or gradually build a position.The bottom green line "Fundamental price" is the real value of the asset. Sometimes when the media background about the asset is negative and buyers are not interested in the asset, the price can fall below its fundamental price. Then this is the best time to buy the asset.The first upper Take Profit line is a line where you can lock part of the profit or close the entire position. There is a possibility of opening a short position if you trade on the futures market
The very top Exit line is the line where you need to close 100% of the trade position. If you are an investor, you do not need to close the entire position and exit the asset, because all lines are dynamic and change depending on the cycle in which the asset is located.
🐳 Market Mood Indicator
On different timeframes, you can view the mood that is currently present in the market. Trend, euphoria, position selection, or lack of interest.
Red and orange color - fear and overbought in the market
Green - Accumulation and purchases on the market
Yellow - Gradual set of position
White - purchases and lack of interest from small investors
Blue - Neutral mood in the market
I rename color zones so you can turn on alerts and easier understand notifications. Some colors got 2 alerts because of gradation based on input data, so you can choose any. You should understand on downtrend for example orange zone can be still be a belief sentiment because traders belief price will not drop.
Dark red - Euphoria
Light red - Thrill
Orange (light and dark) - Belief / Strong Belief
Yellow - Optimism
Green - Hope
Light blue - Disbelief
Dark blue - Capitulation
White - Depression
🐳 Money Power Indicator
When the asset reaches one of the zones, it can serve as a good signal to close a part of the position or to start a gradual acquisition of the position according to your trading timeframe.
An almost ideal signal for deciding whether to enter or exit a position would be a divergence on the price chart and the curve on the Money Power indicator. If you are in a long position, for example, and you see that the price on the chart continues to rise, but in the overbought zone, the lines of the Money Power indicator show lower highs, this is a signal that a large player has almost completely sold out his position on this timeframe.
Of course, the price may continue to grow for some time depending on the timeframe, but such indicators usually indicate the outflow of money from large investors and small players will not be able to keep the asset from falling for a long time. Everything is the same but in a different direction in the oversold zone. When a big player gradually gains a position and we see that the money flow curve goes up, and the price on the chart and candles show lower minimums. This will be a great signal to enter a position. You can enter or close a position by analyzing older timeframes W, 3D 1D depending on your trading style.
In new version you also can find a new signals (explanation with default colors, but you can modify it to your theme)
Yellow block - Whales sell or close % of position
Yellow block with arrow down - Whales strong sell
Blue block - Whales buy
Blue block with arrow up - Whales strong buy
Triangle down - Bearish RSI divergency
Triangle Up - Bullish RSI divergency
Red Circle - Bearish MACD divergency
Green Circle - Bullish MACD divergency
I am not a financial advisor. All indicators created with my own personal experience. Do NOT trade or invest based only on indicators. Always do your own research and due diligence before investing.
All indicators can be used on different timeframes. The higher timeframe, the stronger signal. Your entry or exit point should be base on several indicators from the set, your trading strategy and your risk management. Indicators cannot predict or analyze future events in the world, the release of data in economic reports, statements in the media by public figures, so always follow your risk management when you open trades.
☑️ Always follow risk management and this set of indicators will help you. I wish you successful trading.
#trading #crypto
38
17
155
3.6k
·
--
See translation
{future}(BTCUSDT)
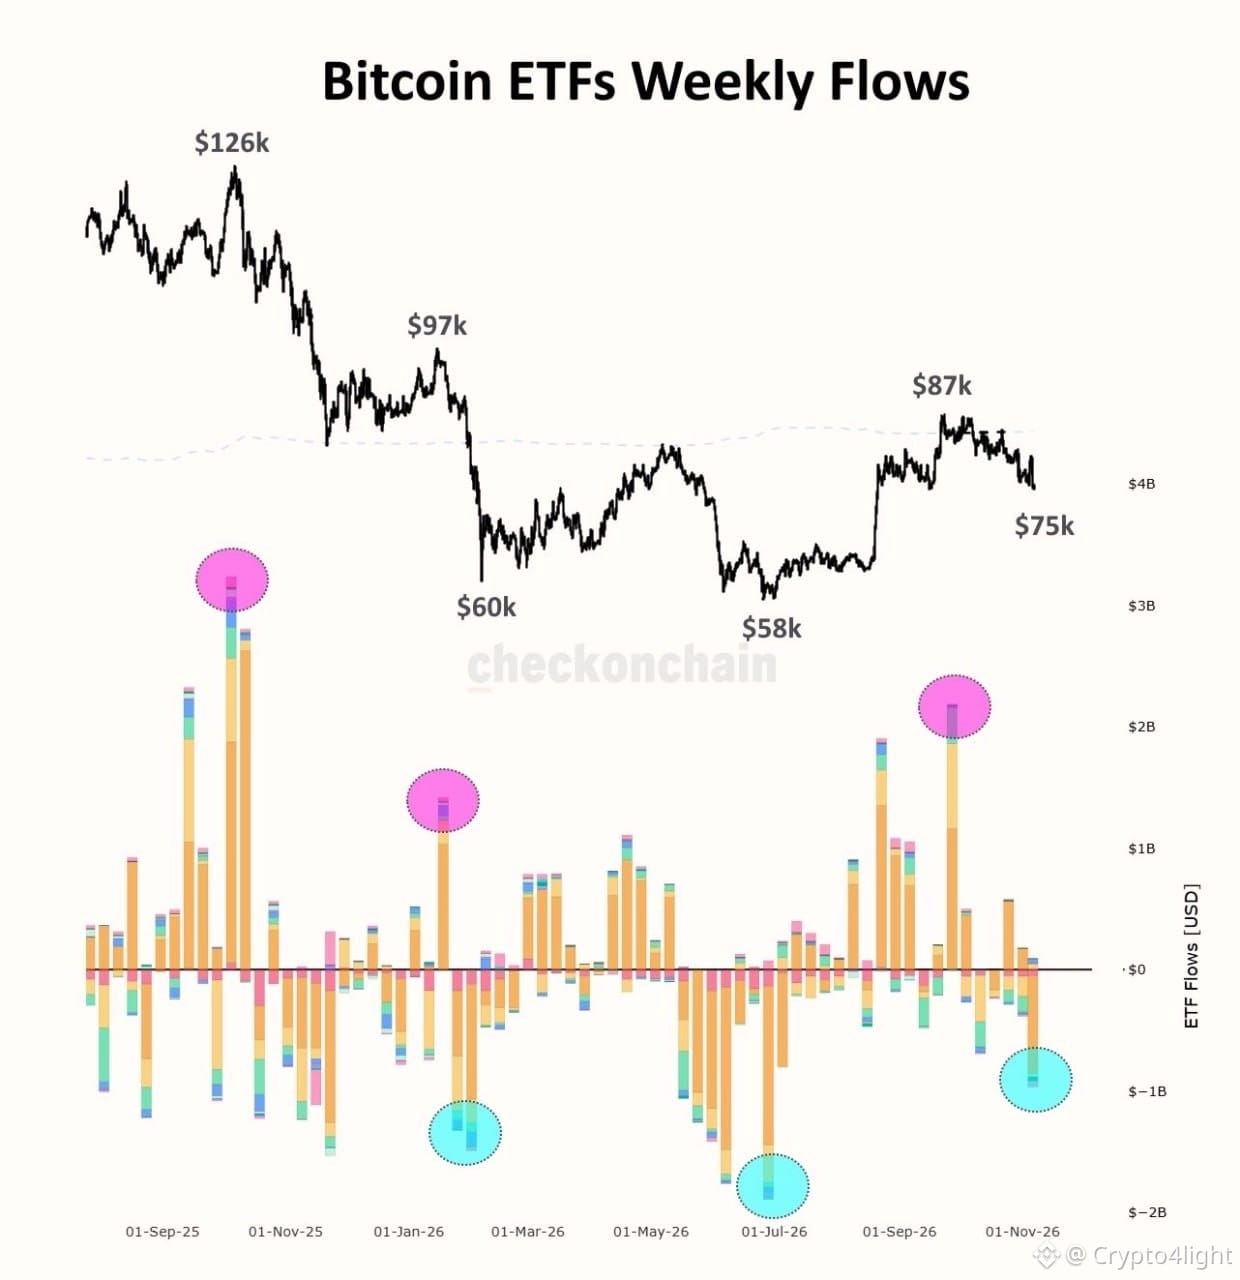
Interestingly, Bitcoin ETF investors behave exactly like retail traders! They keep buying at high prices, only to start aggressively selling whenever the market drops.
This is why all those videos about the technical side of becoming a successful trader overlook one of the most important factors: psychology! $BTC
Interestingly, Bitcoin ETF investors behave exactly like retail traders! They keep buying at high prices, only to start aggressively selling whenever the market drops.
This is why all those videos about the technical side of becoming a successful trader overlook one of the most important factors: psychology! $BTC
This is why all those videos about the technical side of becoming a successful trader overlook one of the most important factors: psychology! $BTC
2
460
·
--
See translation
Zilliqa Price Prediction. $ZIL Is Becoming an Ethereum Layer 2
Zilliqa Price Prediction. $ZIL Is Becoming an Ethereum Layer 2
3
582
·
--
See translation
$SOL Is at a CRITICAL Level! Watch What Happens After November 13! #solana
$SOL Is at a CRITICAL Level! Watch What Happens After November 13! #solana
340
·
--
See translation
$HBAR Price Prediction: Is This the Perfect Buying Opportunity? #hbar
$HBAR Price Prediction: Is This the Perfect Buying Opportunity? #hbar
4
1.3k
·
--
Bearish
See translation
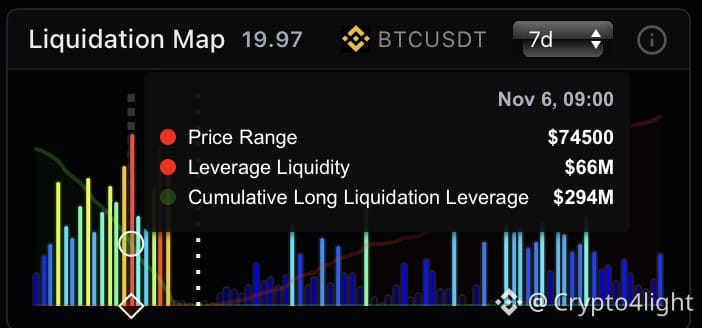
Liquidations are still piling up below! People keep trying to long every dip! Ideally, we could see a drop to the Inner Support line on the daily timeframe by November 13.$BTC #BTC
{future}(BTCUSDT)
Liquidations are still piling up below! People keep trying to long every dip! Ideally, we could see a drop to the Inner Support line on the daily timeframe by November 13.$BTC #BTC
599
·
--
See translation
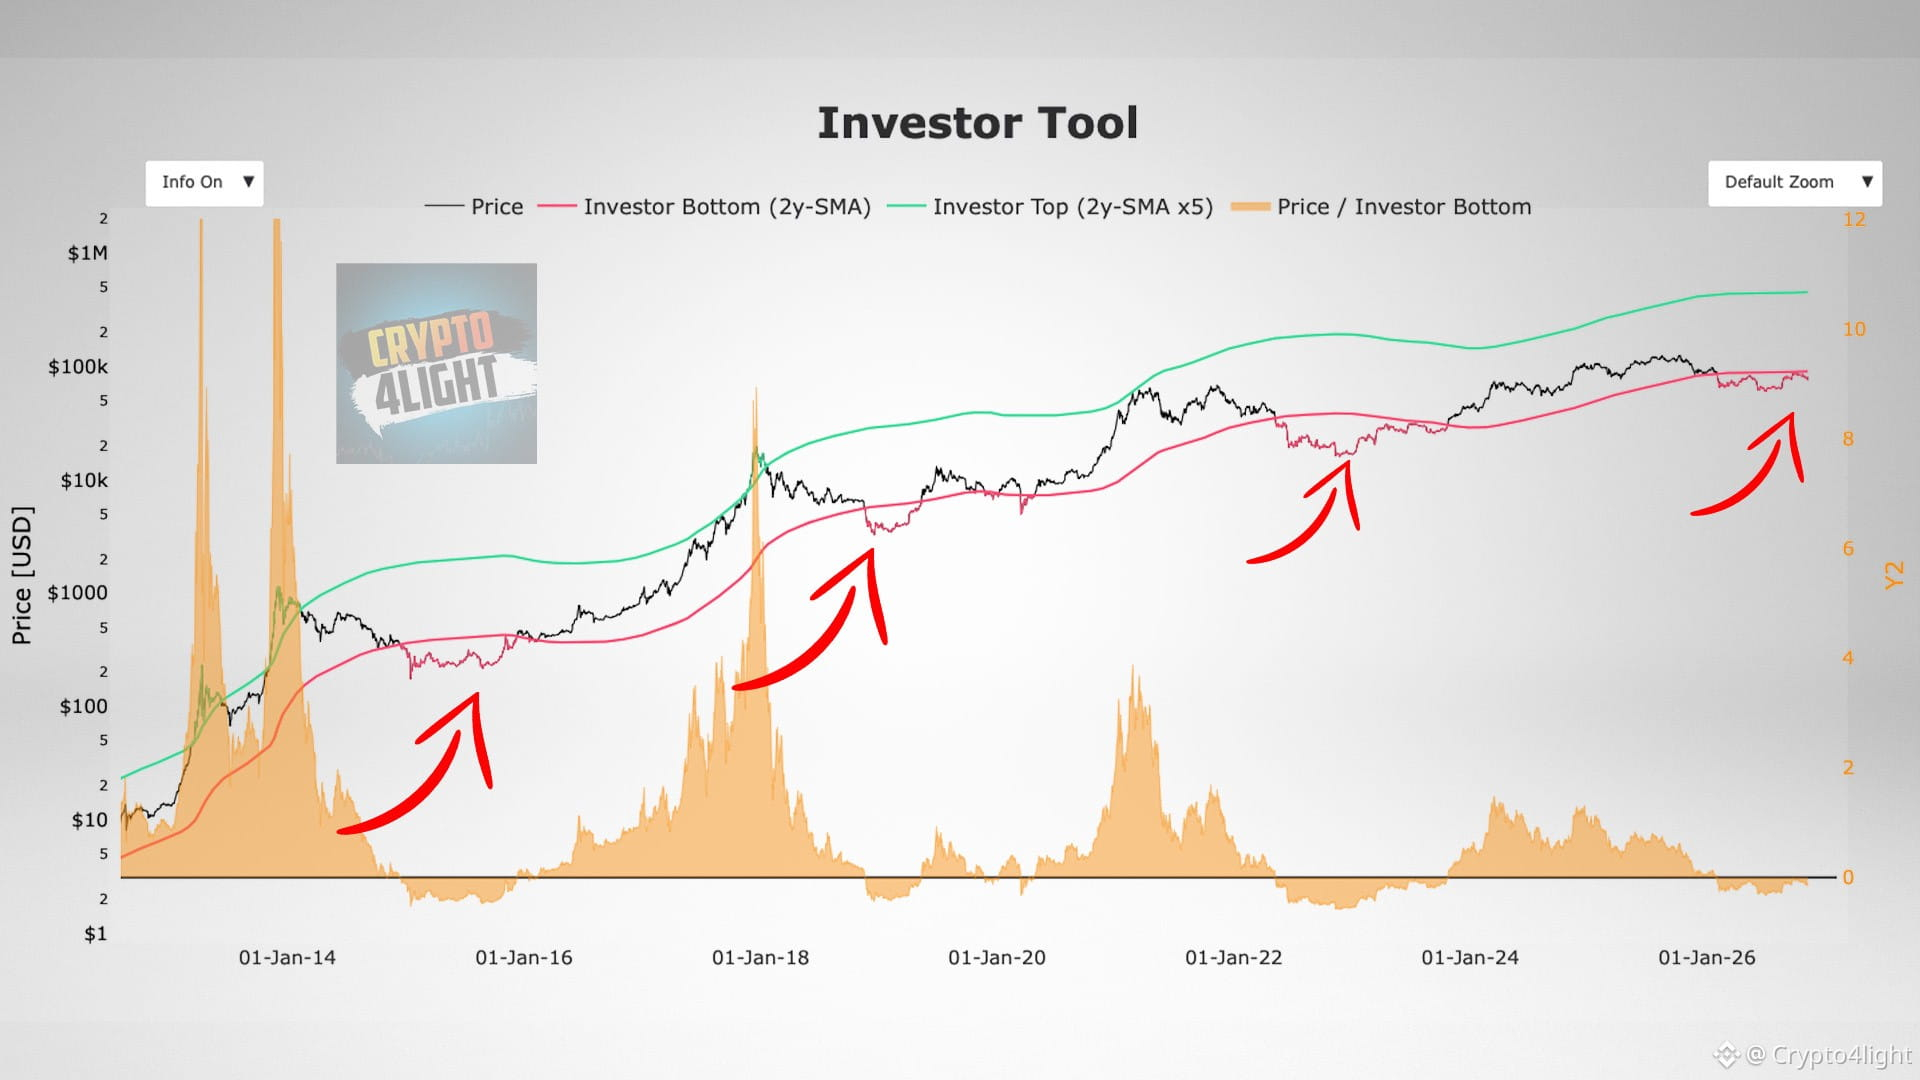
$BTC has historically found its footing at the 2-year moving average. 🪙
Since 2015, BTC has touched this level three times, and each time it was followed by a new all-time high. #BTC
$BTC has historically found its footing at the 2-year moving average. 🪙
Since 2015, BTC has touched this level three times, and each time it was followed by a new all-time high. #BTC
Since 2015, BTC has touched this level three times, and each time it was followed by a new all-time high. #BTC
3
1.6k
·
--
Bearish
See translation
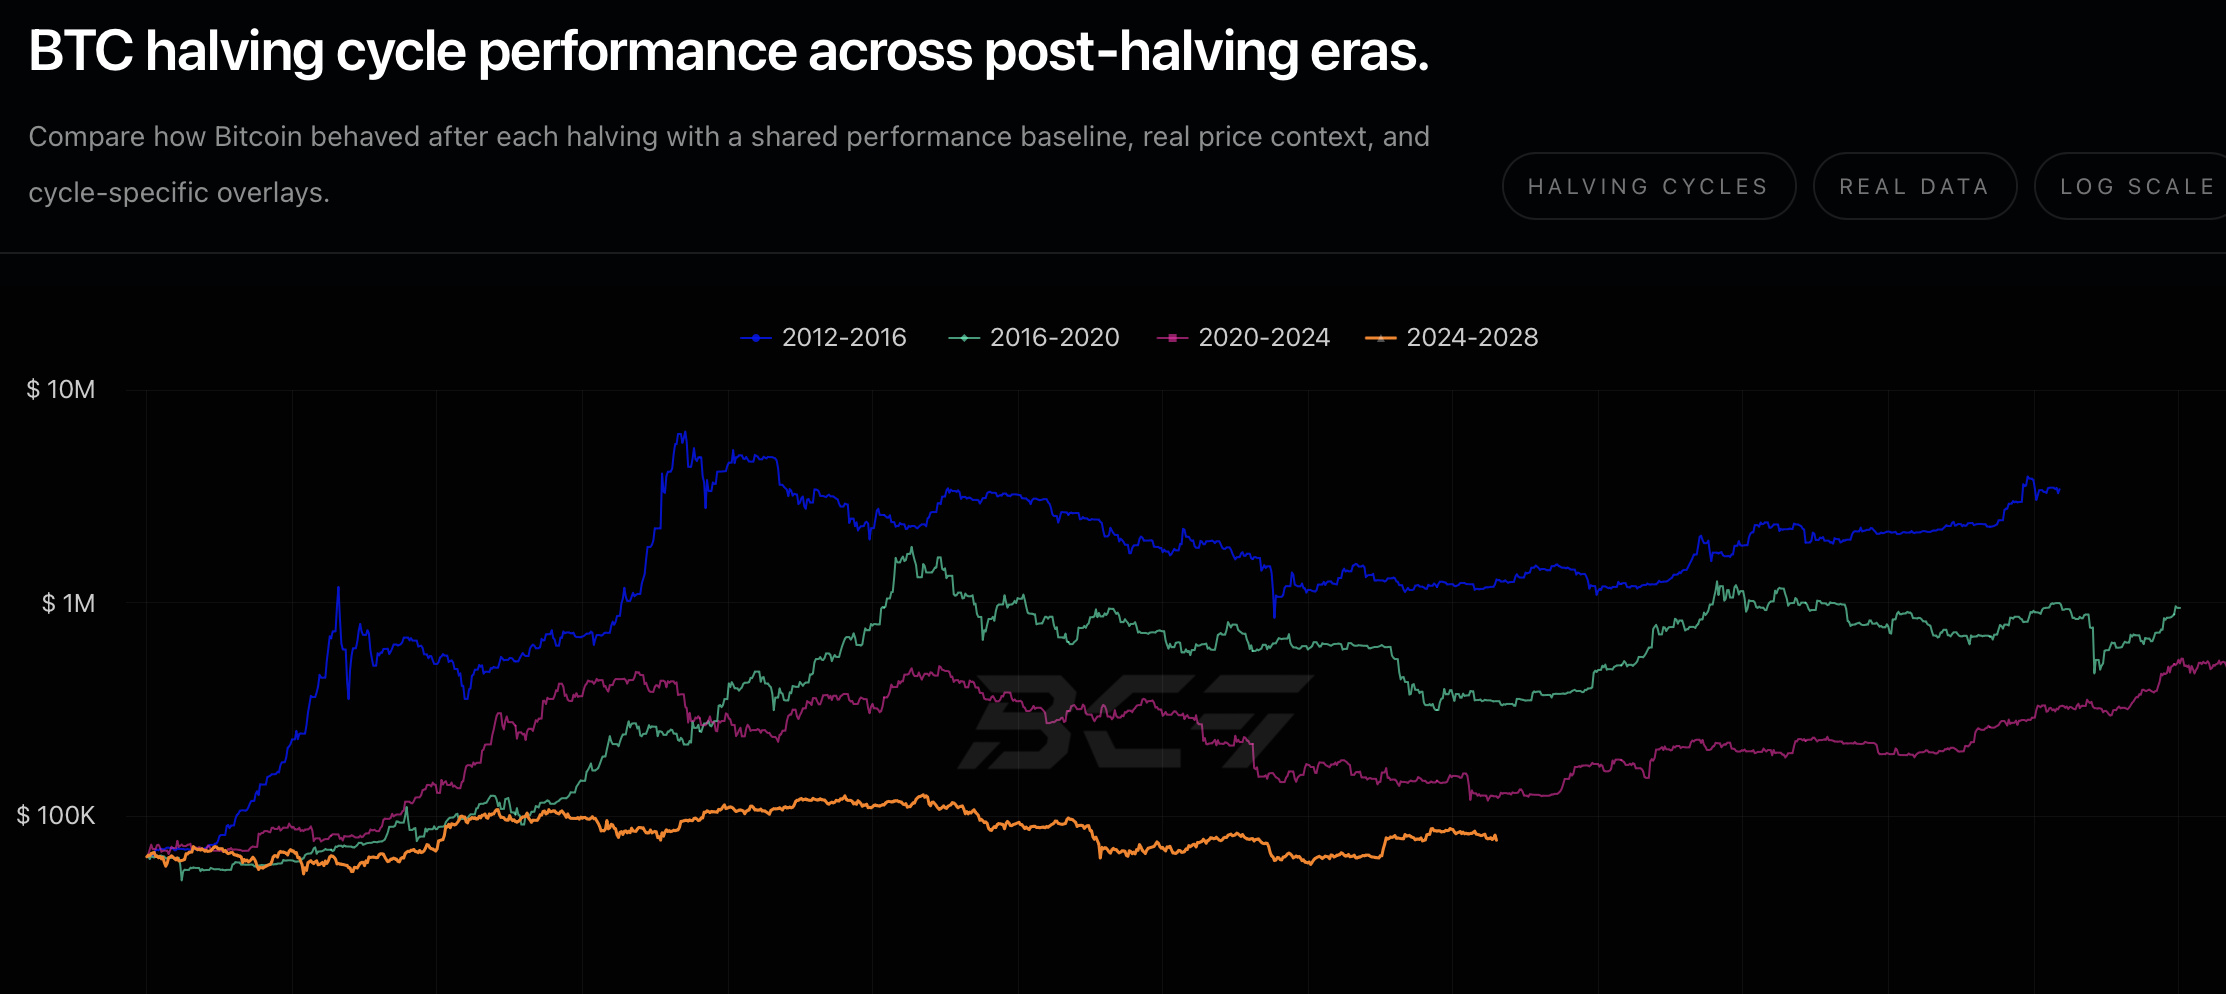
This is the flattest post-halving cycle ever))) $BTC
{future}(BTCUSDT)
This is the flattest post-halving cycle ever))) $BTC
1
497
·
--
Bearish
Verified
See translation
Two years ago, when the airdrop hype started and we saw an endless flow of different L0, L1, and L2 projects, I was already saying that we didn't need so many middlemen built around Ethereum!
People believed in some imaginary scalability and thought all these projects had some kind of fundamental value. Two years later, we're seeing several projects shutting down completely, while others are gradually moving to Ethereum!
In the end, most of these projects turned out to be nothing more than a way for funds that invested at early stages to make money!
Zilliqa is abandoning its own Layer-1 blockchain and transitioning to Ethereum as a Layer-2 chain. Now they're transitioning from L1 to an Ethereum L2. I don't want to make any predictions, but I wouldn't be surprised if, 3–5 years from now, we see another announcement saying that the project is shutting down!
ZIL was around long before the airdrop hype, but so far, apart from promises and a hype-driven pump and dump around the Metaverse narrative, it hasn't delivered anything meaningful over all these years!
Once again, this proves that a project's fundamentals and the ideas it promotes on social media have nothing to do with the price of its token! $ZIL
{future}(ZILUSDT)
Two years ago, when the airdrop hype started and we saw an endless flow of different L0, L1, and L2 projects, I was already saying that we didn't need so many middlemen built around Ethereum!
People believed in some imaginary scalability and thought all these projects had some kind of fundamental value. Two years later, we're seeing several projects shutting down completely, while others are gradually moving to Ethereum!
In the end, most of these projects turned out to be nothing more than a way for funds that invested at early stages to make money!
Zilliqa is abandoning its own Layer-1 blockchain and transitioning to Ethereum as a Layer-2 chain. Now they're transitioning from L1 to an Ethereum L2. I don't want to make any predictions, but I wouldn't be surprised if, 3–5 years from now, we see another announcement saying that the project is shutting down!
ZIL was around long before the airdrop hype, but so far, apart from promises and a hype-driven pump and dump around the Metaverse narrative, it hasn't delivered anything meaningful over all these years!
Once again, this proves that a project's fundamentals and the ideas it promotes on social media have nothing to do with the price of its token! $ZIL
People believed in some imaginary scalability and thought all these projects had some kind of fundamental value. Two years later, we're seeing several projects shutting down completely, while others are gradually moving to Ethereum!
In the end, most of these projects turned out to be nothing more than a way for funds that invested at early stages to make money!
Zilliqa is abandoning its own Layer-1 blockchain and transitioning to Ethereum as a Layer-2 chain. Now they're transitioning from L1 to an Ethereum L2. I don't want to make any predictions, but I wouldn't be surprised if, 3–5 years from now, we see another announcement saying that the project is shutting down!
ZIL was around long before the airdrop hype, but so far, apart from promises and a hype-driven pump and dump around the Metaverse narrative, it hasn't delivered anything meaningful over all these years!
Once again, this proves that a project's fundamentals and the ideas it promotes on social media have nothing to do with the price of its token! $ZIL

1
1.5k
·
--
See translation
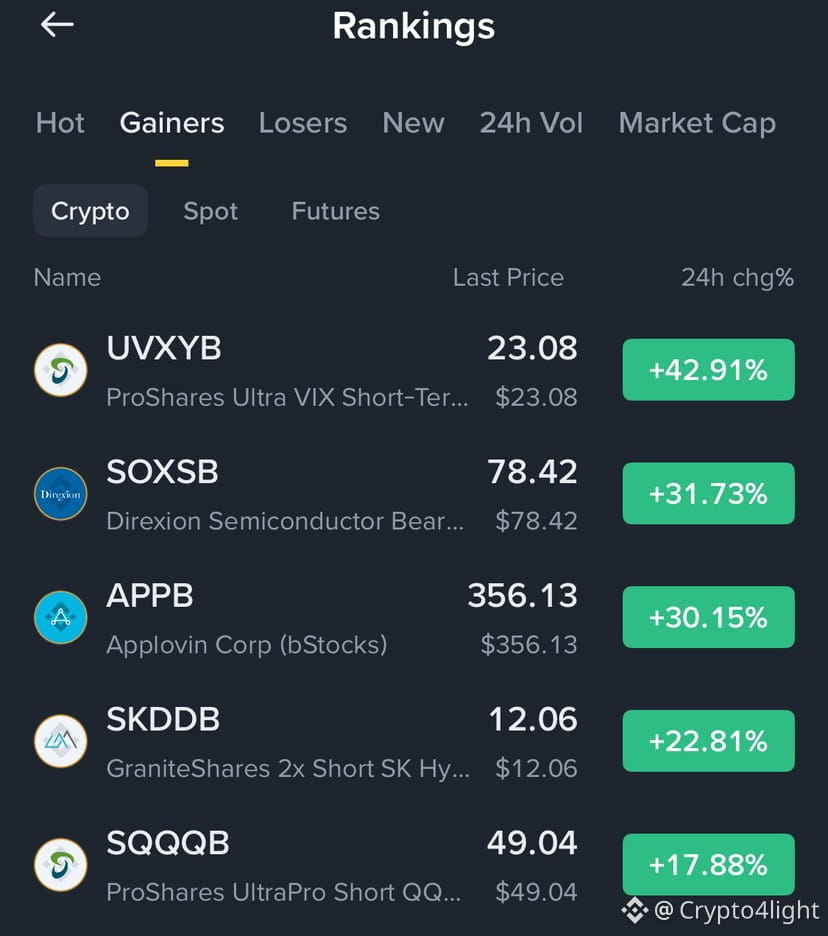
Nothing unusual. The main centralized crypto exchange. Top daily gainers. Not a single crypto token.
I guess everyone who fought against the financial system but dreamed of institutional adoption was hoping for exactly this. #crypto
Nothing unusual. The main centralized crypto exchange. Top daily gainers. Not a single crypto token.
I guess everyone who fought against the financial system but dreamed of institutional adoption was hoping for exactly this. #crypto
I guess everyone who fought against the financial system but dreamed of institutional adoption was hoping for exactly this. #crypto
1
3.3k
·
--
Partly True
See translation
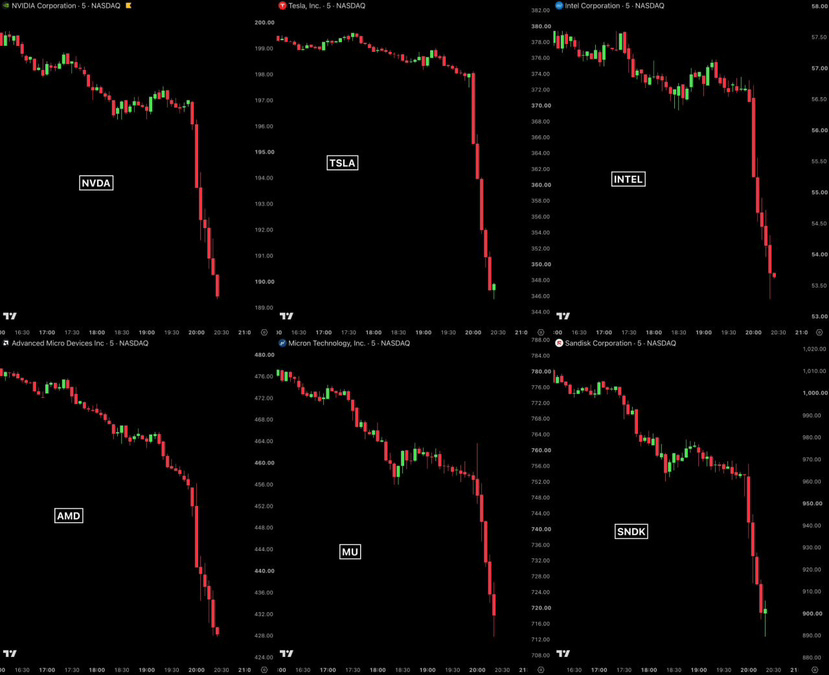
The US stock market lost over $2.3 trillion in market capitalization in just 50 minutes after the start of trading — this is the fastest decline of such scale in history. 🤦♂️
The US stock market lost over $2.3 trillion in market capitalization in just 50 minutes after the start of trading — this is the fastest decline of such scale in history. 🤦♂️
1
1.6k
·
--
Partly True
See translation
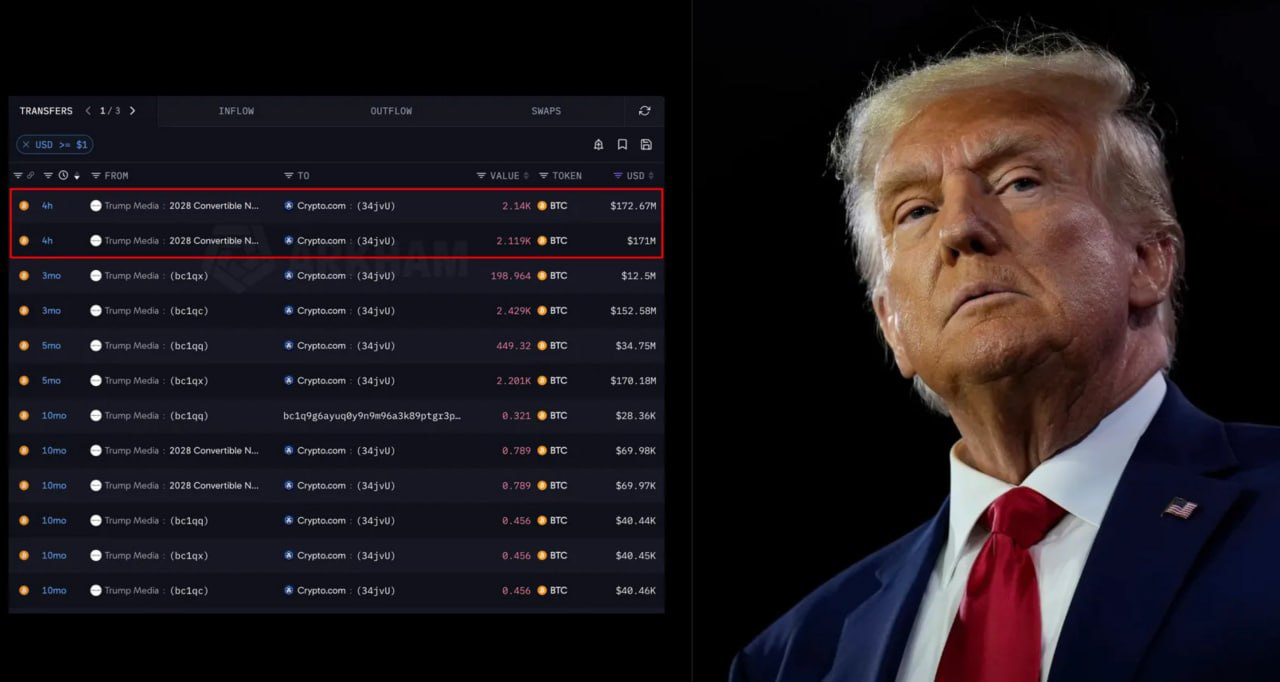
Trump Media sold $343 million worth of Bitcoin, one day after Democrats announced plans to investigate Trump’s crypto business. $BTC
{future}(BTCUSDT)
Trump Media sold $343 million worth of Bitcoin, one day after Democrats announced plans to investigate Trump’s crypto business. $BTC
1
1
650
·
--
See translation
ETHEREUM IS READY FOR $7,000! But There's a Catch...$ETH
ETHEREUM IS READY FOR $7,000! But There's a Catch...$ETH
289
·
--
Bullish
See translation
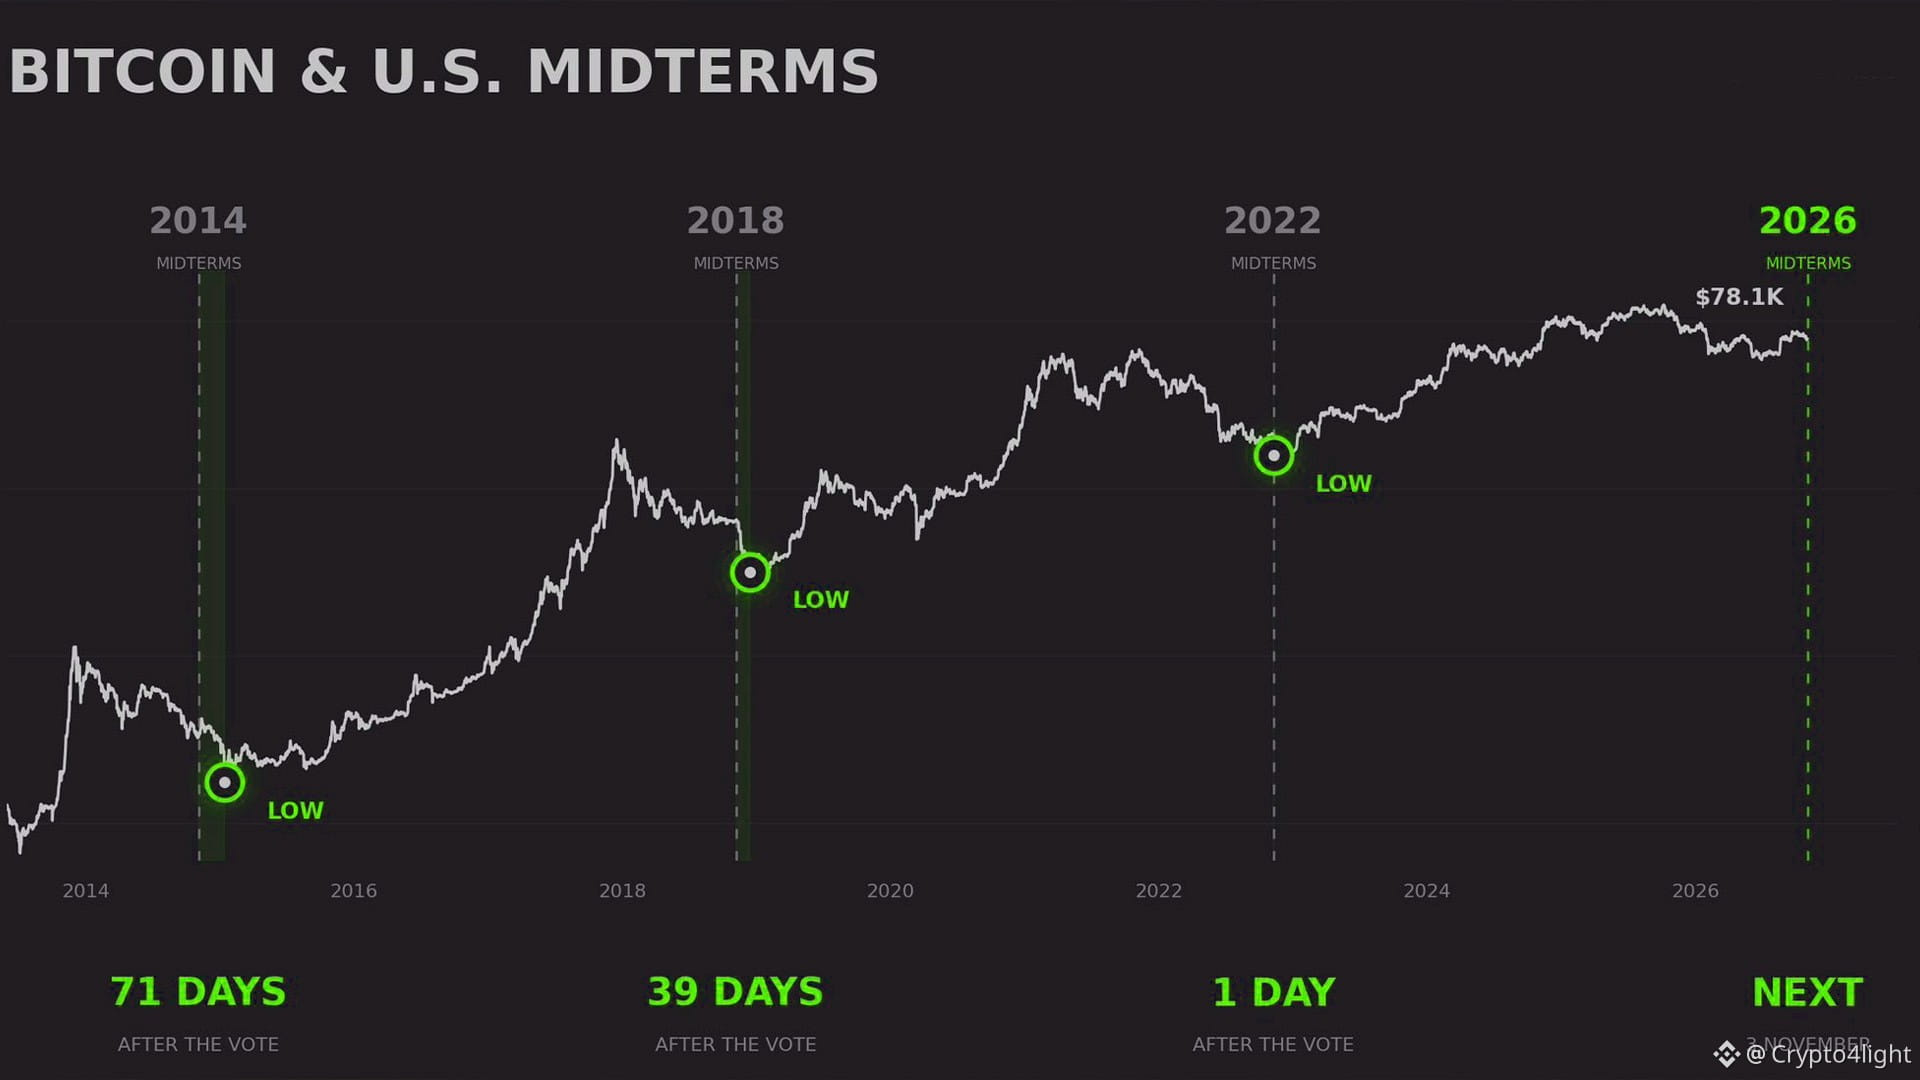
I think you've already seen plenty of posts about this, and I've shared the statistics myself. But remember, statistics don't guarantee anything!
There's one statistic showing that Bitcoin has dropped after every US midterm election. But there's another one showing that, on a broader scale, Bitcoin has always gone on to rise afterward.))
We know the market will eventually go up. That's not the question!
The real question is: will we see another drop followed by a recovery, or will things play out differently this time, catching the crowd completely off guard? $BTC
{future}(BTCUSDT)
I think you've already seen plenty of posts about this, and I've shared the statistics myself. But remember, statistics don't guarantee anything!
There's one statistic showing that Bitcoin has dropped after every US midterm election. But there's another one showing that, on a broader scale, Bitcoin has always gone on to rise afterward.))
We know the market will eventually go up. That's not the question!
The real question is: will we see another drop followed by a recovery, or will things play out differently this time, catching the crowd completely off guard? $BTC
There's one statistic showing that Bitcoin has dropped after every US midterm election. But there's another one showing that, on a broader scale, Bitcoin has always gone on to rise afterward.))
We know the market will eventually go up. That's not the question!
The real question is: will we see another drop followed by a recovery, or will things play out differently this time, catching the crowd completely off guard? $BTC
1
1
7
6.5k
·
--
See translation
US ELECTIONS ARE OVER! What's Next for Bitcoin? $BTC
US ELECTIONS ARE OVER! What's Next for Bitcoin? $BTC
1
275
·
--
See translation
Nobody Wants Altcoins Anymore… That's EXACTLY Why I'm Watching! #altcoins $ETH
Nobody Wants Altcoins Anymore… That's EXACTLY Why I'm Watching! #altcoins $ETH
1
648
·
--
Bullish
See translation
Just WOW!
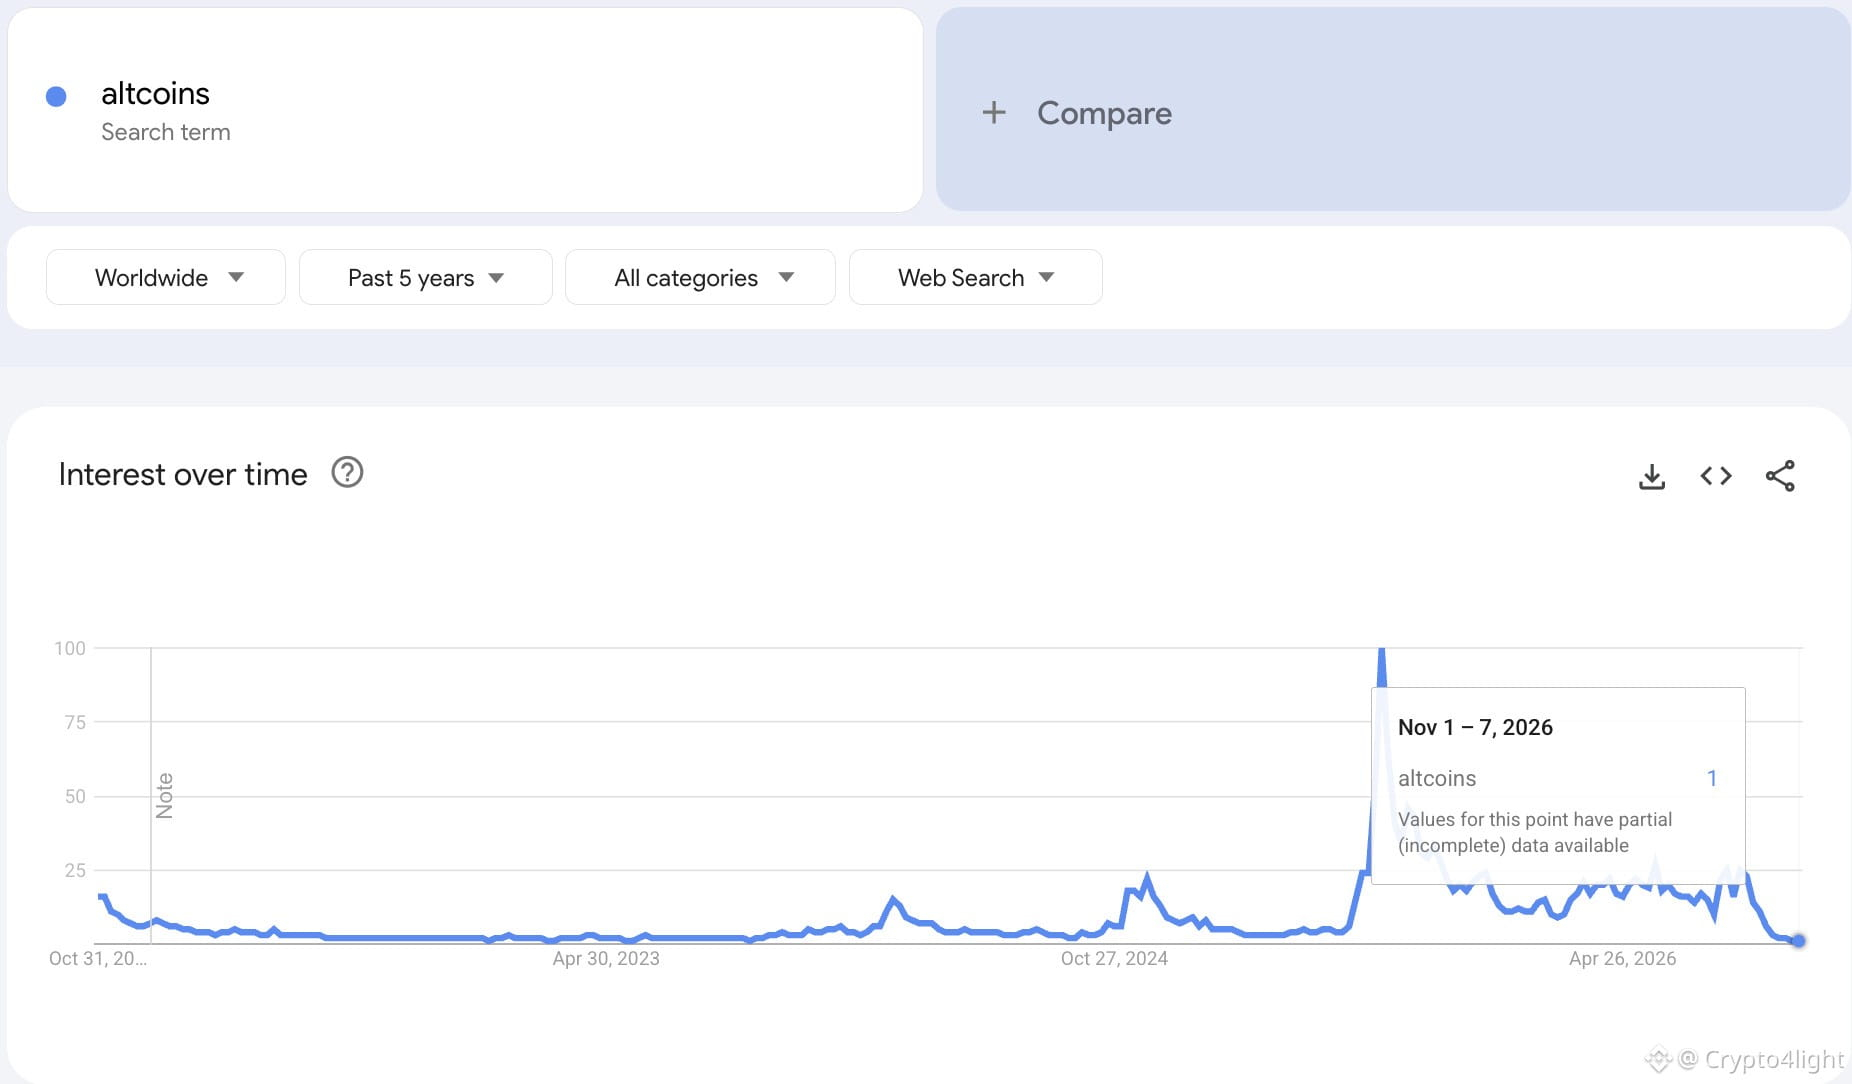
Interest in altcoins is at its lowest level in the past 5 years! Of course, 2022, 2023, and 2024 were almost the same. =)
People, aka gamblers, start looking for and buying altcoins only when prices are already high — just like at the end of 2024 and the beginning of 2025.
So don't make the same mistake again!
Find coins that are in interesting zones NOW. [Build your edge NOW!](https://www.binance.com/en/square/post/4320785715154) #altcoins
Just WOW!
Interest in altcoins is at its lowest level in the past 5 years! Of course, 2022, 2023, and 2024 were almost the same. =)
People, aka gamblers, start looking for and buying altcoins only when prices are already high — just like at the end of 2024 and the beginning of 2025.
So don't make the same mistake again!
Find coins that are in interesting zones NOW. Build your edge NOW! #altcoins
Interest in altcoins is at its lowest level in the past 5 years! Of course, 2022, 2023, and 2024 were almost the same. =)
People, aka gamblers, start looking for and buying altcoins only when prices are already high — just like at the end of 2024 and the beginning of 2025.
So don't make the same mistake again!
Find coins that are in interesting zones NOW. Build your edge NOW! #altcoins
2.8k
·
--
Bearish
Verified
See translation
At least the 💩 can happen not only with a crypto)))
One of Paraguay's largest banks, Ueno Bank, has ceased operations, leaving nearly 60% of the country's adult population without access to their accounts.
The bank served approximately 3 million customers and held $2.8 billion in deposits, including hundreds of millions of dollars in government funds.
$BTC
{future}(BTCUSDT)
At least the 💩 can happen not only with a crypto)))
One of Paraguay's largest banks, Ueno Bank, has ceased operations, leaving nearly 60% of the country's adult population without access to their accounts.
The bank served approximately 3 million customers and held $2.8 billion in deposits, including hundreds of millions of dollars in government funds.
$BTC
One of Paraguay's largest banks, Ueno Bank, has ceased operations, leaving nearly 60% of the country's adult population without access to their accounts.
The bank served approximately 3 million customers and held $2.8 billion in deposits, including hundreds of millions of dollars in government funds.
$BTC

2
641
Log in to explore more content
Join global crypto users on Binance Square
⚡️ Get latest and useful information about crypto.
💬 Trusted by the world’s largest crypto exchange.
👍 Discover real insights from verified creators.
Email / Phone number
Trending Topics
JobsReportRaisesHikeOdds
260,380 views
2,062 Discussing
TradFi News | US Adds 165,000 Jobs in October, More Than Double the 65,000 Forecast, as Unemployment Falls to 4.1%
Binance News
·34 Likes
·22.7k views
CPITestsDecemberRateOutlook
24,458 views
340 Discussing
BitcoinRebounds$75KAsChipsLead
21,545 views
226 Discussing