

RaselRedoy
244 Posts

RaselRedoy
Report
Block User
47 Following
90 Followers
193 Liked
Posts
All
Quotes
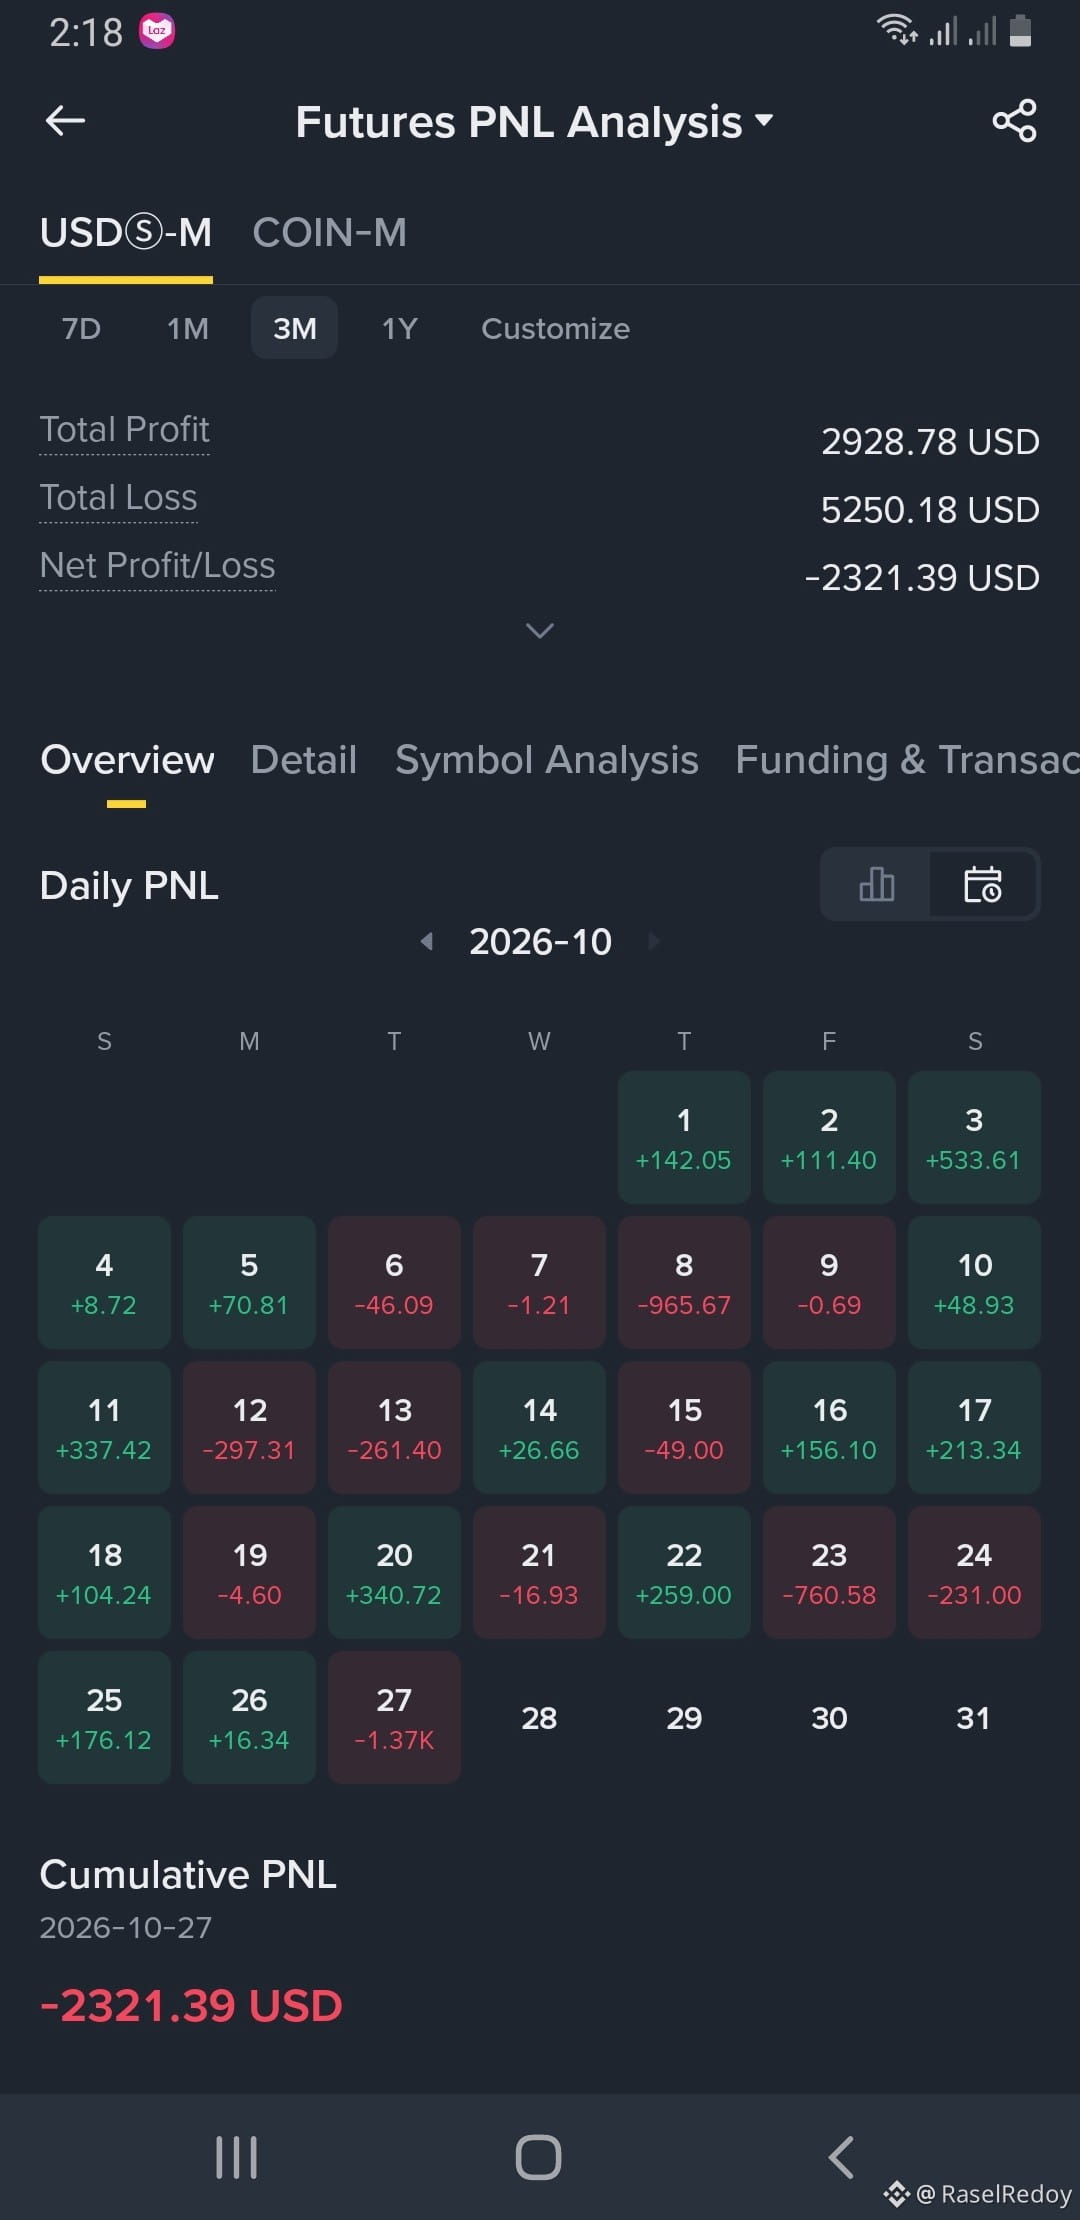
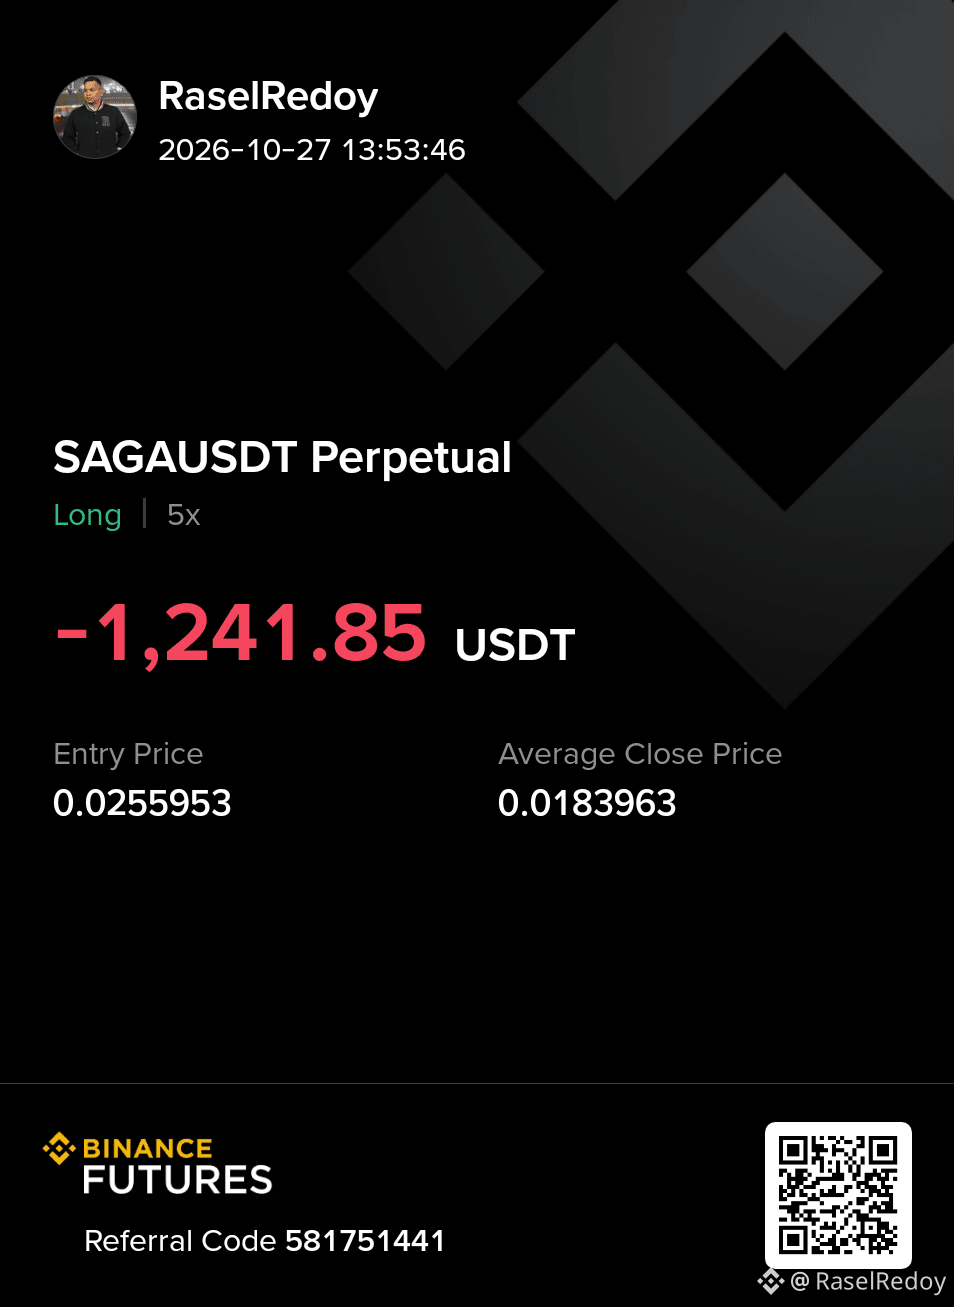
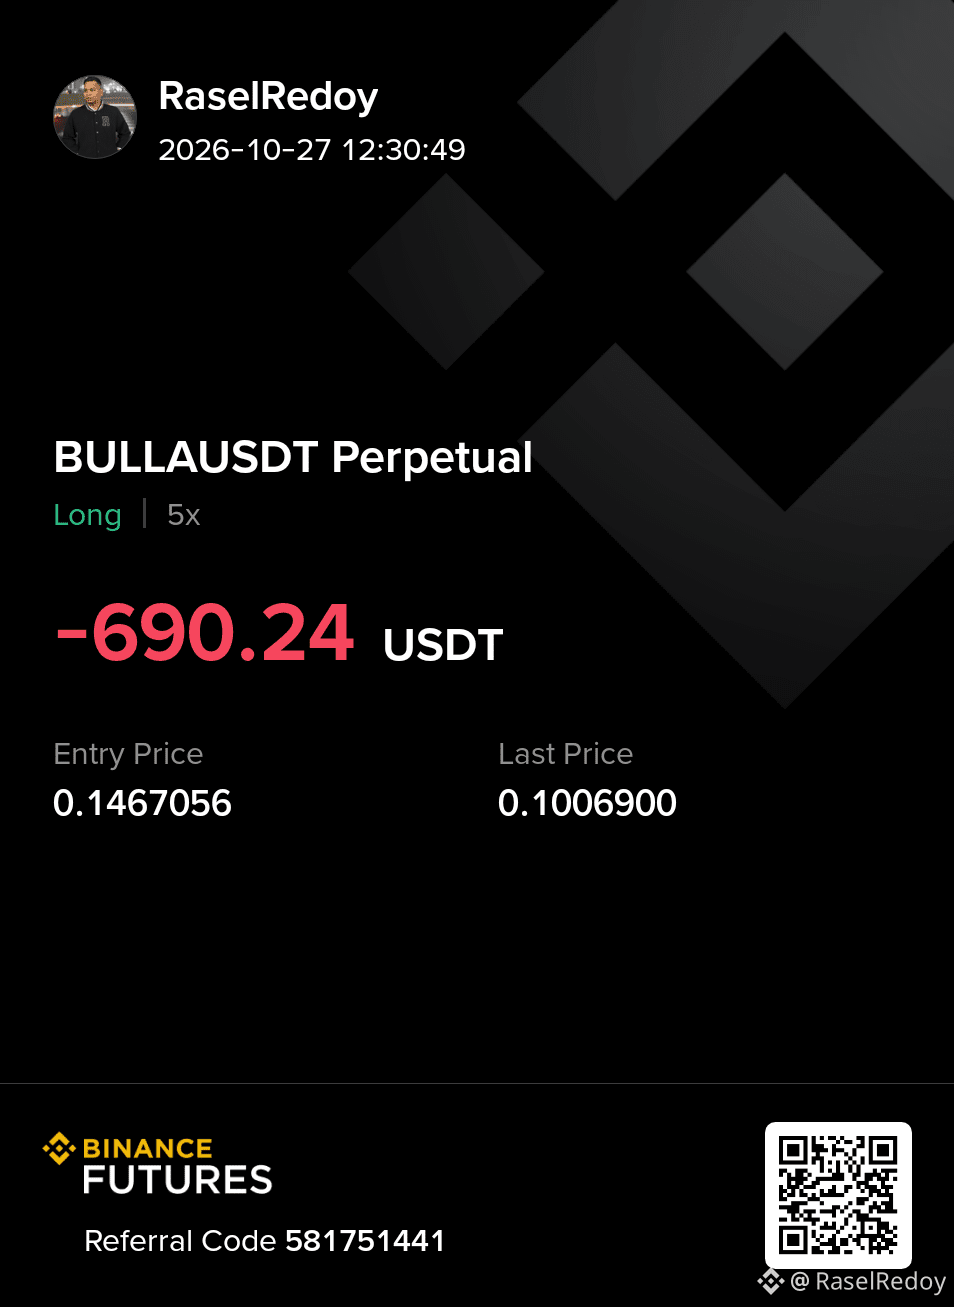
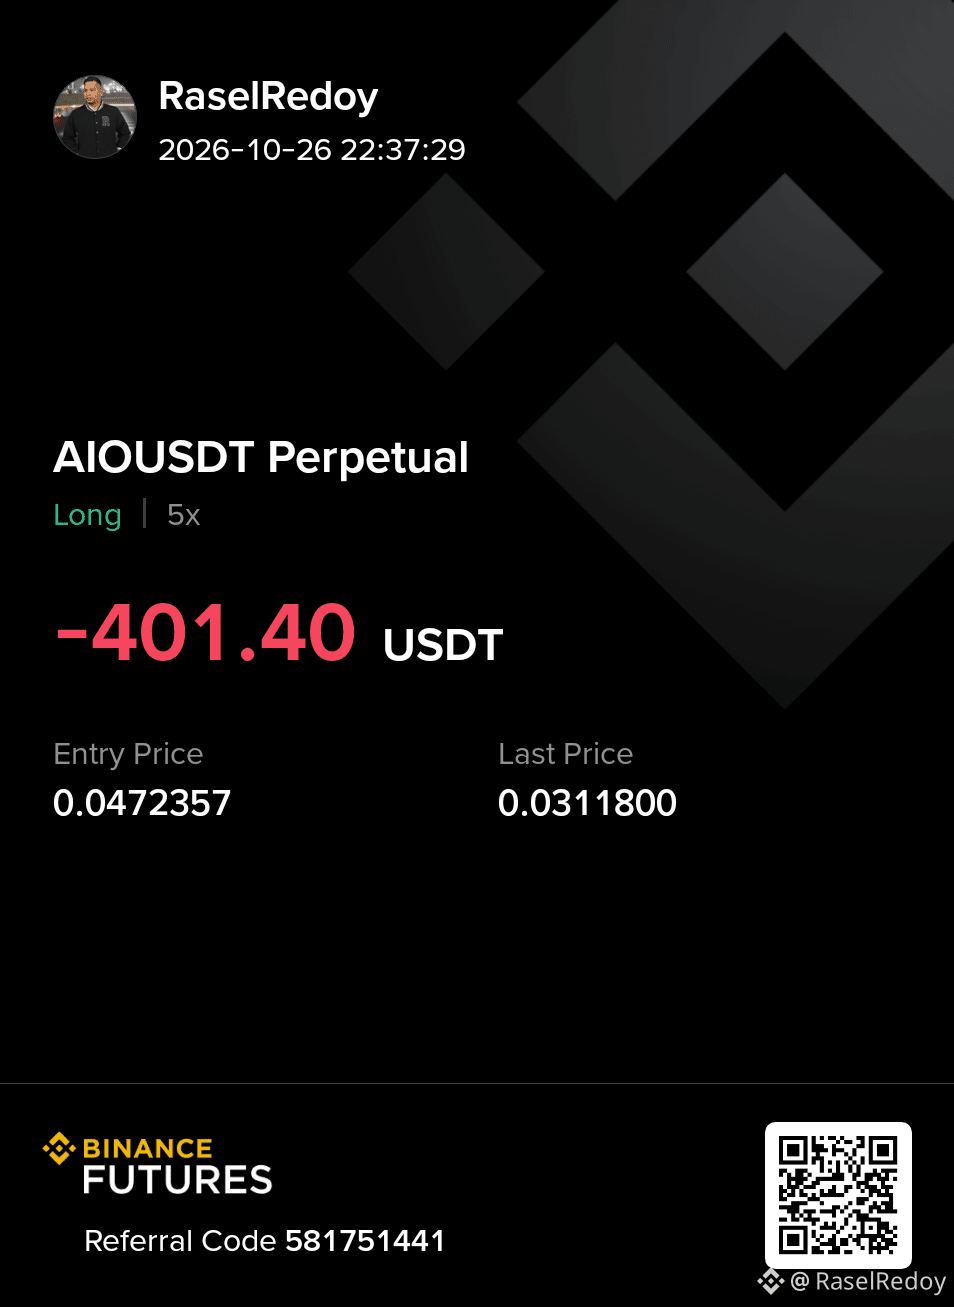
·
--
#SKYAI #BTC☀
According to the 4-hour (4h) chart, the recent strong swing high or main resistance level is **$0.039749** (which is also the 24-hour high level).
* **Swing Low:** The main swing low or support zone is near **$0.030452** (the 24-hour low is $0.030613).
* **Liquidity Area:** The stop loss of short positions and buy-side liquidity are accumulated just above the **$0.039749** level. On the other hand, there is a sell-side liquidity pool around the **$0.030452** level on the downside.
### 2. Liquidity Sweep
* The price has recently moved upwards from the lower support zone with strong bullish momentum and is showing some correction or retracement by touching the **$0.039749** resistance level directly.
* The current price is hovering around **$0.035992**. This indicates that after sweeping the upper high, the price may temporarily return to retest the lower fair value gap or support.
### 3. Market Structure
* **Structure and Direction:** The price has formed a clear uptrend or bullish structure on the 4-hour chart. The price has moved upwards from the lower swing low ($0.030452) with a strong green candle and volume spike.
* According to the trend confirmation, the short-term direction is bullish, but the next movement will be determined after retesting the major levels.
### 4. Entry Plan (Entry and Risk Management Plan)
* **Entry Signal:** Without taking a direct entry at the current level, if the price pulls back slightly and retests a strong support zone or Fair Value Gap (FVG) and gives a bullish reaction, then a long position can be considered.
* **Stop Loss:** In case of long positions, the stop loss should be set slightly below the recent swing low or breakout zone (e.g. below **$0.03000**).
* **Risk Management:** Keeping the volatility and market conditions of the token in mind, keep the leverage under control and do not risk more than 1-2% of the portfolio.
220
·
--
Please Don't Be So Excited #PEPE ... 🤪🤪🤪
1. HTF Key Levels (Major Levels and Liquidity)
Swing High: According to the chart, the recent significant swing high—or resistance level—is at 0.00000511 (which also serves as the 24-hour high).
Swing Low: A major swing low, or support zone, is located near 0.00000377 (the 24-hour low is 0.00000433).
Liquidity Area: Buy-side liquidity, along with stop-loss orders for short positions, is concentrated above the 0.00000511 level. Conversely, a pool of sell-side liquidity exists near the 0.00000377 level.
2. Liquidity Sweep
The price is currently moving upward with strong bullish momentum, positioning itself near the 0.00000511 resistance level (the high).
Given the rapid upward movement, there is a possibility that the price may temporarily pull back—undergoing a correction or retracement—either before breaking through this high or following a liquidity sweep.
3. Market Structure
Structure and Direction: On the 4-hour (4h) chart, the price is in a strong uptrend. Following a bounce from the previous swing low, the price has been forming "higher highs" through a series of consecutive green candles.
Money flow data indicates a positive inflow of large buy orders, which strongly confirms the bullish direction.
4. Entry Plan (Entry and Risk Management Plan)
Entry Signal: Rather than rushing to enter during the current, excessively bullish candle, it would be prudent to wait for a slight price pullback or a retest of a Fair Value Gap (FVG).
Stop Loss: For a long position, the stop loss should be set just below the recent swing low or the breakout zone (e.g., at or below 0.00000470).
Risk Management: As the RSI indicator is nearing the overbought zone, volatility may be high. Therefore, keep your leverage in check and ensure that you do not risk more than 1–2% of your portfolio.
#BTC☀ #PEPE
1
493
·
--
1. HTF Key Levels (Major Levels and Liquidity)
Swing High: A strong swing high or resistance level visible on the chart is at $0.024030 (24-hour high: $0.02249).
Swing Low: A major swing low or support level is located near $0.019030 (24-hour low: $0.01962).
Liquidity Area: Buy-side liquidity—consisting of stop-loss orders for short positions—is concentrated above the $0.024030 level, while a sell-side liquidity pool exists near the $0.019030 level.
2. Liquidity Sweep
The price is currently at $0.01977; following a recent decline, it has moved quite close to the swing low ($0.019030).
Data indicates high sell volume, and Open Interest is decreasing rapidly. This suggests that the price may be preparing for a rebound or bounce-back after reaching the liquidity zone below, though bearish pressure remains present.
3. Market Structure
Structure and Direction: On the 4-hour (4h) timeframe, the price is in a downtrend or a corrective movement.
For confirmation of direction, the price needs to break the previous structure on a lower timeframe—demonstrating a "Break of Structure" (BOS) or a trend reversal.
4. Entry Plan (Entry and Risk Management Plan)
Entry Signal: In the current bearish market, avoid taking a long entry impulsively; instead, wait for a reaction from a Fair Value Gap (FVG) or a strong support zone.
Stop Loss: For a long position, the stop loss should be set below the recent swing low of $0.01880.
Risk Management: Considering the current volatility and position data (Long/Short ratio), keep leverage very low and ensure that the risk per trade does not exceed 1%.
90
·
--
HTF Key Levels (Major Levels and Liquidity)
1.Swing High: A strong swing high—or resistance level—visible on the chart is at $0.10424 (which also serves as the 24-hour high).
Swing Low: A major swing low (bottom level) formed during the recent decline or "dump" is at $0.06694 (the 24-hour low is also $0.06694).
Liquidity Area: Buy-side liquidity—consisting of stop-loss orders for short positions—is concentrated above the $0.10424 level. Meanwhile, liquidity for long positions has been "swept" near the $0.06694 level.
2. Liquidity Sweep
The price dropped rapidly from the swing high due to intense selling pressure, falling all the way to the $0.06694 level—effectively completing a significant liquidity sweep.
Following this sharp decline, the price has currently stabilized, hovering around the $0.07276 level. It may undergo a period of consolidation or base-building before potentially attempting a return to the previous high ($0.10424).
3. Market Structure
Structure and Direction: A major bearish impulsive move is visible on the chart, placing the short-term market structure firmly in a bearish zone.
For a trend reversal or confirmation of a shift toward a bullish direction, the price would need to break a significant previous high on a lower timeframe, resulting in a "Break of Structure" (BOS).
4. Entry Plan (Entry and Risk Management Plan)
Entry Signal: Given the rapid decline, avoid entering the market impulsively. Instead, wait for the price to stabilize or for a retest of a Fair Value Gap (FVG) or a resistance zone.
Stop Loss: For a long position, place the stop loss below the recent swing low at $0.06500.
Risk Management: Due to the current high volatility and the prevailing downtrend, keep leverage very low and ensure that the risk per trade does not exceed 1%.
491
·
--
2
9
6.5k

·
--
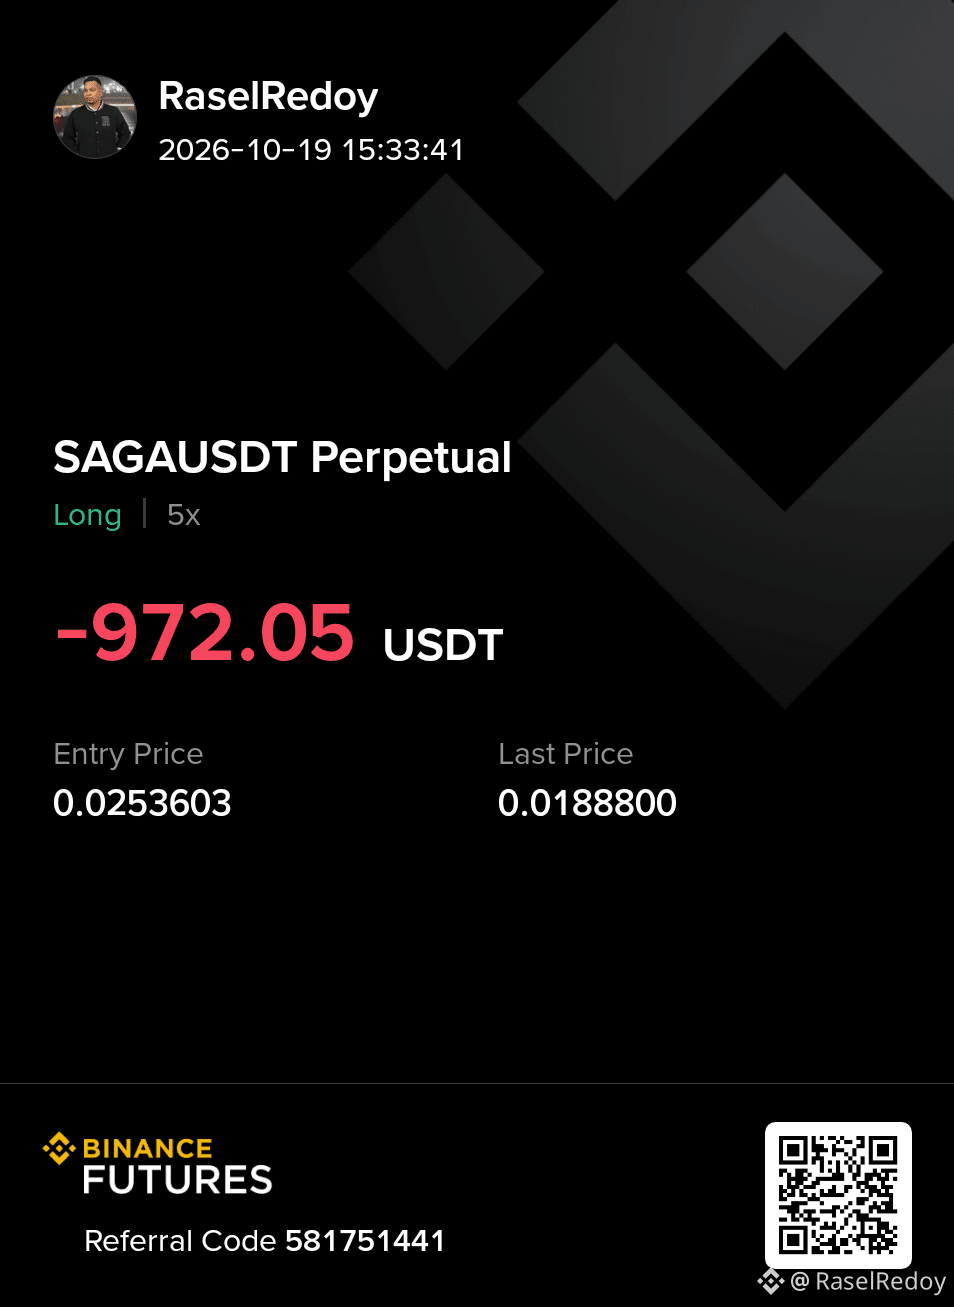
Very near to touch All time law,what else you’re looking for🥲Come on get up bitch😡
Very near to touch All time law,what else you’re looking for🥲Come on get up bitch😡
1
637
·
--
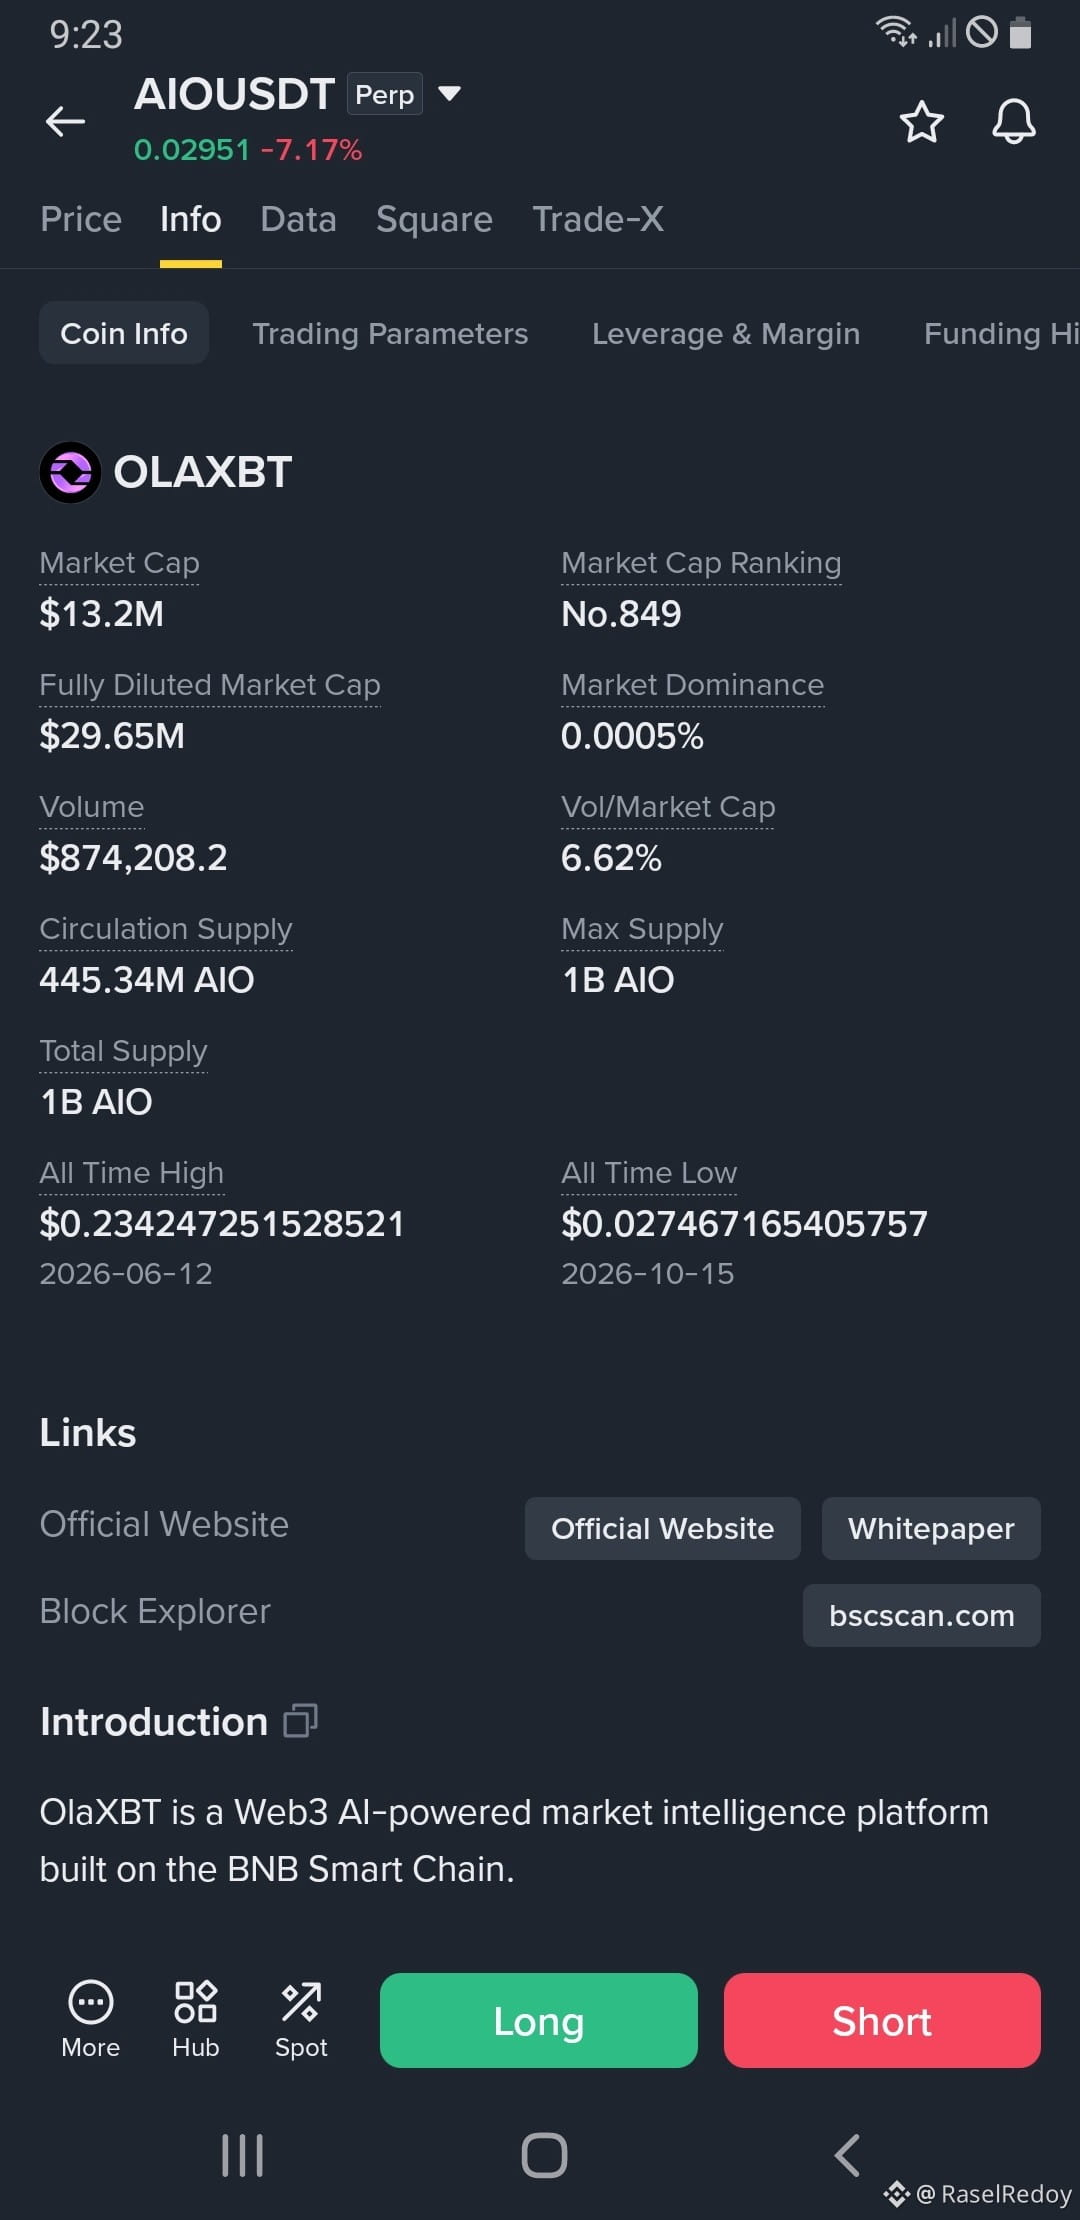
there's a lot of problem killing my wallet and on top this shit.. Don't know how to solve this problem 🥲
there's a lot of problem killing my wallet and on top this shit.. Don't know how to solve this problem 🥲
272
·
--
How long Don't know but i Won't leave it either do or die.
How long Don't know but i Won't leave it either do or die.
2
1
1.3k
Log in to explore more content
Join global crypto users on Binance Square
⚡️ Get latest and useful information about crypto.
💬 Trusted by the world’s largest crypto exchange.
👍 Discover real insights from verified creators.
Email / Phone number
Trending Topics
BitcoinSlipsBelow$80KAgain
0 views
2 Discussing
🚨 $BULLA SHORT SETUP — IS ANOTHER DUMP COMING? 📉🔥
Bears could be getting ready for another move lower. 👀
🔴 SHORT $BULLA/USDT
🎯 Entry: Market Price
✅ Take Profit: $0.0800
🛑 Stop Loss: $0.01400
#BitcoinSlipsBelow$80KAgain #StrategySkipsBitcoinPurchasesSpends$205MOnSTRCBuybacks #BitmineAdds10452ETH #SouthKoreaConsidersEducationTaxOnCryptoExchanges #OCCUrgesCommunityBanksToEnterStablecoinPayments
KimHotbae
·0 Likes
·36 views
StrategySkipsBitcoinPurchasesSpends$205MOnSTRCBuybacks
2,100 views
57 Discussing
BitmineAdds10452ETH
19,048 views
393 Discussing