
JBXBT
43 Posts

JBXBT
24 y/o trader-Fail 1000 times and still you might not make it 🌊 Follower Of The Waves👇
0 Following
11 Followers
16 Liked
Posts
All
Quotes
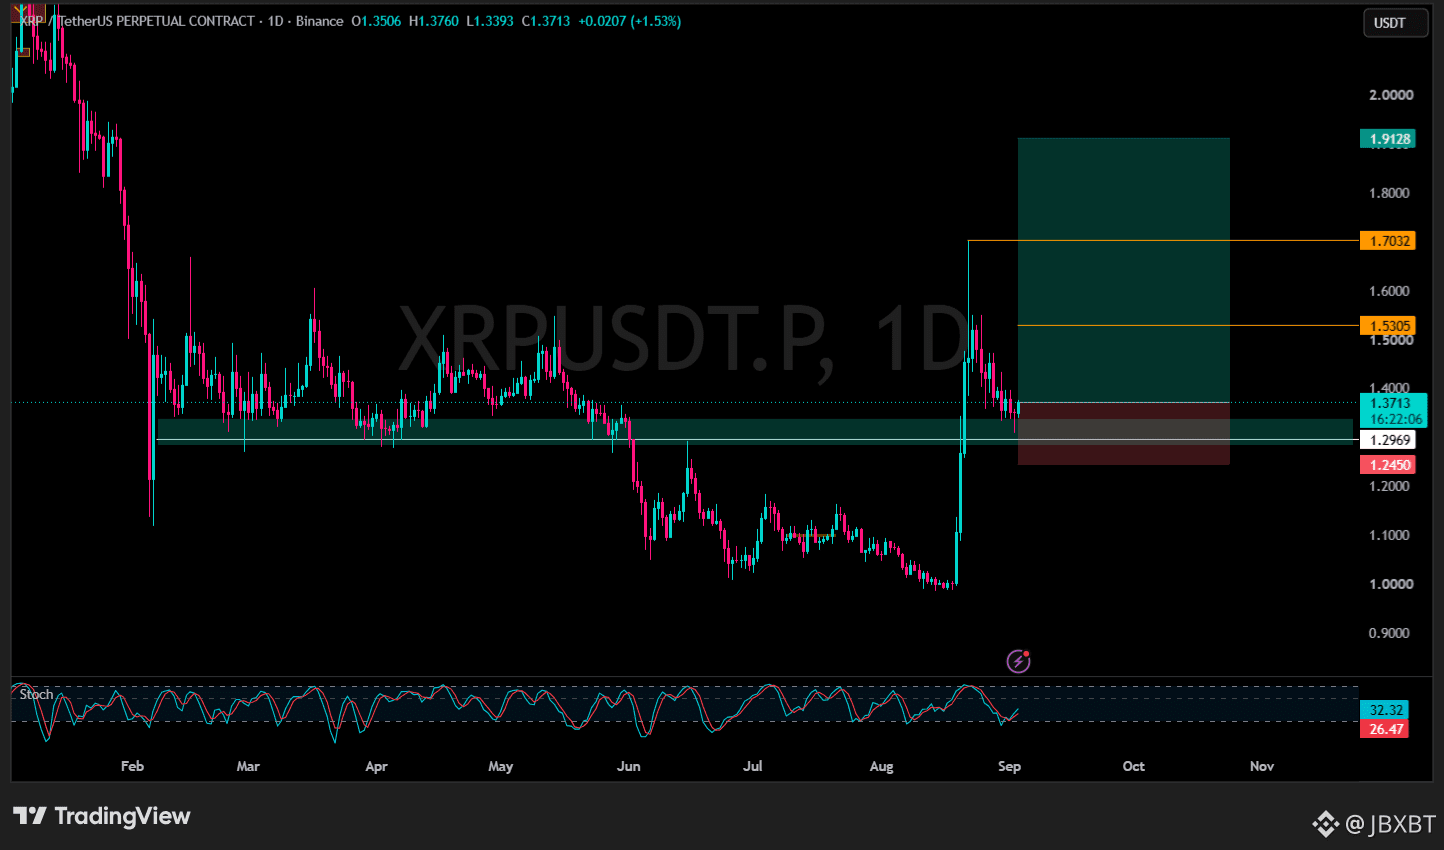
💡LONG $XRP
🎯 Entry: Market
🛡️ SL: 1.2450
This chart is looking good, Reclaimed above support. Longed!
☢️ RISK 1%
⚠️DYOR. NFA
🎯 Entry: Market
🛡️ SL: 1.2450
This chart is looking good, Reclaimed above support. Longed!
☢️ RISK 1%
⚠️DYOR. NFA
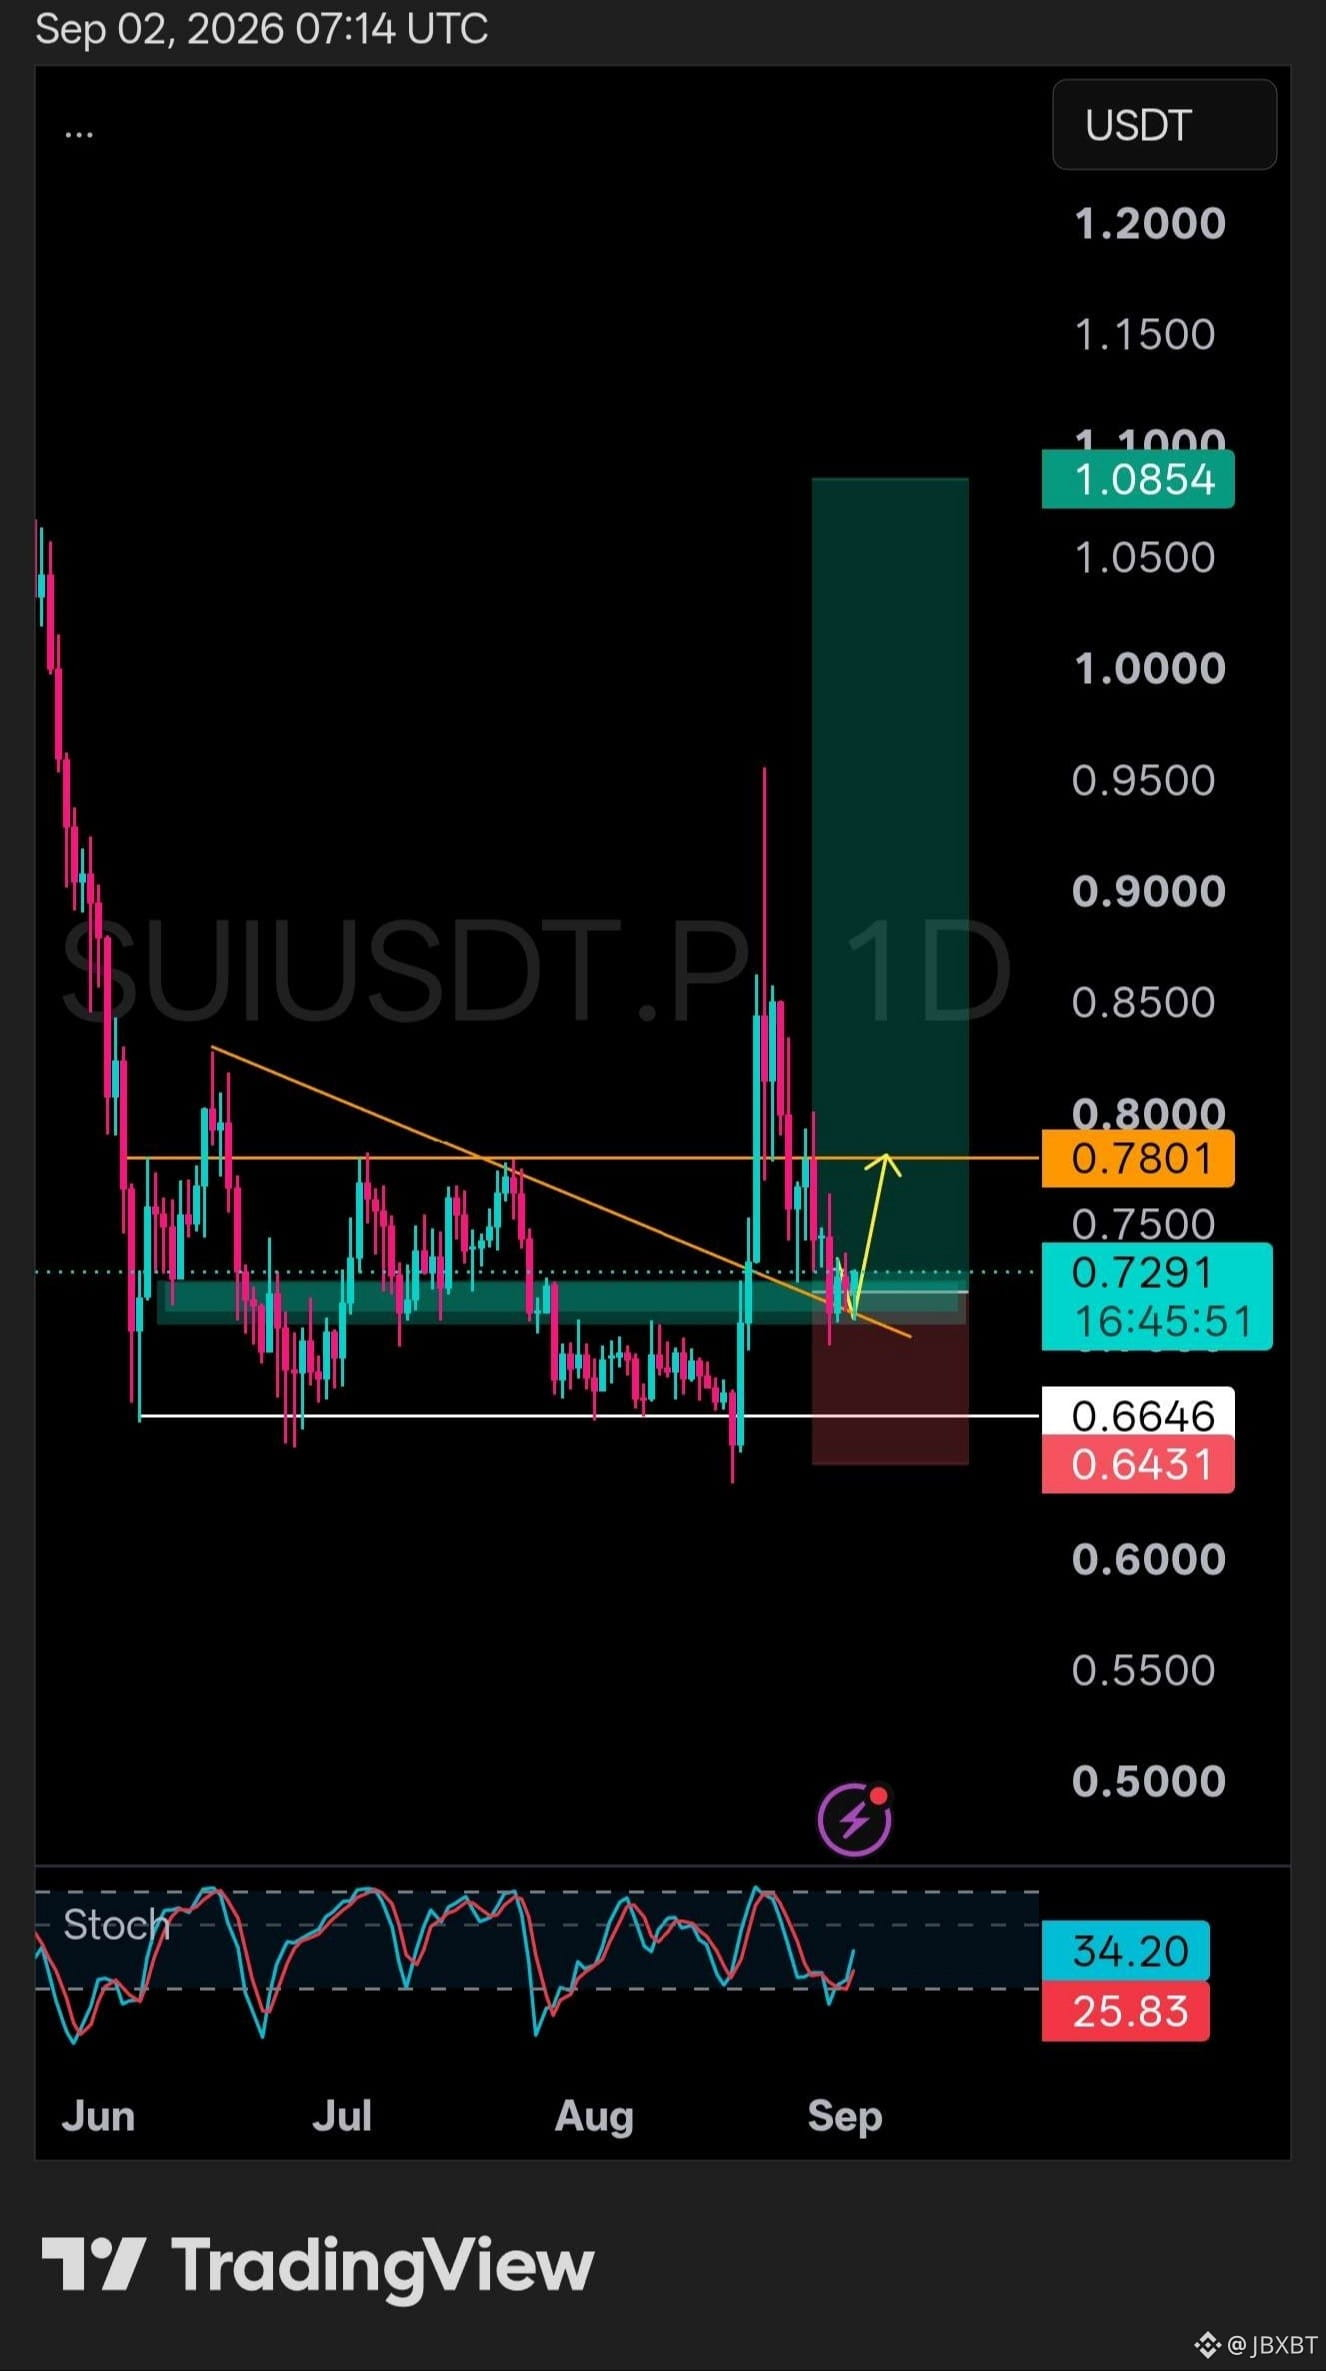
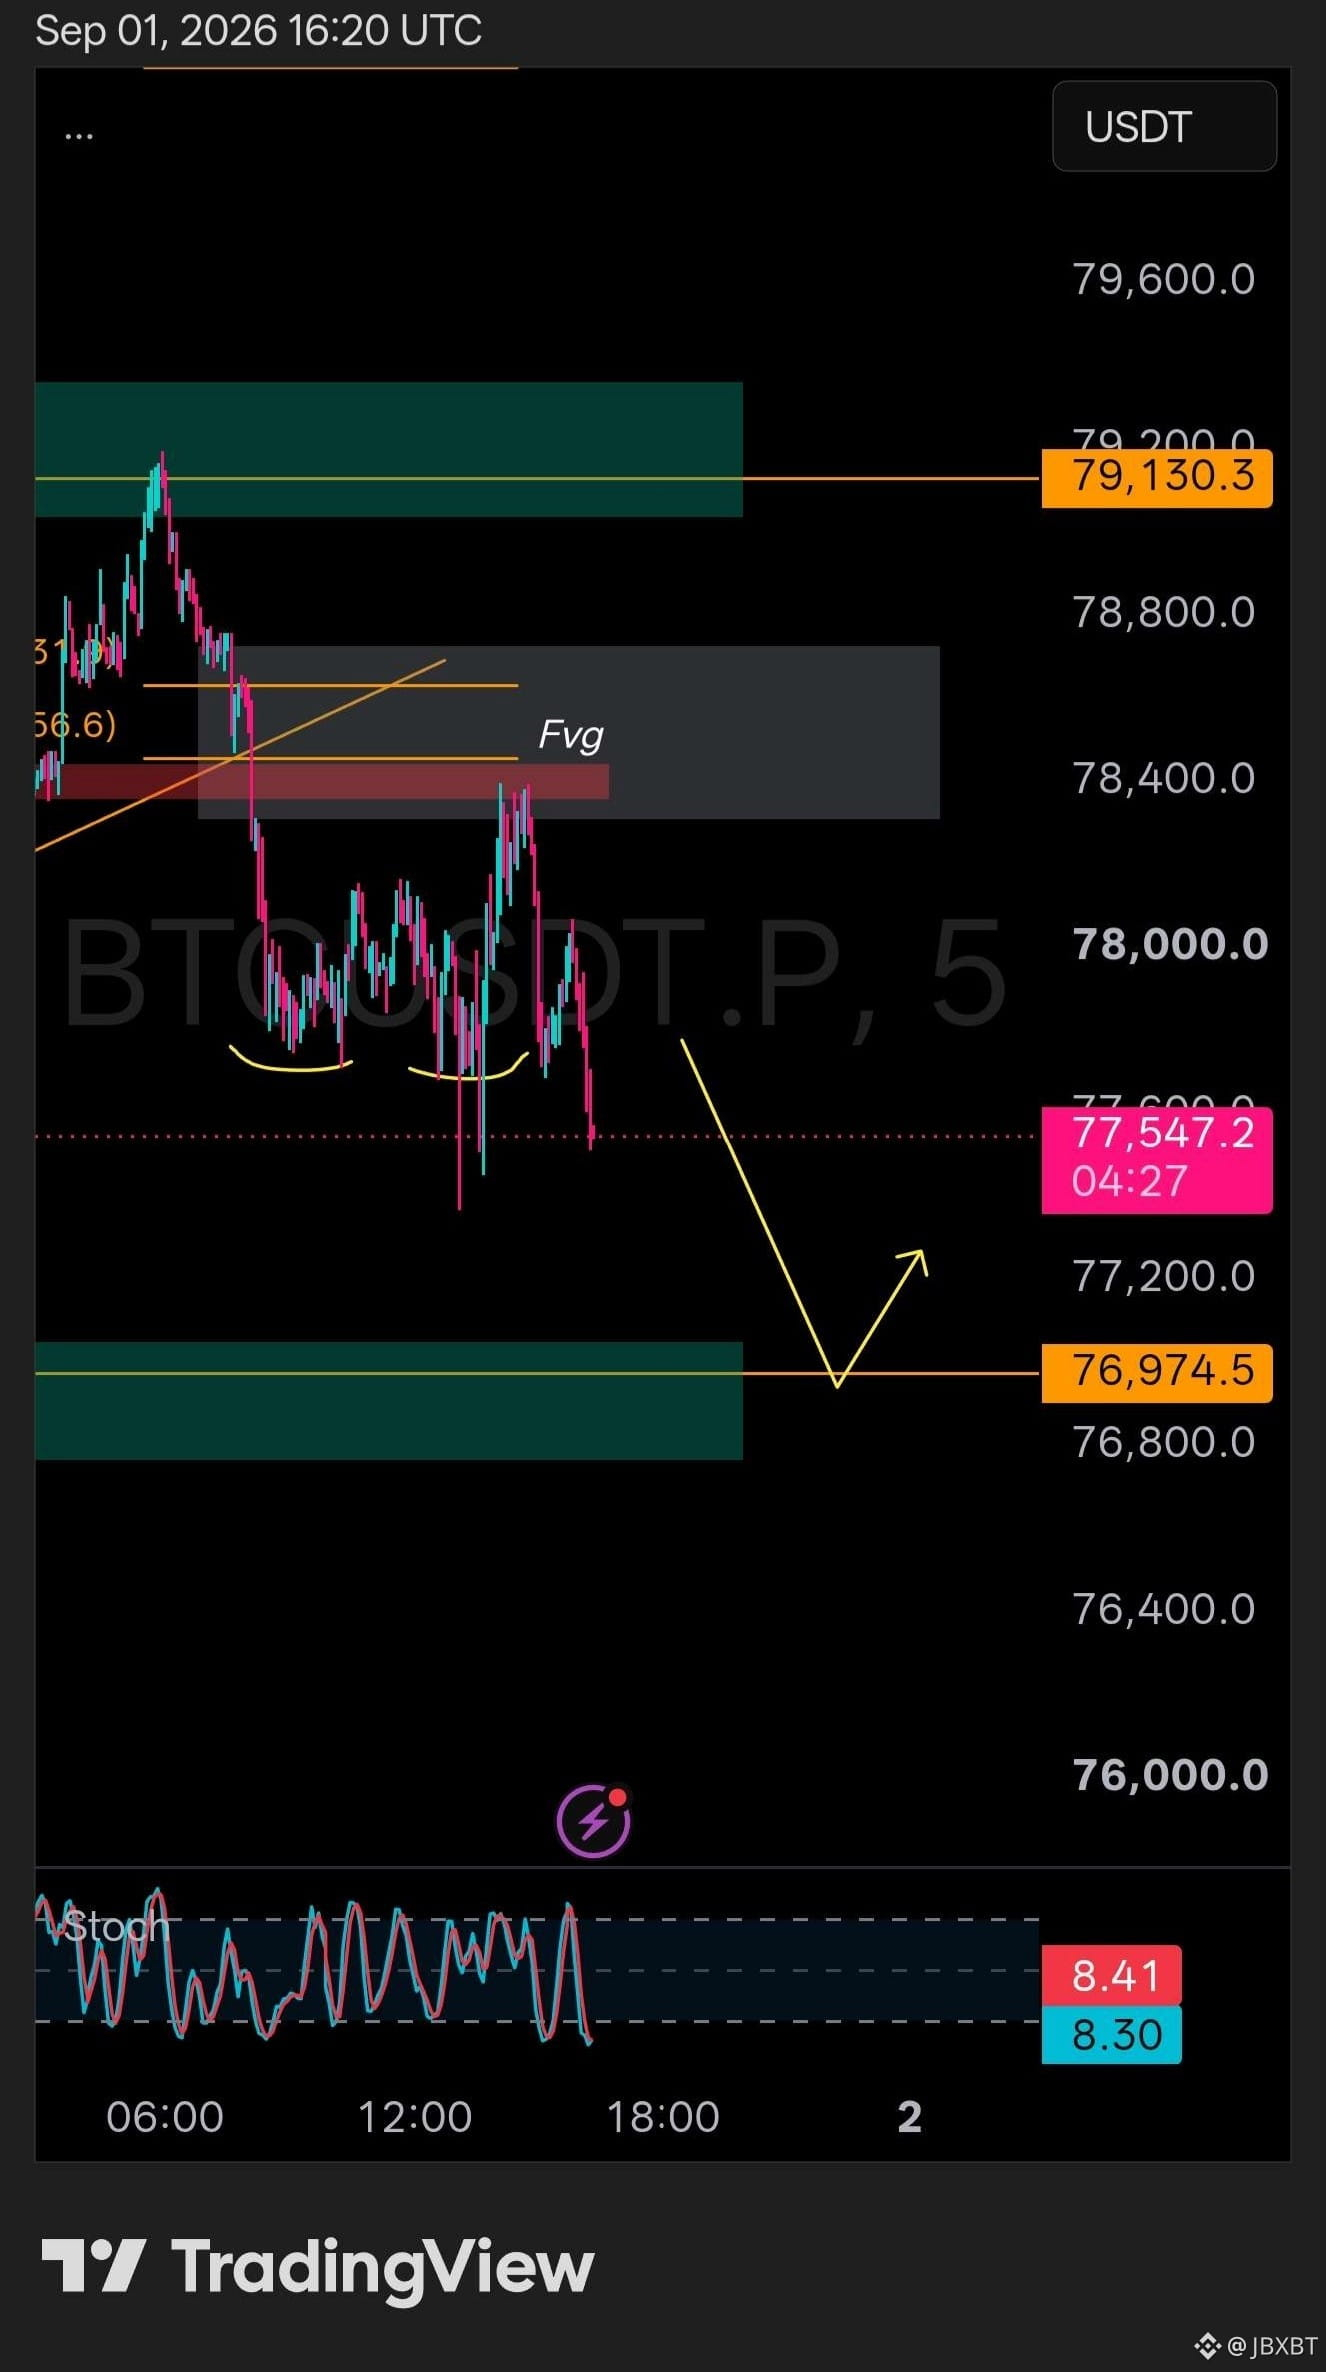
$BTC played as expected. Hope u guys enjoying my analysis!
JBXBT
·
--
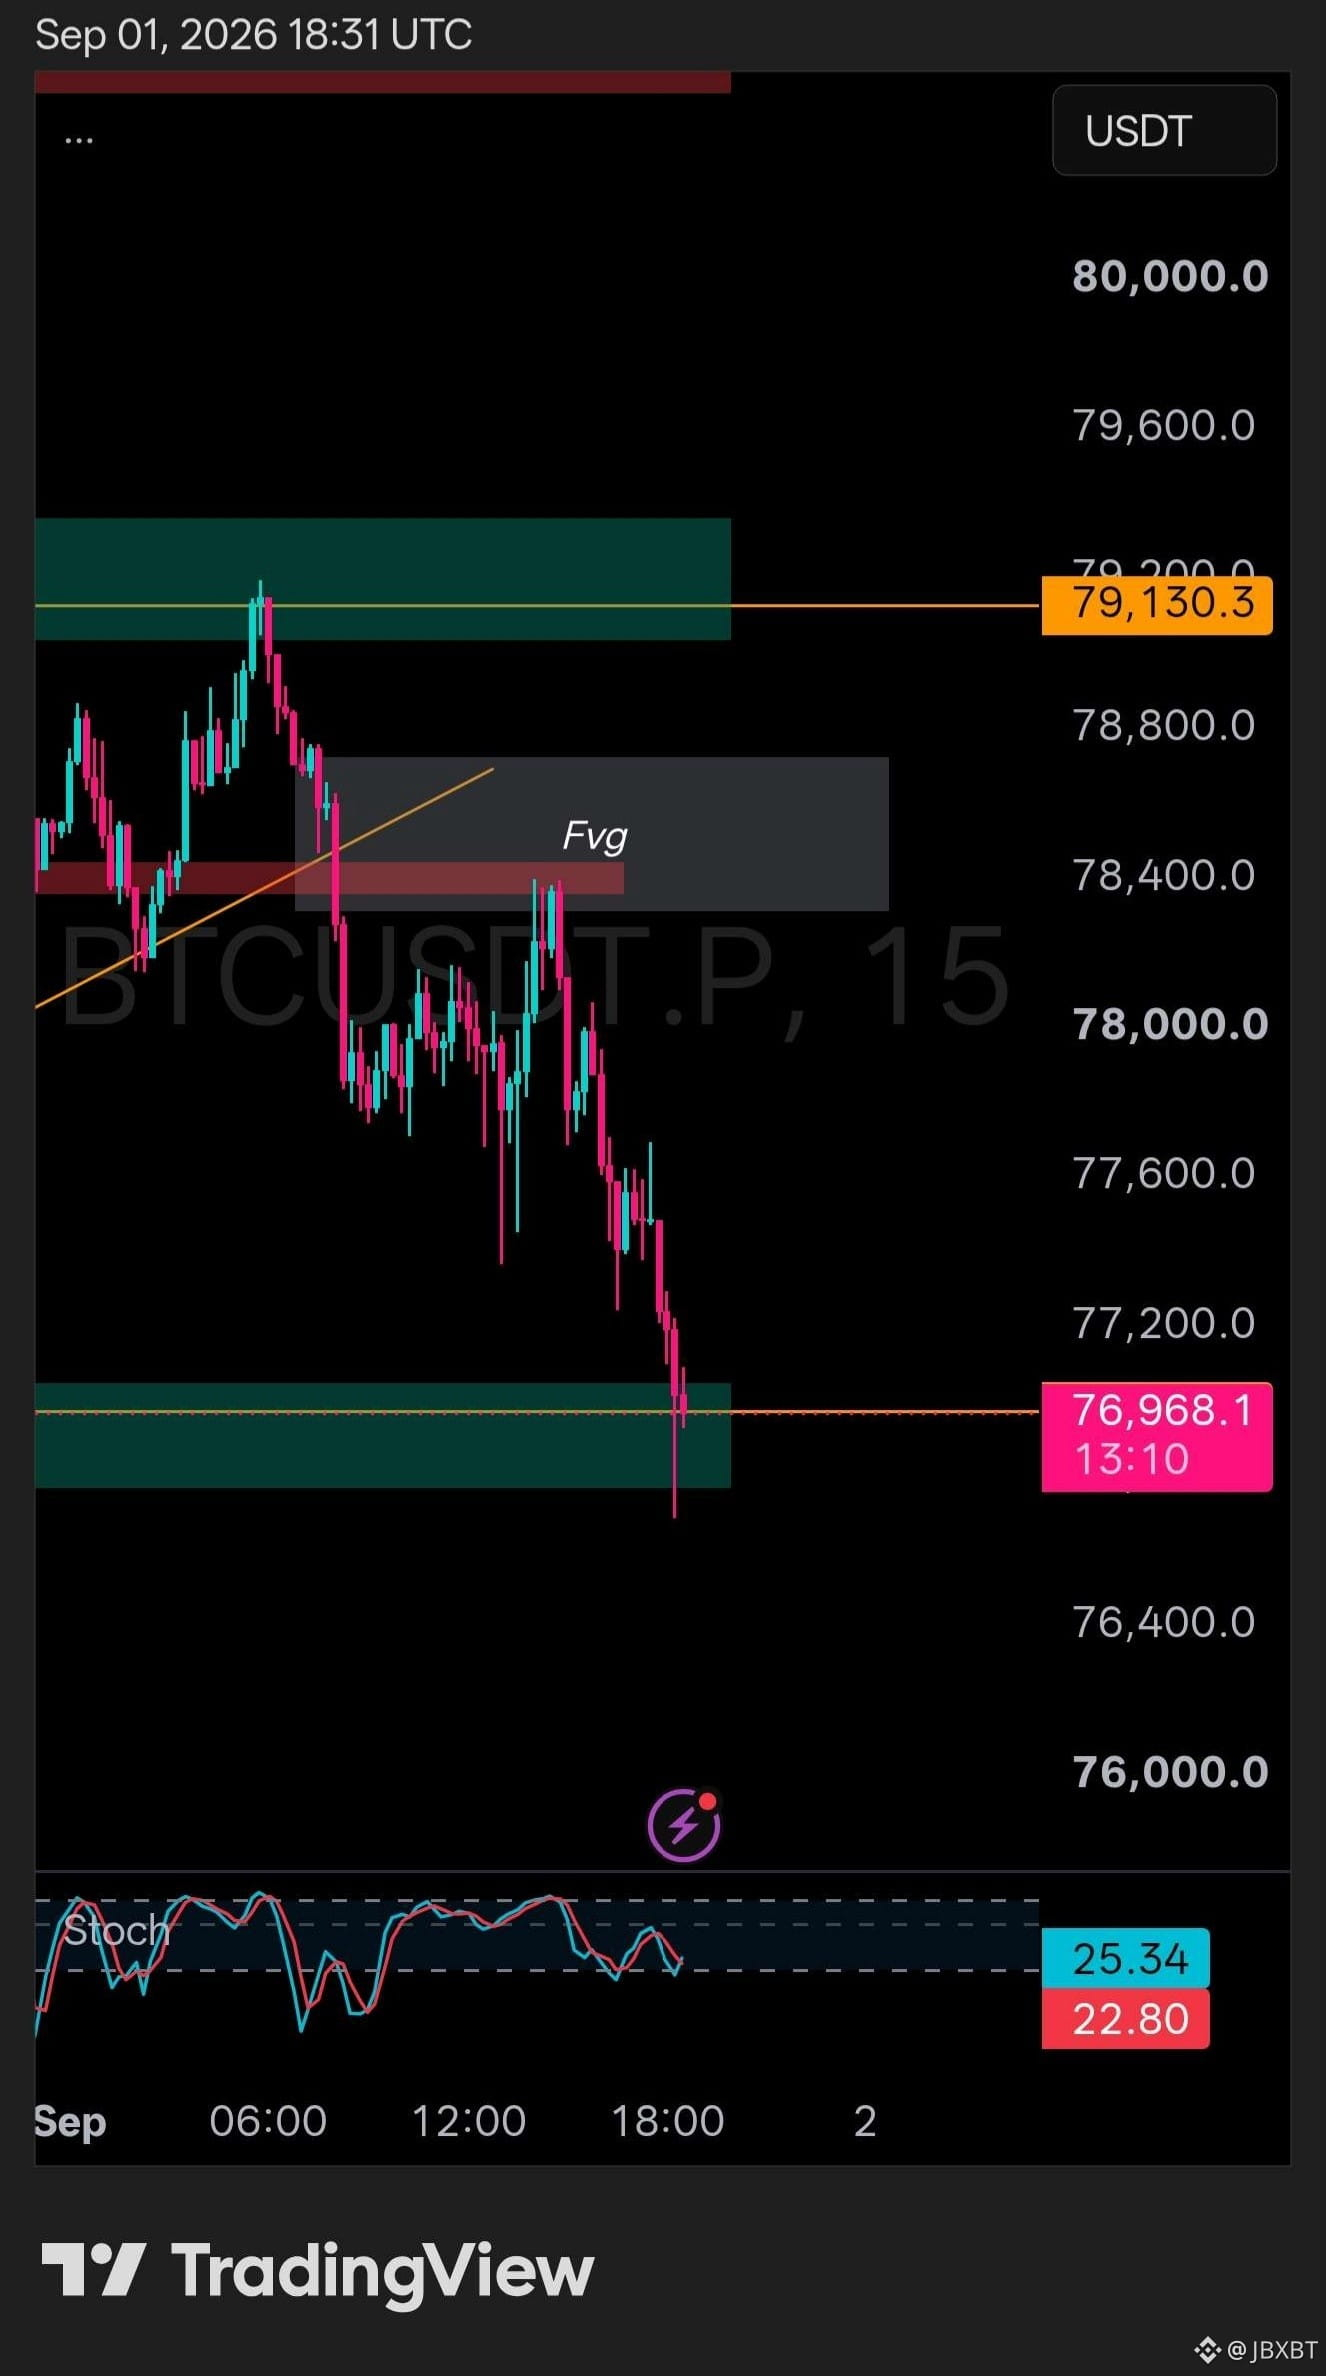
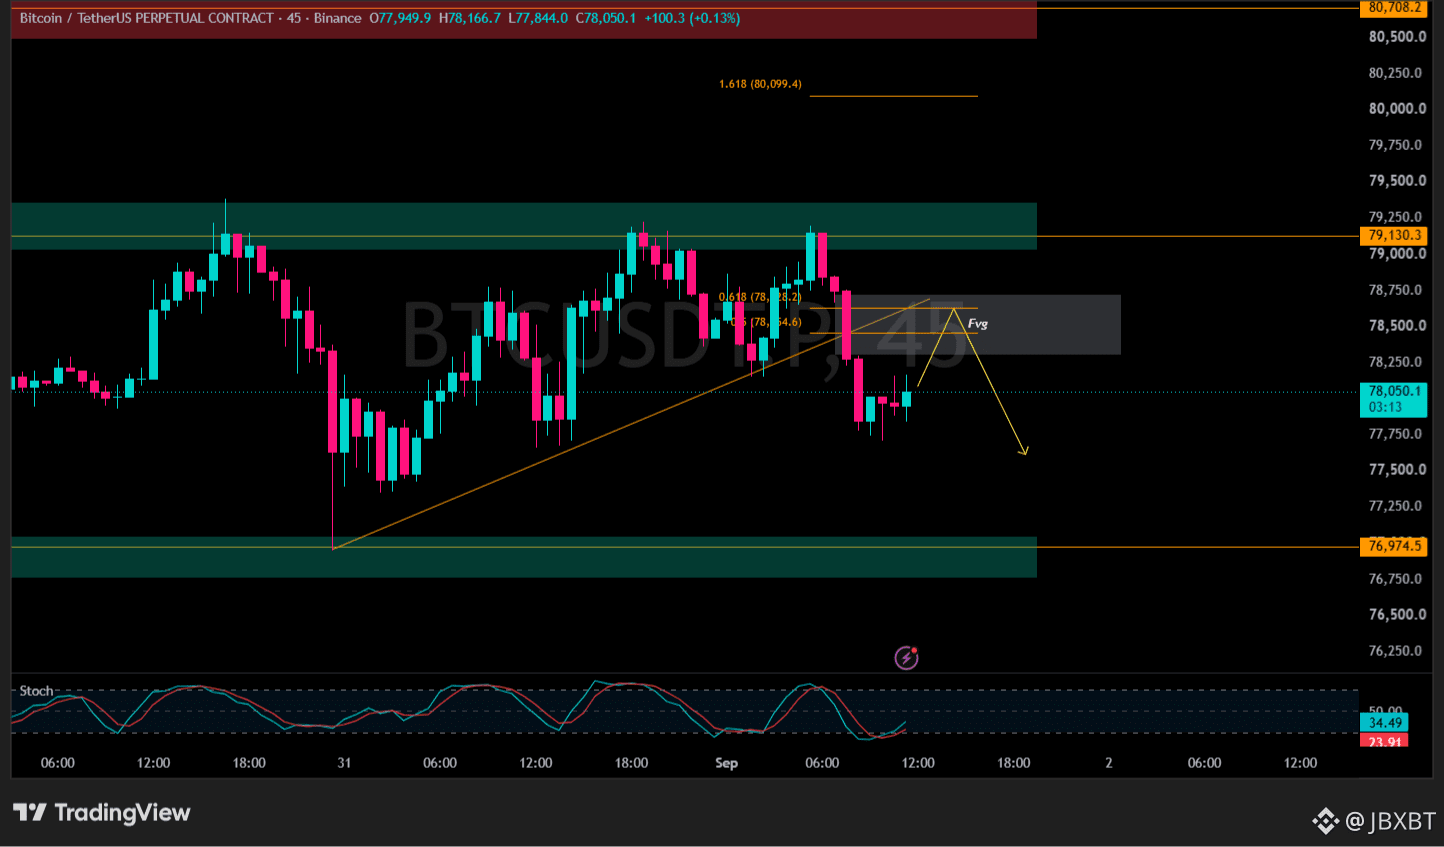
📊 **$BTC LTF Outlook** (1/9/2026)
This is what I’m currently expecting from BTC on the lower timeframes.
Yesterday, we saw a rejection from the resistance area, followed by a breakdown below the support trendline.
Now, I see a potential opportunity for price to reject again around the area I’ve marked here. This zone has multiple confluences: **the Fibonacci level, an FVG, and a potential retest of the trendline that was previously broken**. 👀📉
This is what I’m currently expecting from BTC on the lower timeframes.
Yesterday, we saw a rejection from the resistance area, followed by a breakdown below the support trendline.
Now, I see a potential opportunity for price to reject again around the area I’ve marked here. This zone has multiple confluences: **the Fibonacci level, an FVG, and a potential retest of the trendline that was previously broken**. 👀📉
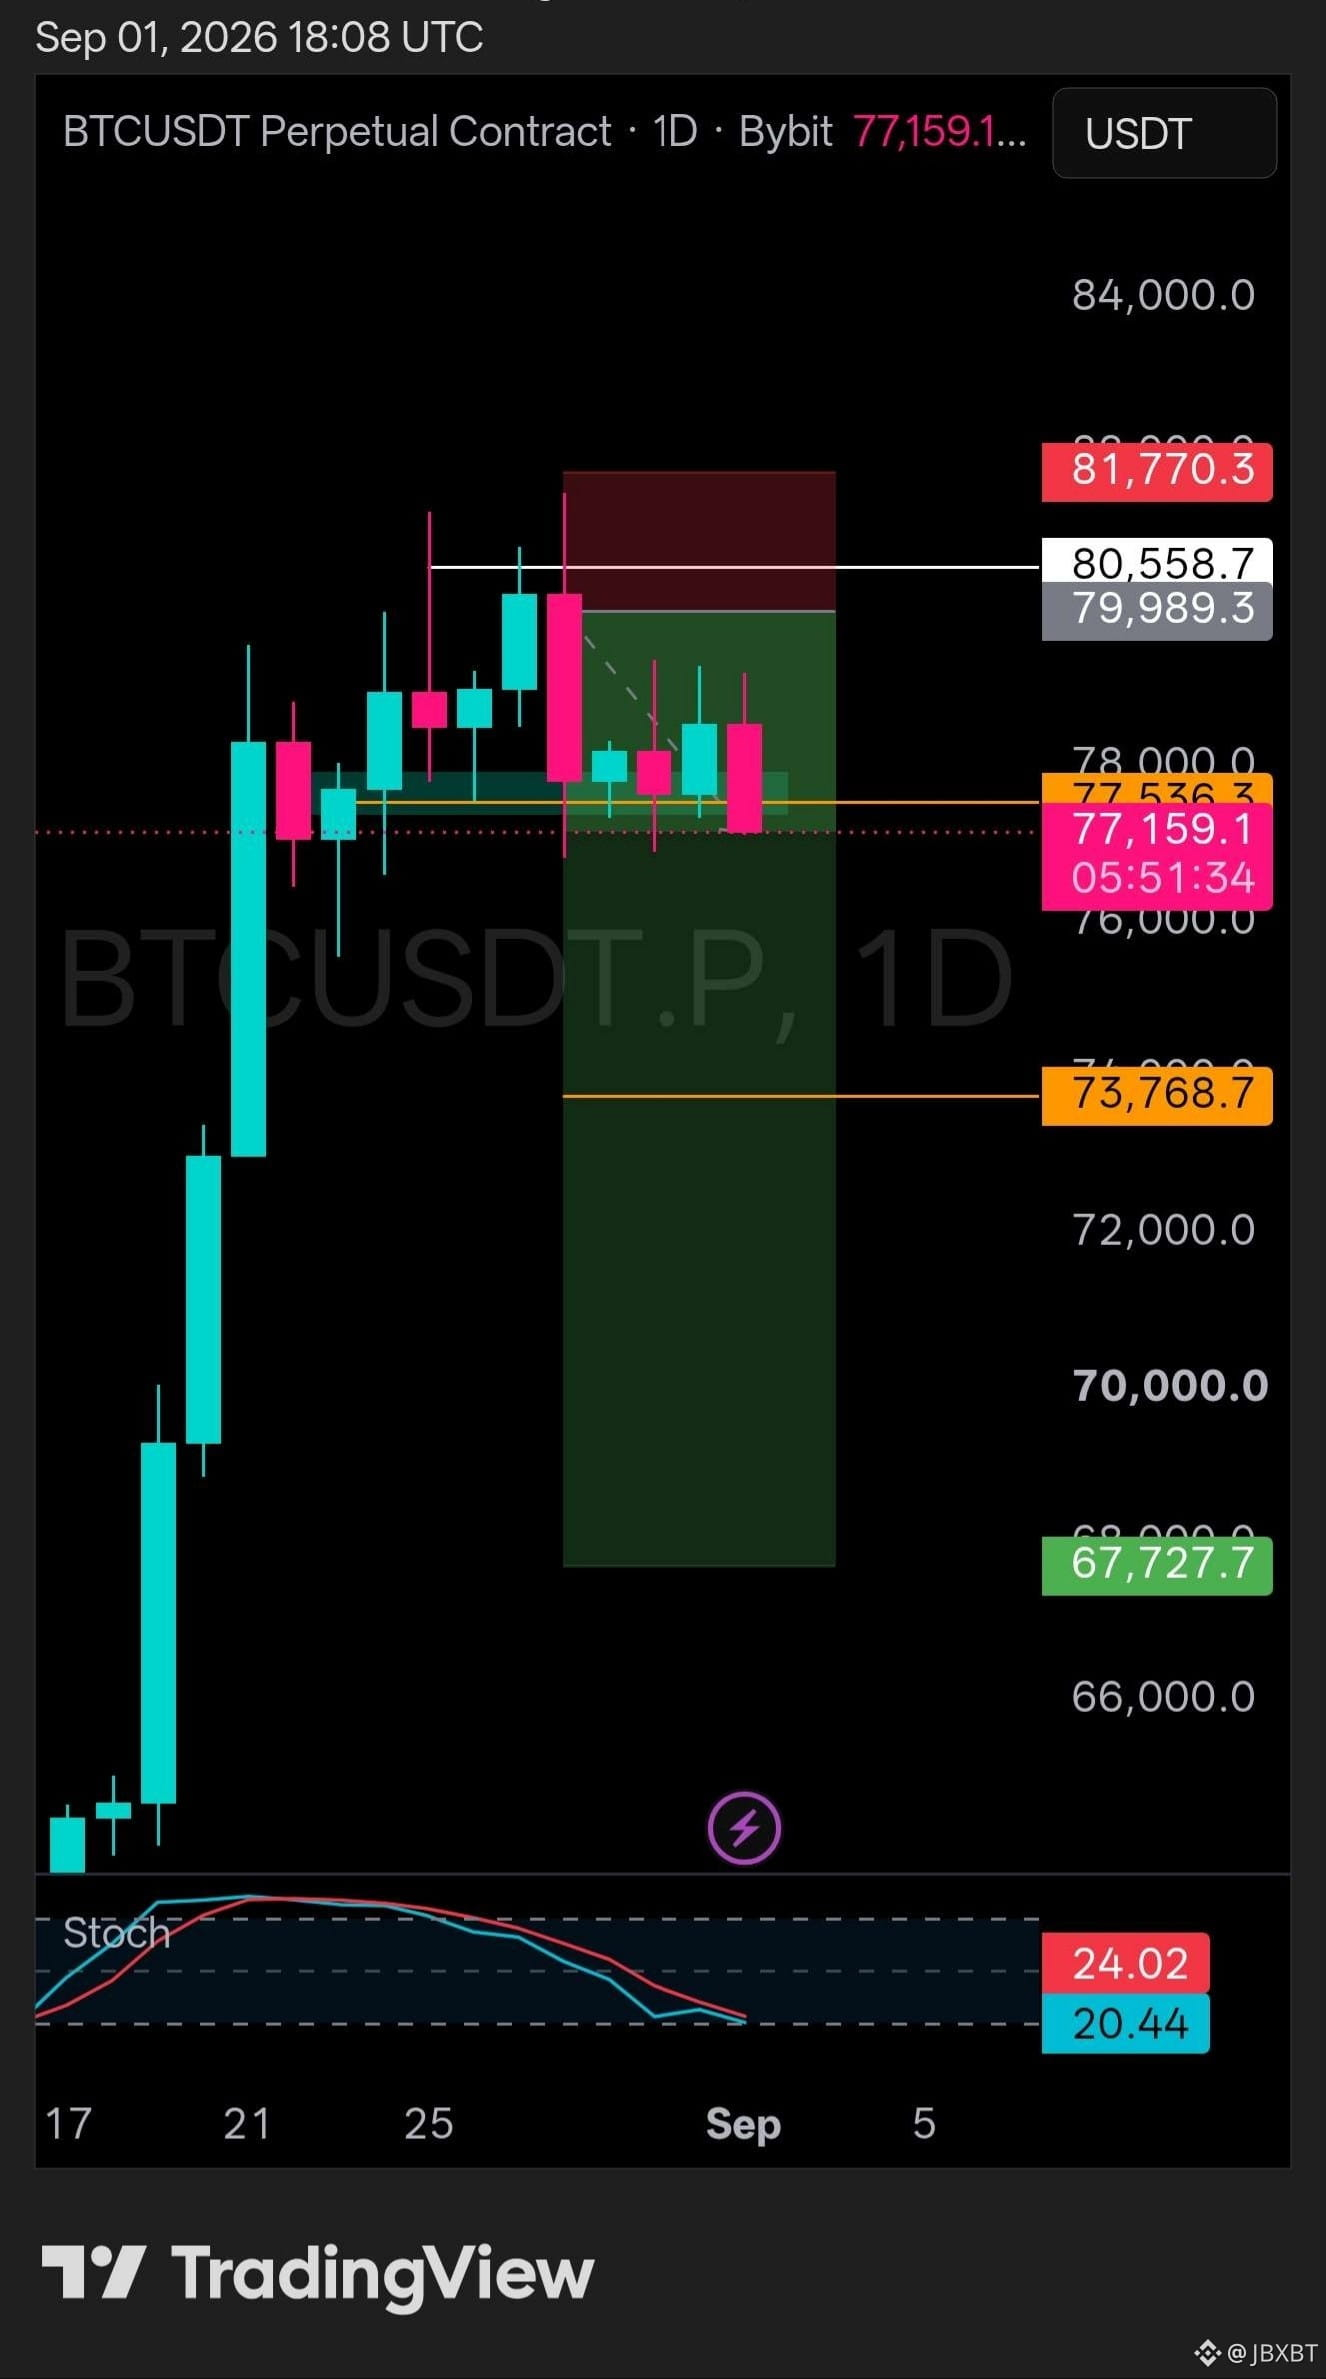
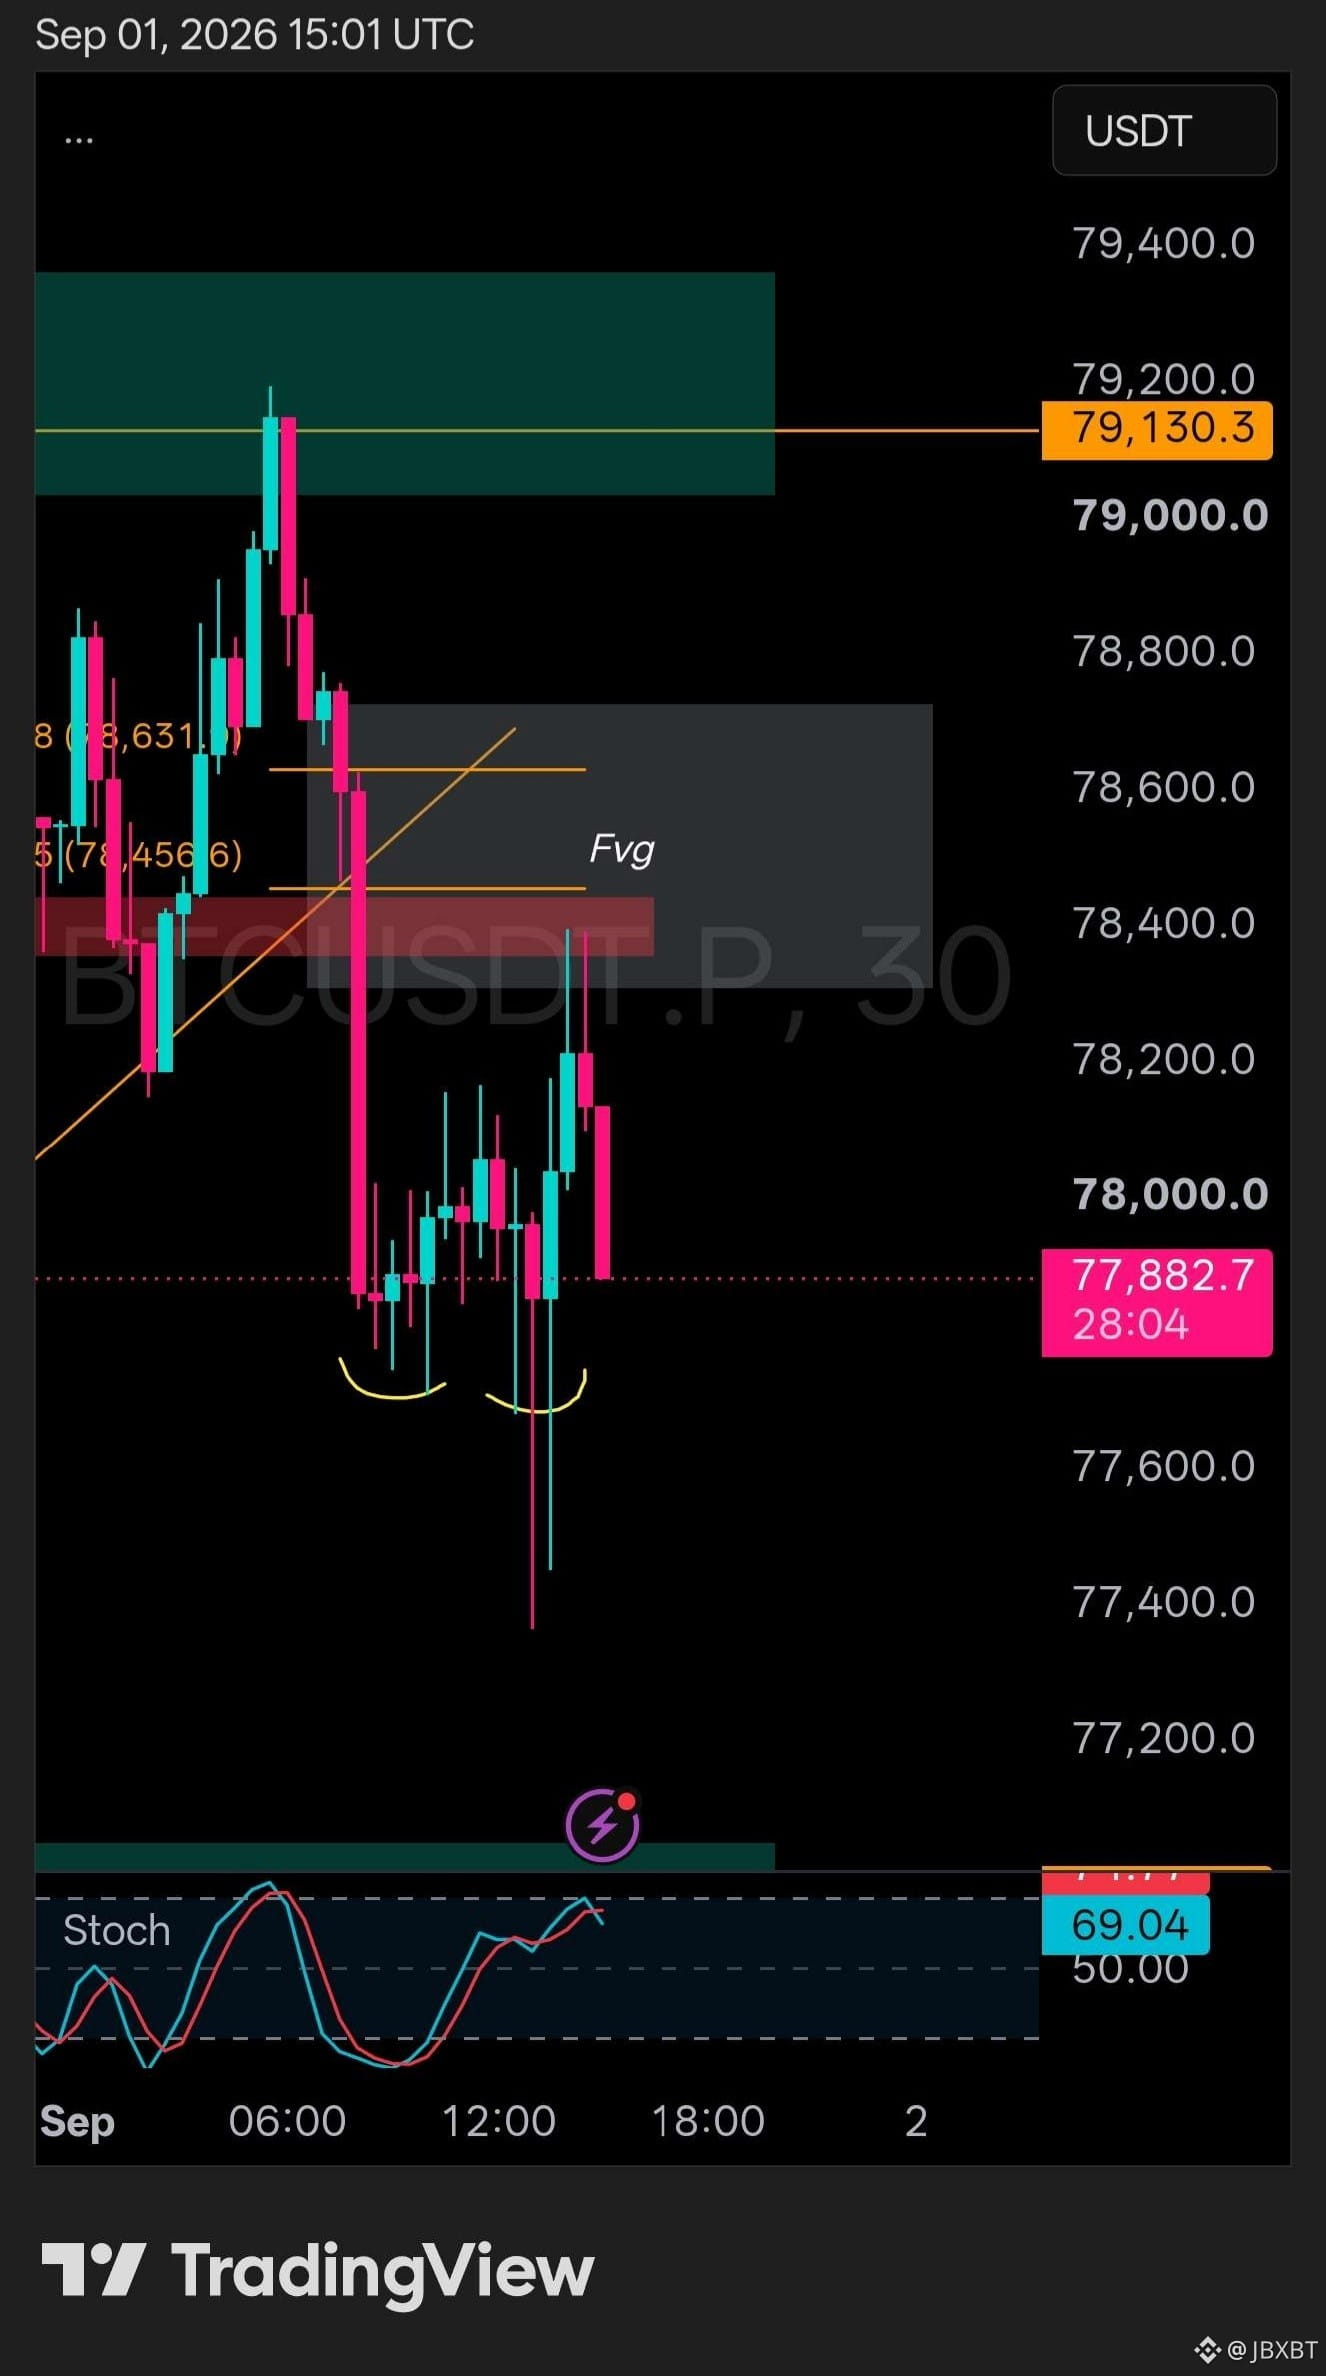
Rejected? $BTC 🤔
Reason? check on my latest btc update
Reason? check on my latest btc update
JBXBT
·
--
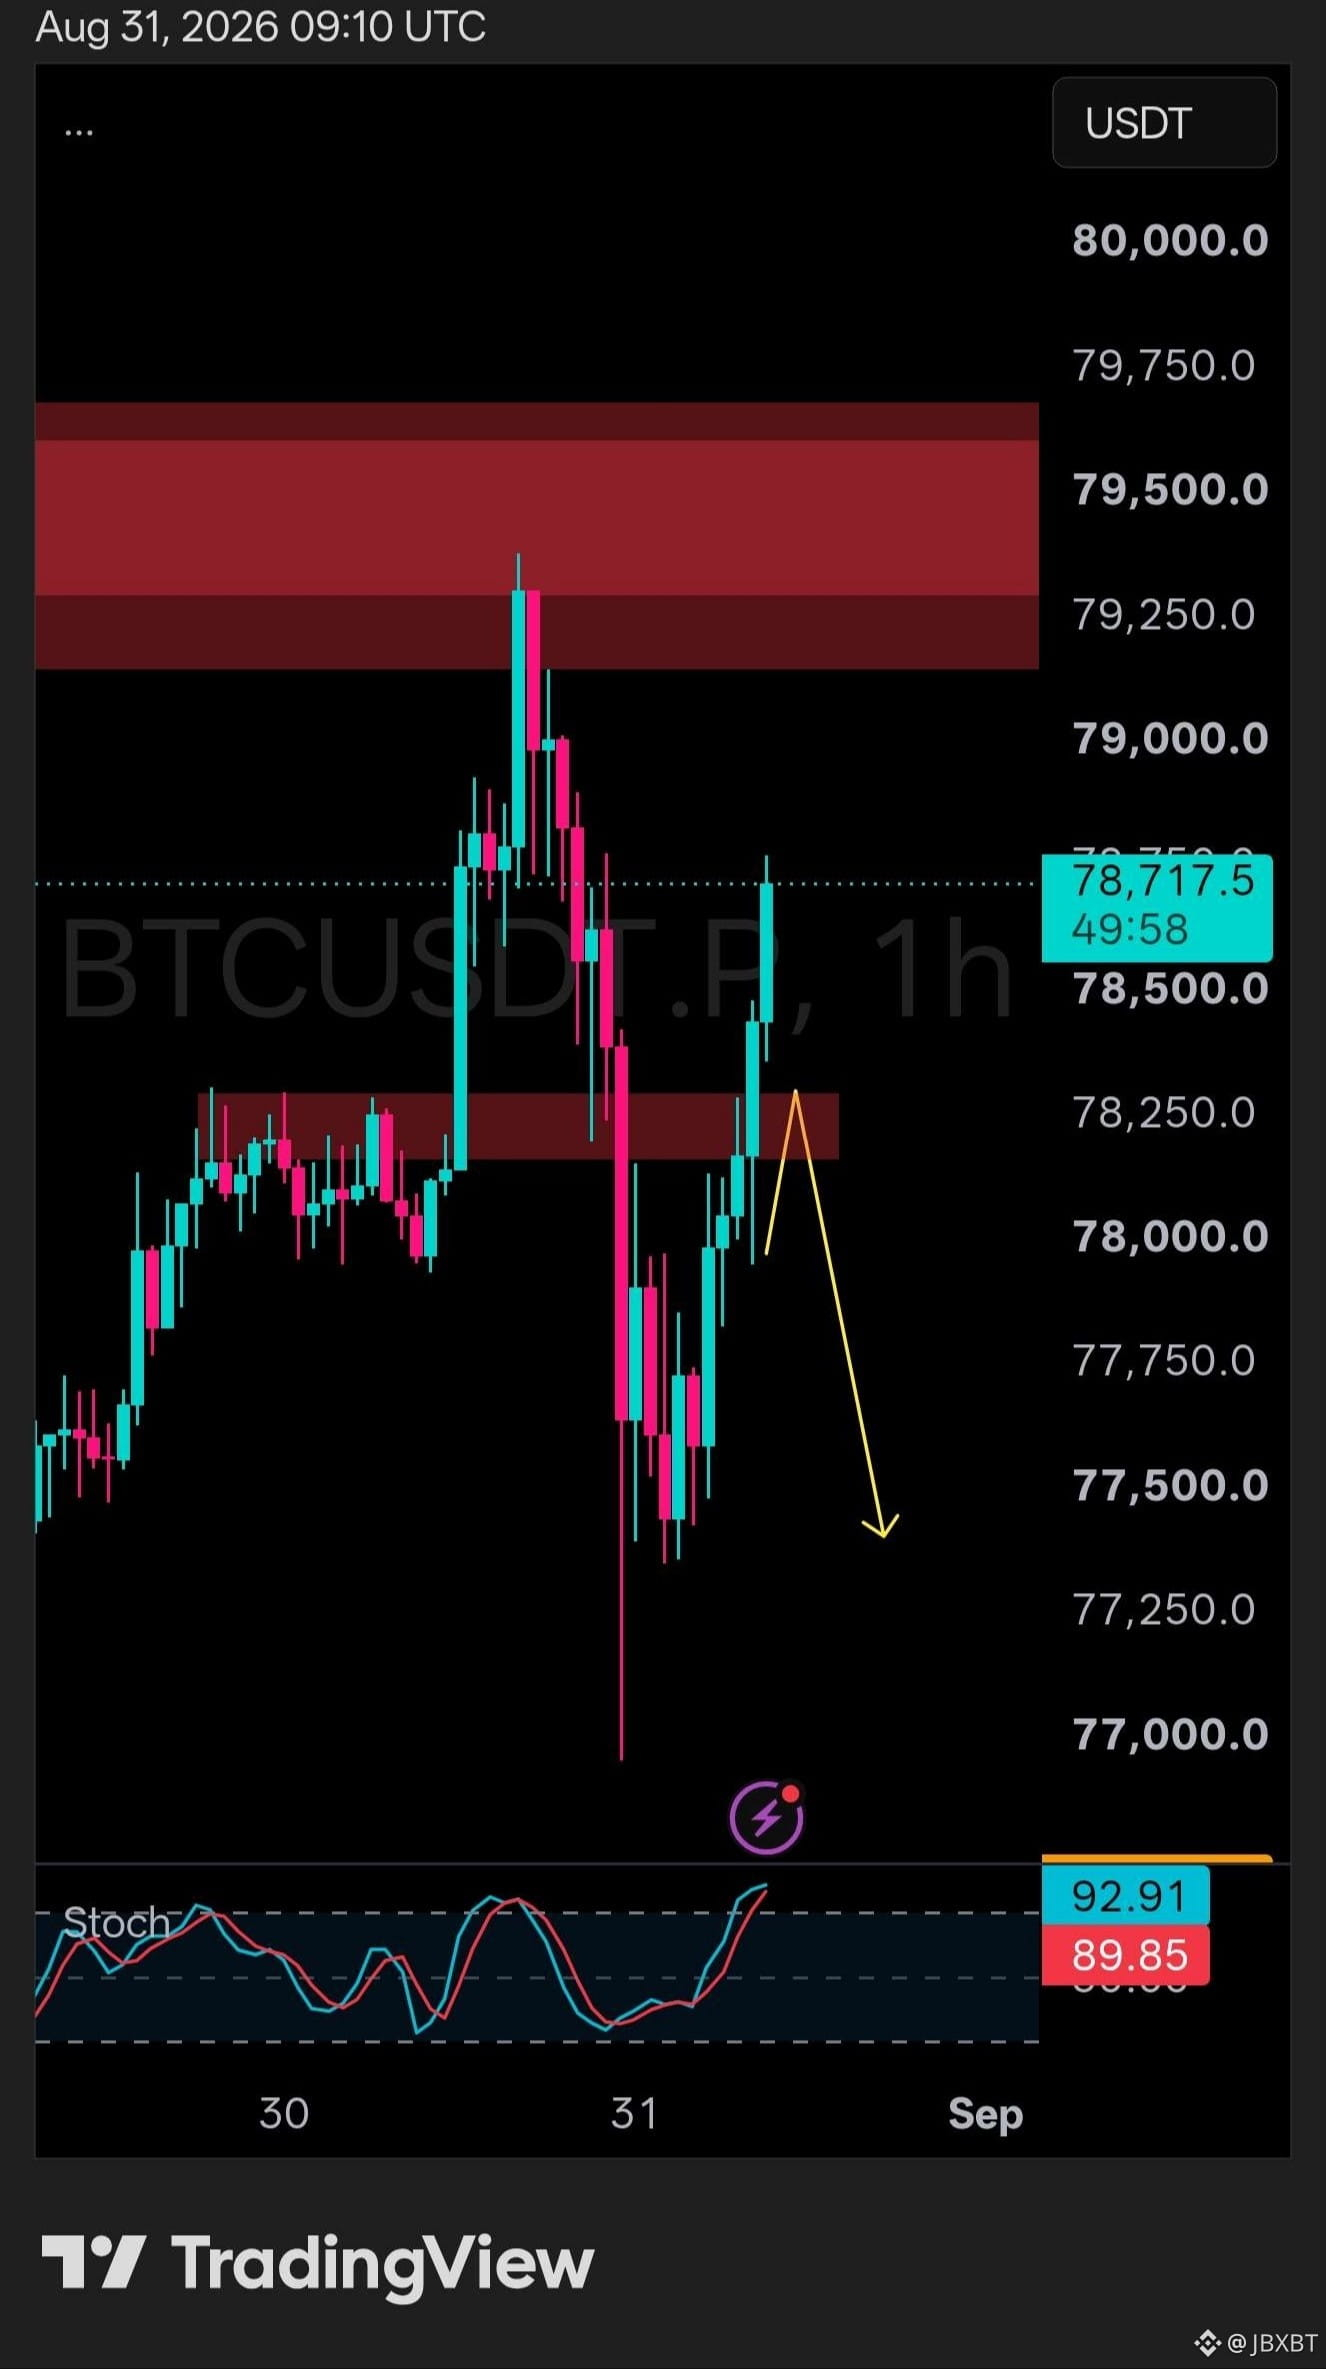
Bearish👑 **Where is $BTC heading next?**
Since we saw a fairly strong rejection from the Fibonacci level yesterday, I’m expecting further downside continuation.
To identify how high price could potentially move before rejecting again, we can draw another Fibonacci from the recent high to the low. This gives us the area I’ve marked on the chart.
If we get a decent candle close around that area, it could serve as a potential trigger for the next move**.
#BTC
Since we saw a fairly strong rejection from the Fibonacci level yesterday, I’m expecting further downside continuation.
To identify how high price could potentially move before rejecting again, we can draw another Fibonacci from the recent high to the low. This gives us the area I’ve marked on the chart.
If we get a decent candle close around that area, it could serve as a potential trigger for the next move**.
#BTC
📊 **$BTC LTF Outlook** (1/9/2026)
This is what I’m currently expecting from BTC on the lower timeframes.
Yesterday, we saw a rejection from the resistance area, followed by a breakdown below the support trendline.
Now, I see a potential opportunity for price to reject again around the area I’ve marked here. This zone has multiple confluences: **the Fibonacci level, an FVG, and a potential retest of the trendline that was previously broken**. 👀📉
This is what I’m currently expecting from BTC on the lower timeframes.
Yesterday, we saw a rejection from the resistance area, followed by a breakdown below the support trendline.
Now, I see a potential opportunity for price to reject again around the area I’ve marked here. This zone has multiple confluences: **the Fibonacci level, an FVG, and a potential retest of the trendline that was previously broken**. 👀📉
No trigger for $BTC ...still strong
JBXBT
·
--
Bearish👑 **Where is $BTC heading next?**
Since we saw a fairly strong rejection from the Fibonacci level yesterday, I’m expecting further downside continuation.
To identify how high price could potentially move before rejecting again, we can draw another Fibonacci from the recent high to the low. This gives us the area I’ve marked on the chart.
If we get a decent candle close around that area, it could serve as a potential trigger for the next move**.
#BTC
Since we saw a fairly strong rejection from the Fibonacci level yesterday, I’m expecting further downside continuation.
To identify how high price could potentially move before rejecting again, we can draw another Fibonacci from the recent high to the low. This gives us the area I’ve marked on the chart.
If we get a decent candle close around that area, it could serve as a potential trigger for the next move**.
#BTC
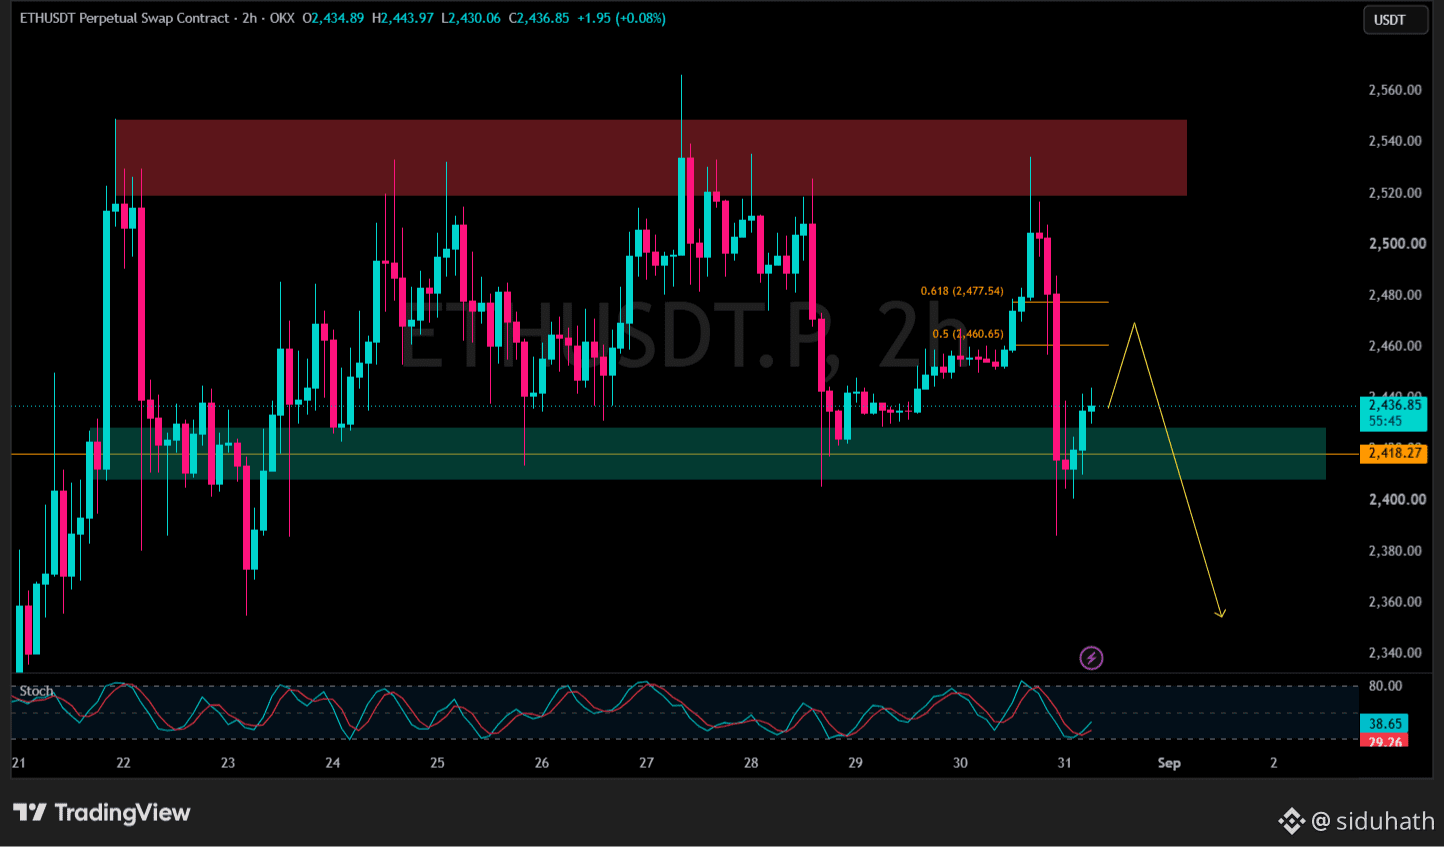
**📊 $ETH Similar to BTC**
We can also see ETH ranging between these two boxes. However, yesterday’s rejection was quite strong, especially when looking at the H4 candles. Because of that, I expect any further upside to potentially reach only the Fibonacci Golden Ratio area before continuing lower.
We can also see ETH ranging between these two boxes. However, yesterday’s rejection was quite strong, especially when looking at the H4 candles. Because of that, I expect any further upside to potentially reach only the Fibonacci Golden Ratio area before continuing lower.
👑 **Where is $BTC heading next?**
Since we saw a fairly strong rejection from the Fibonacci level yesterday, I’m expecting further downside continuation.
To identify how high price could potentially move before rejecting again, we can draw another Fibonacci from the recent high to the low. This gives us the area I’ve marked on the chart.
If we get a decent candle close around that area, it could serve as a potential trigger for the next move**.
#BTC
Since we saw a fairly strong rejection from the Fibonacci level yesterday, I’m expecting further downside continuation.
To identify how high price could potentially move before rejecting again, we can draw another Fibonacci from the recent high to the low. This gives us the area I’ve marked on the chart.
If we get a decent candle close around that area, it could serve as a potential trigger for the next move**.
#BTC
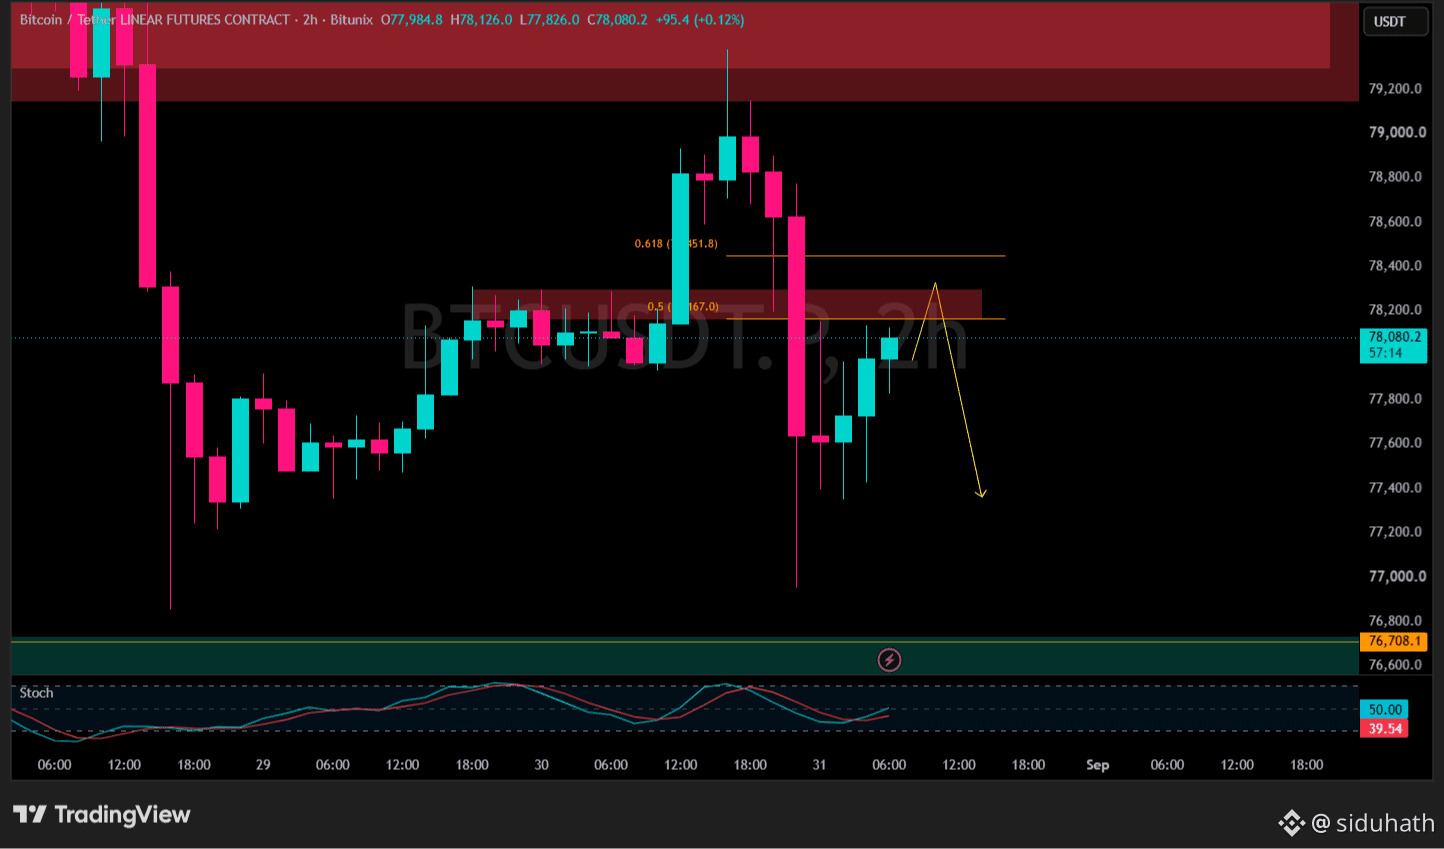
no reaction. stopped
JBXBT
·
--
Bullish$1k to $2k Challenge is Live
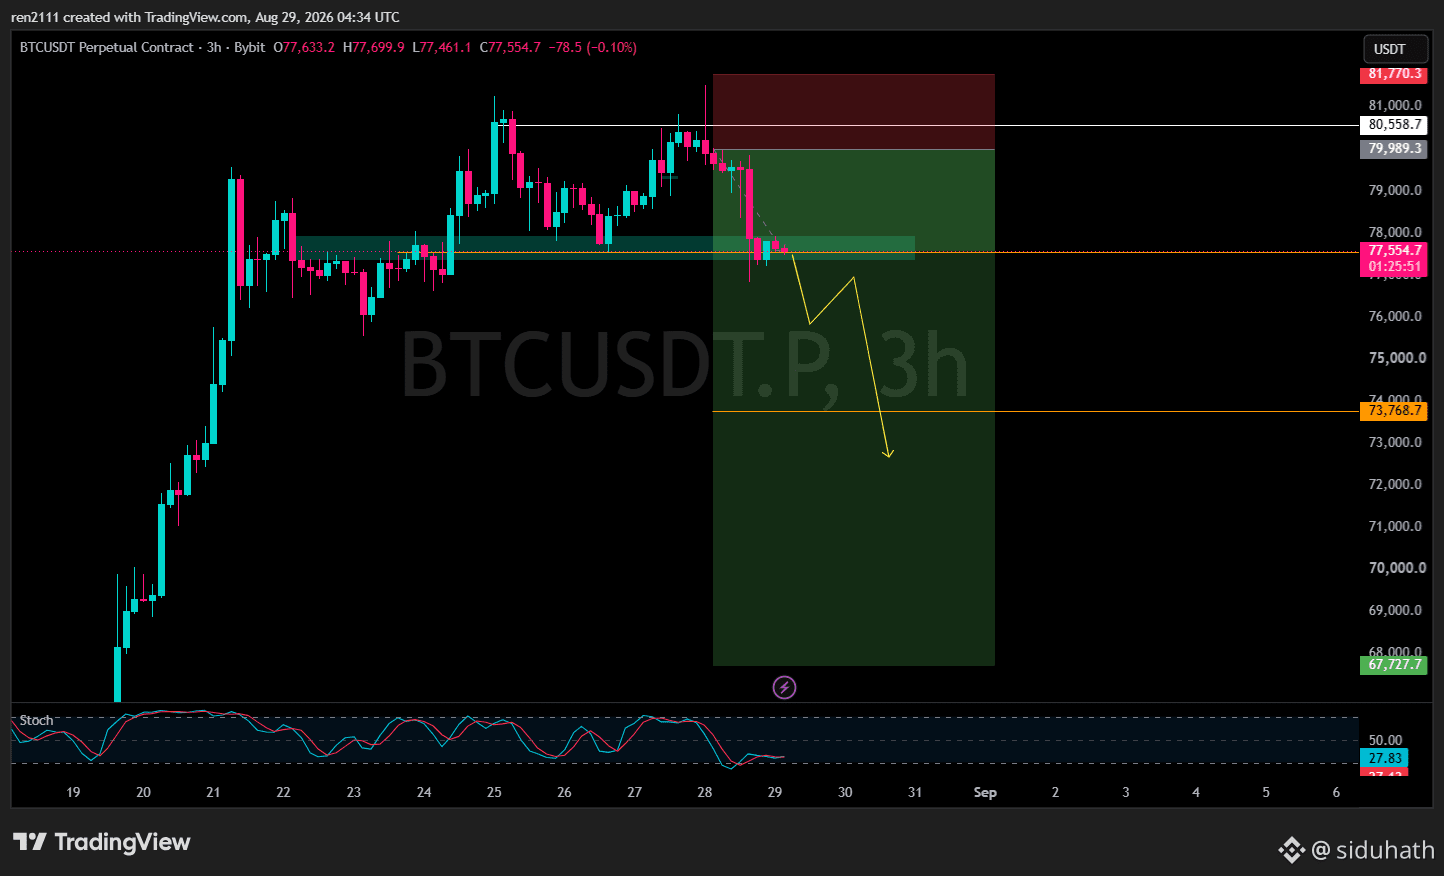
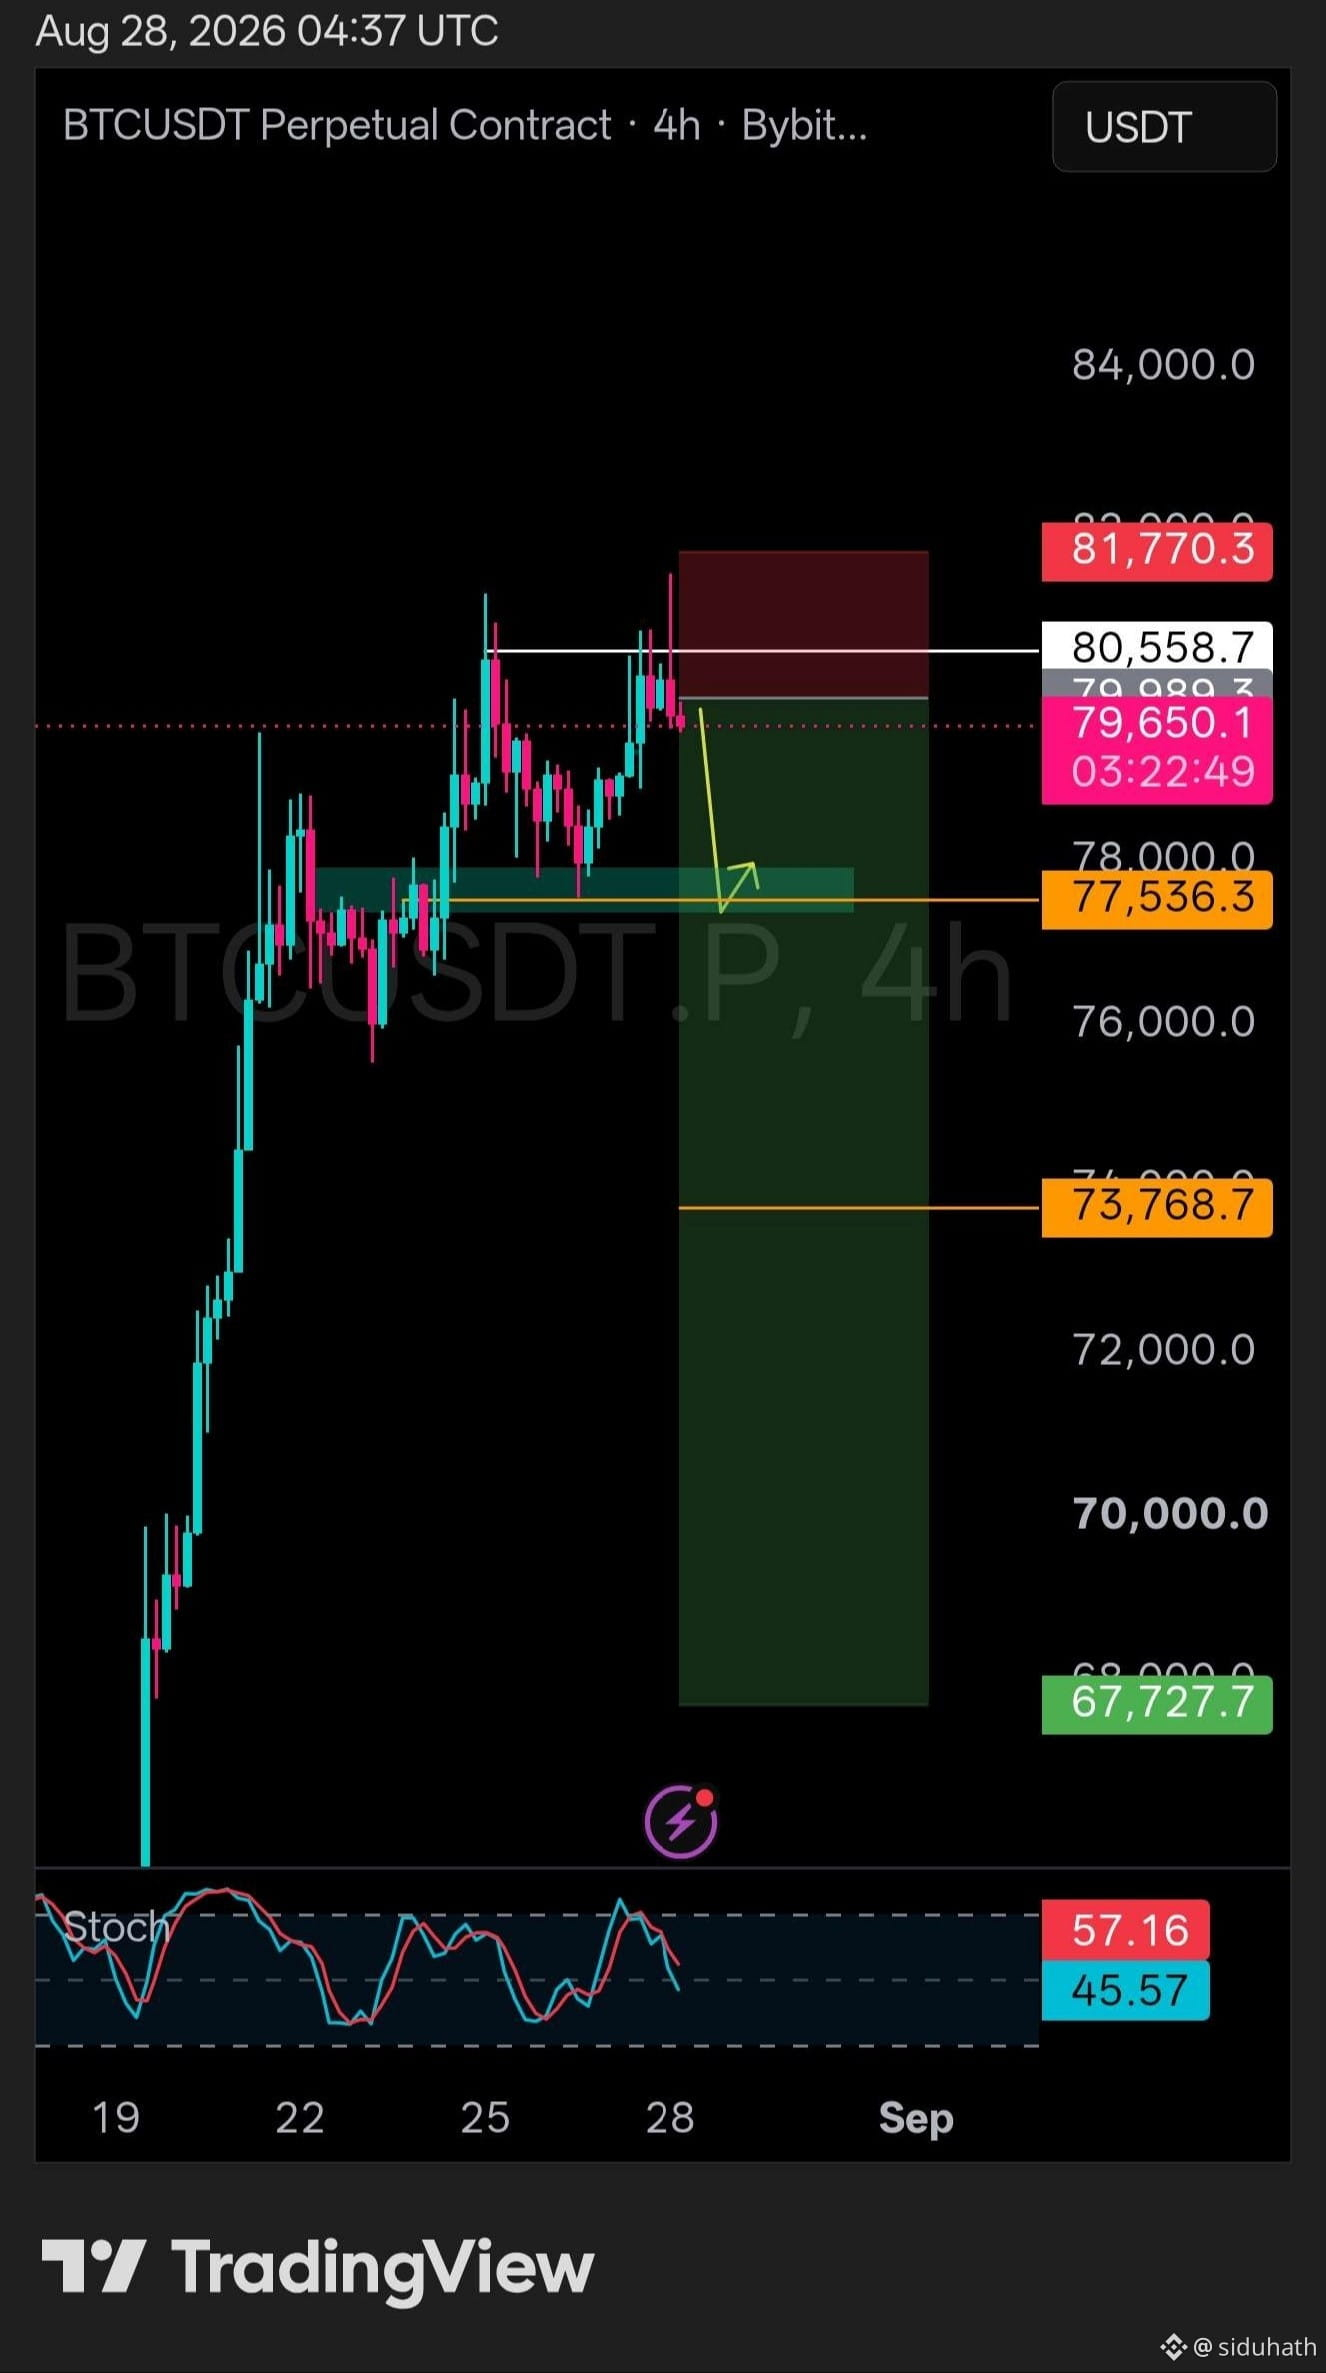
$BTC closed at BE
JBXBT
·
--
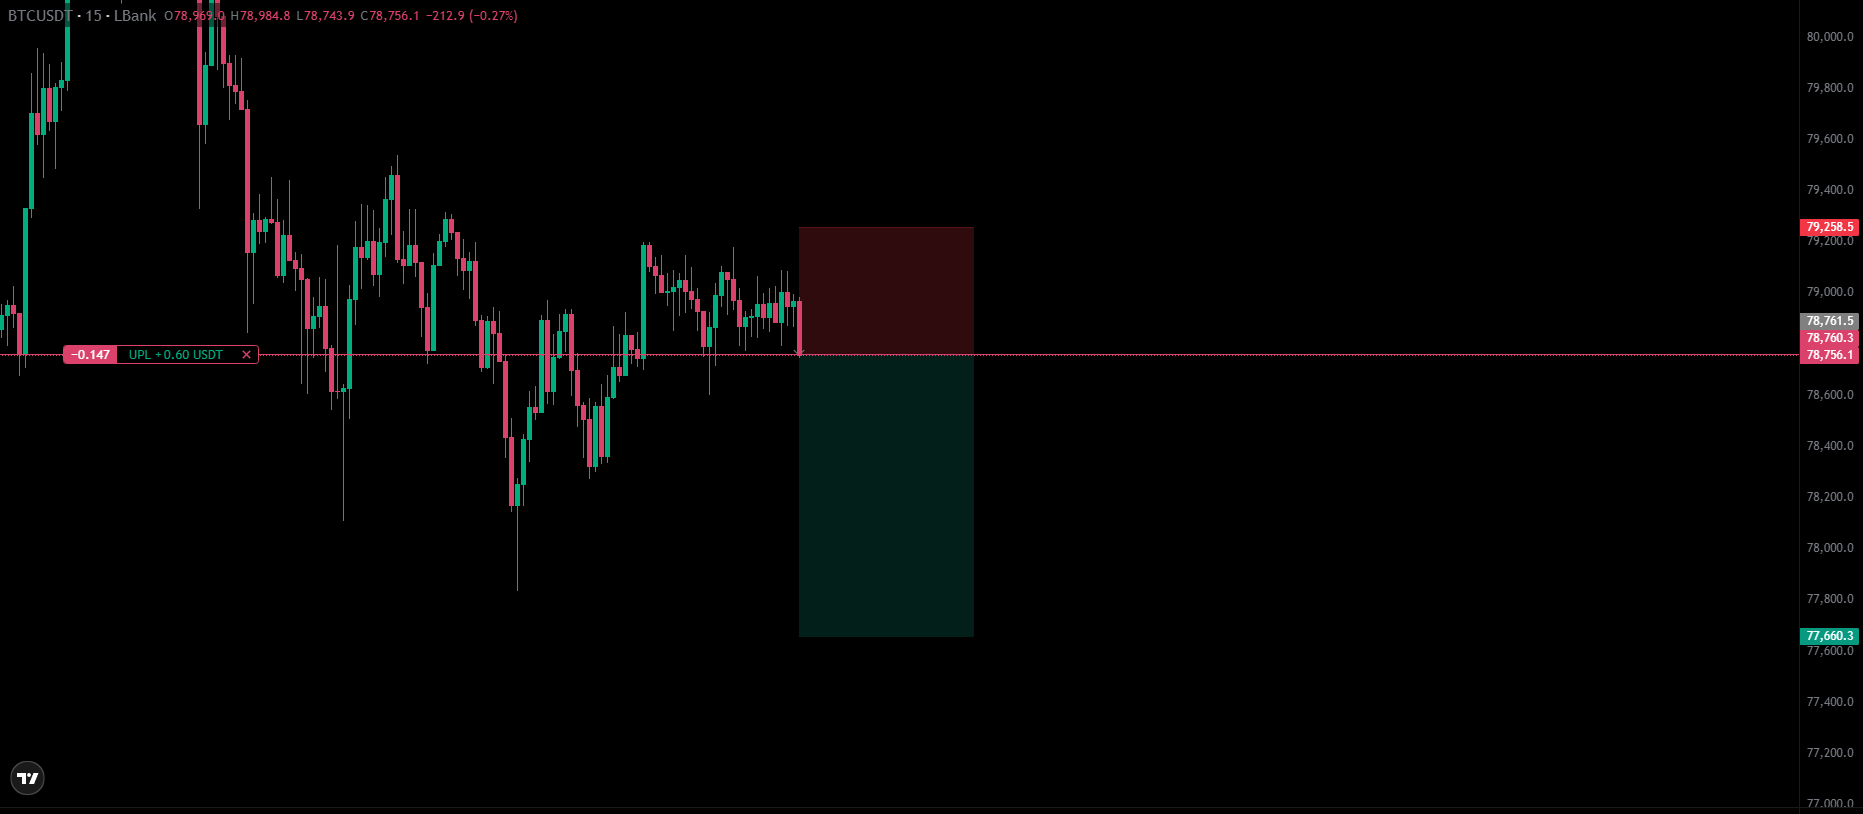
BearishShort $BTC
Entry: 78761.0$
TP: 77658.7$
SL: M15 Candle close above 79257.4$
Entry: 78761.0$
TP: 77658.7$
SL: M15 Candle close above 79257.4$
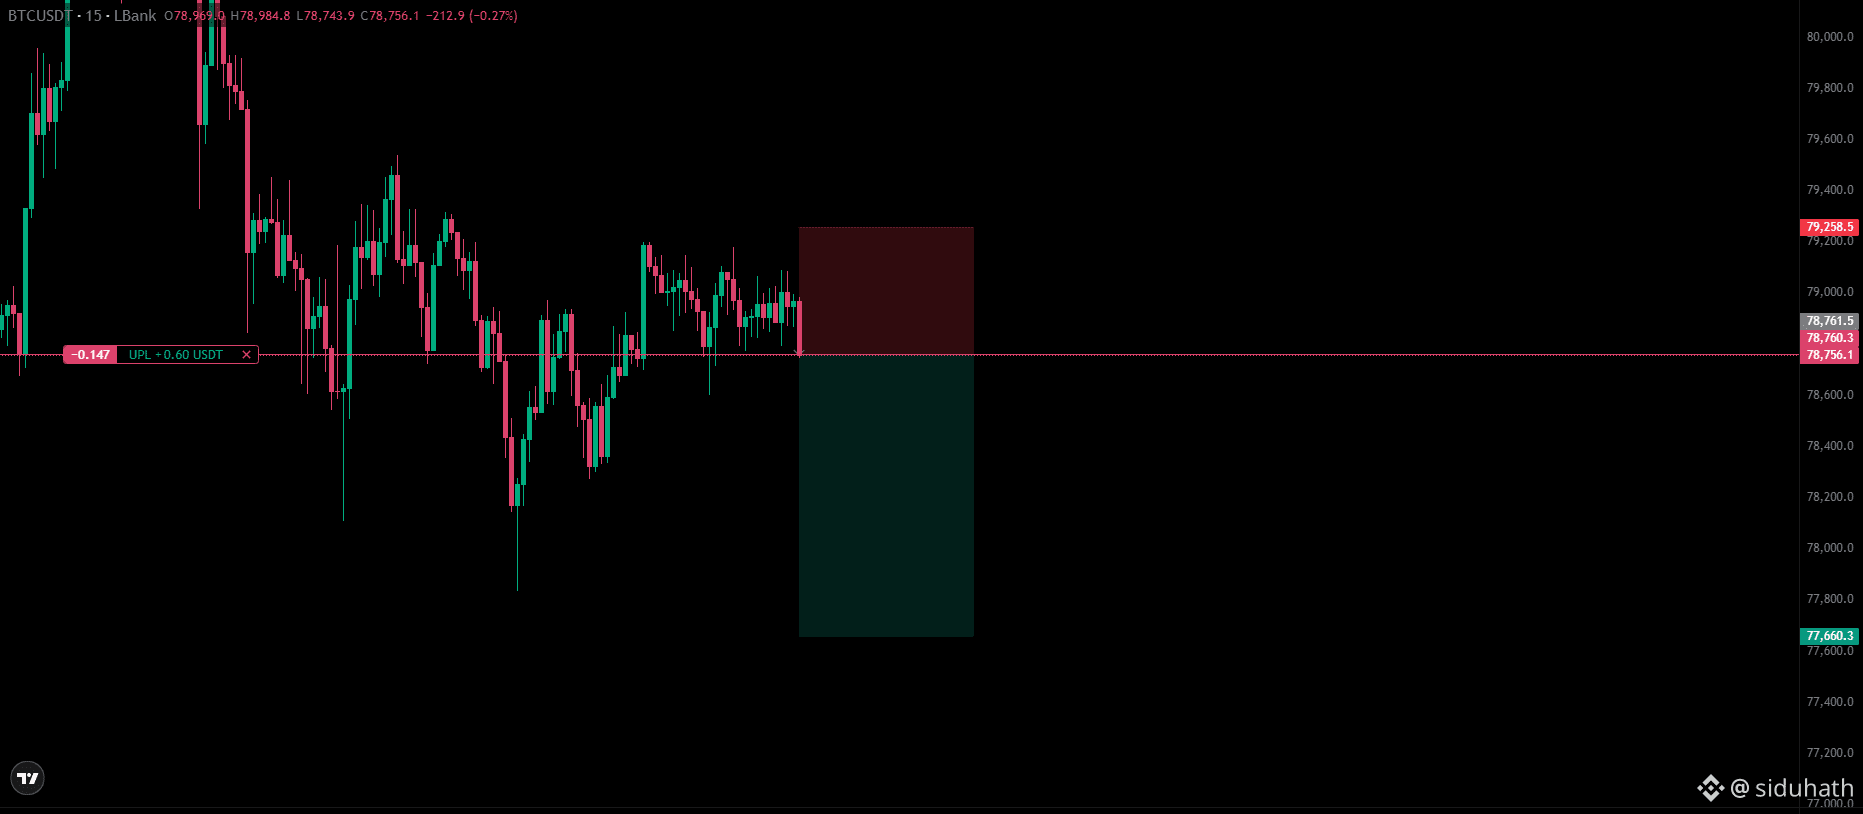
Short $BTC
Entry: 78761.0$
TP: 77658.7$
SL: M15 Candle close above 79257.4$
Entry: 78761.0$
TP: 77658.7$
SL: M15 Candle close above 79257.4$
JBXBT
·
--
Bullish$1k to $2k Challenge is Live
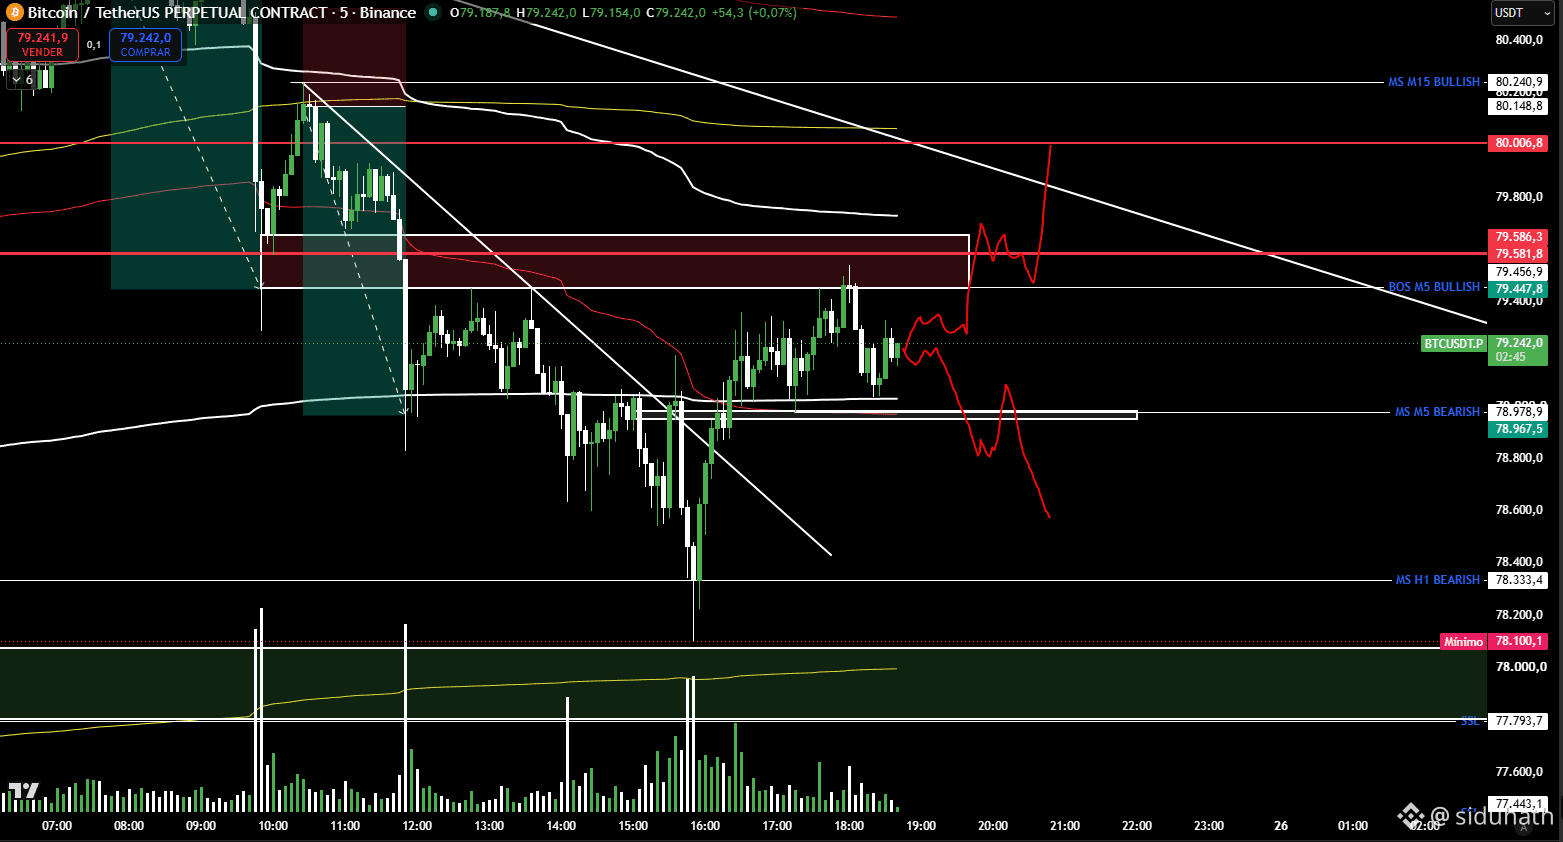
$BTC Honestly, it's taking us a long time to move lower, and that's not entirely good. We need to see a breakdown of this accumulation pattern accompanied by volume for a bearish continuation. Otherwise, we could head toward $80,000–$80,200
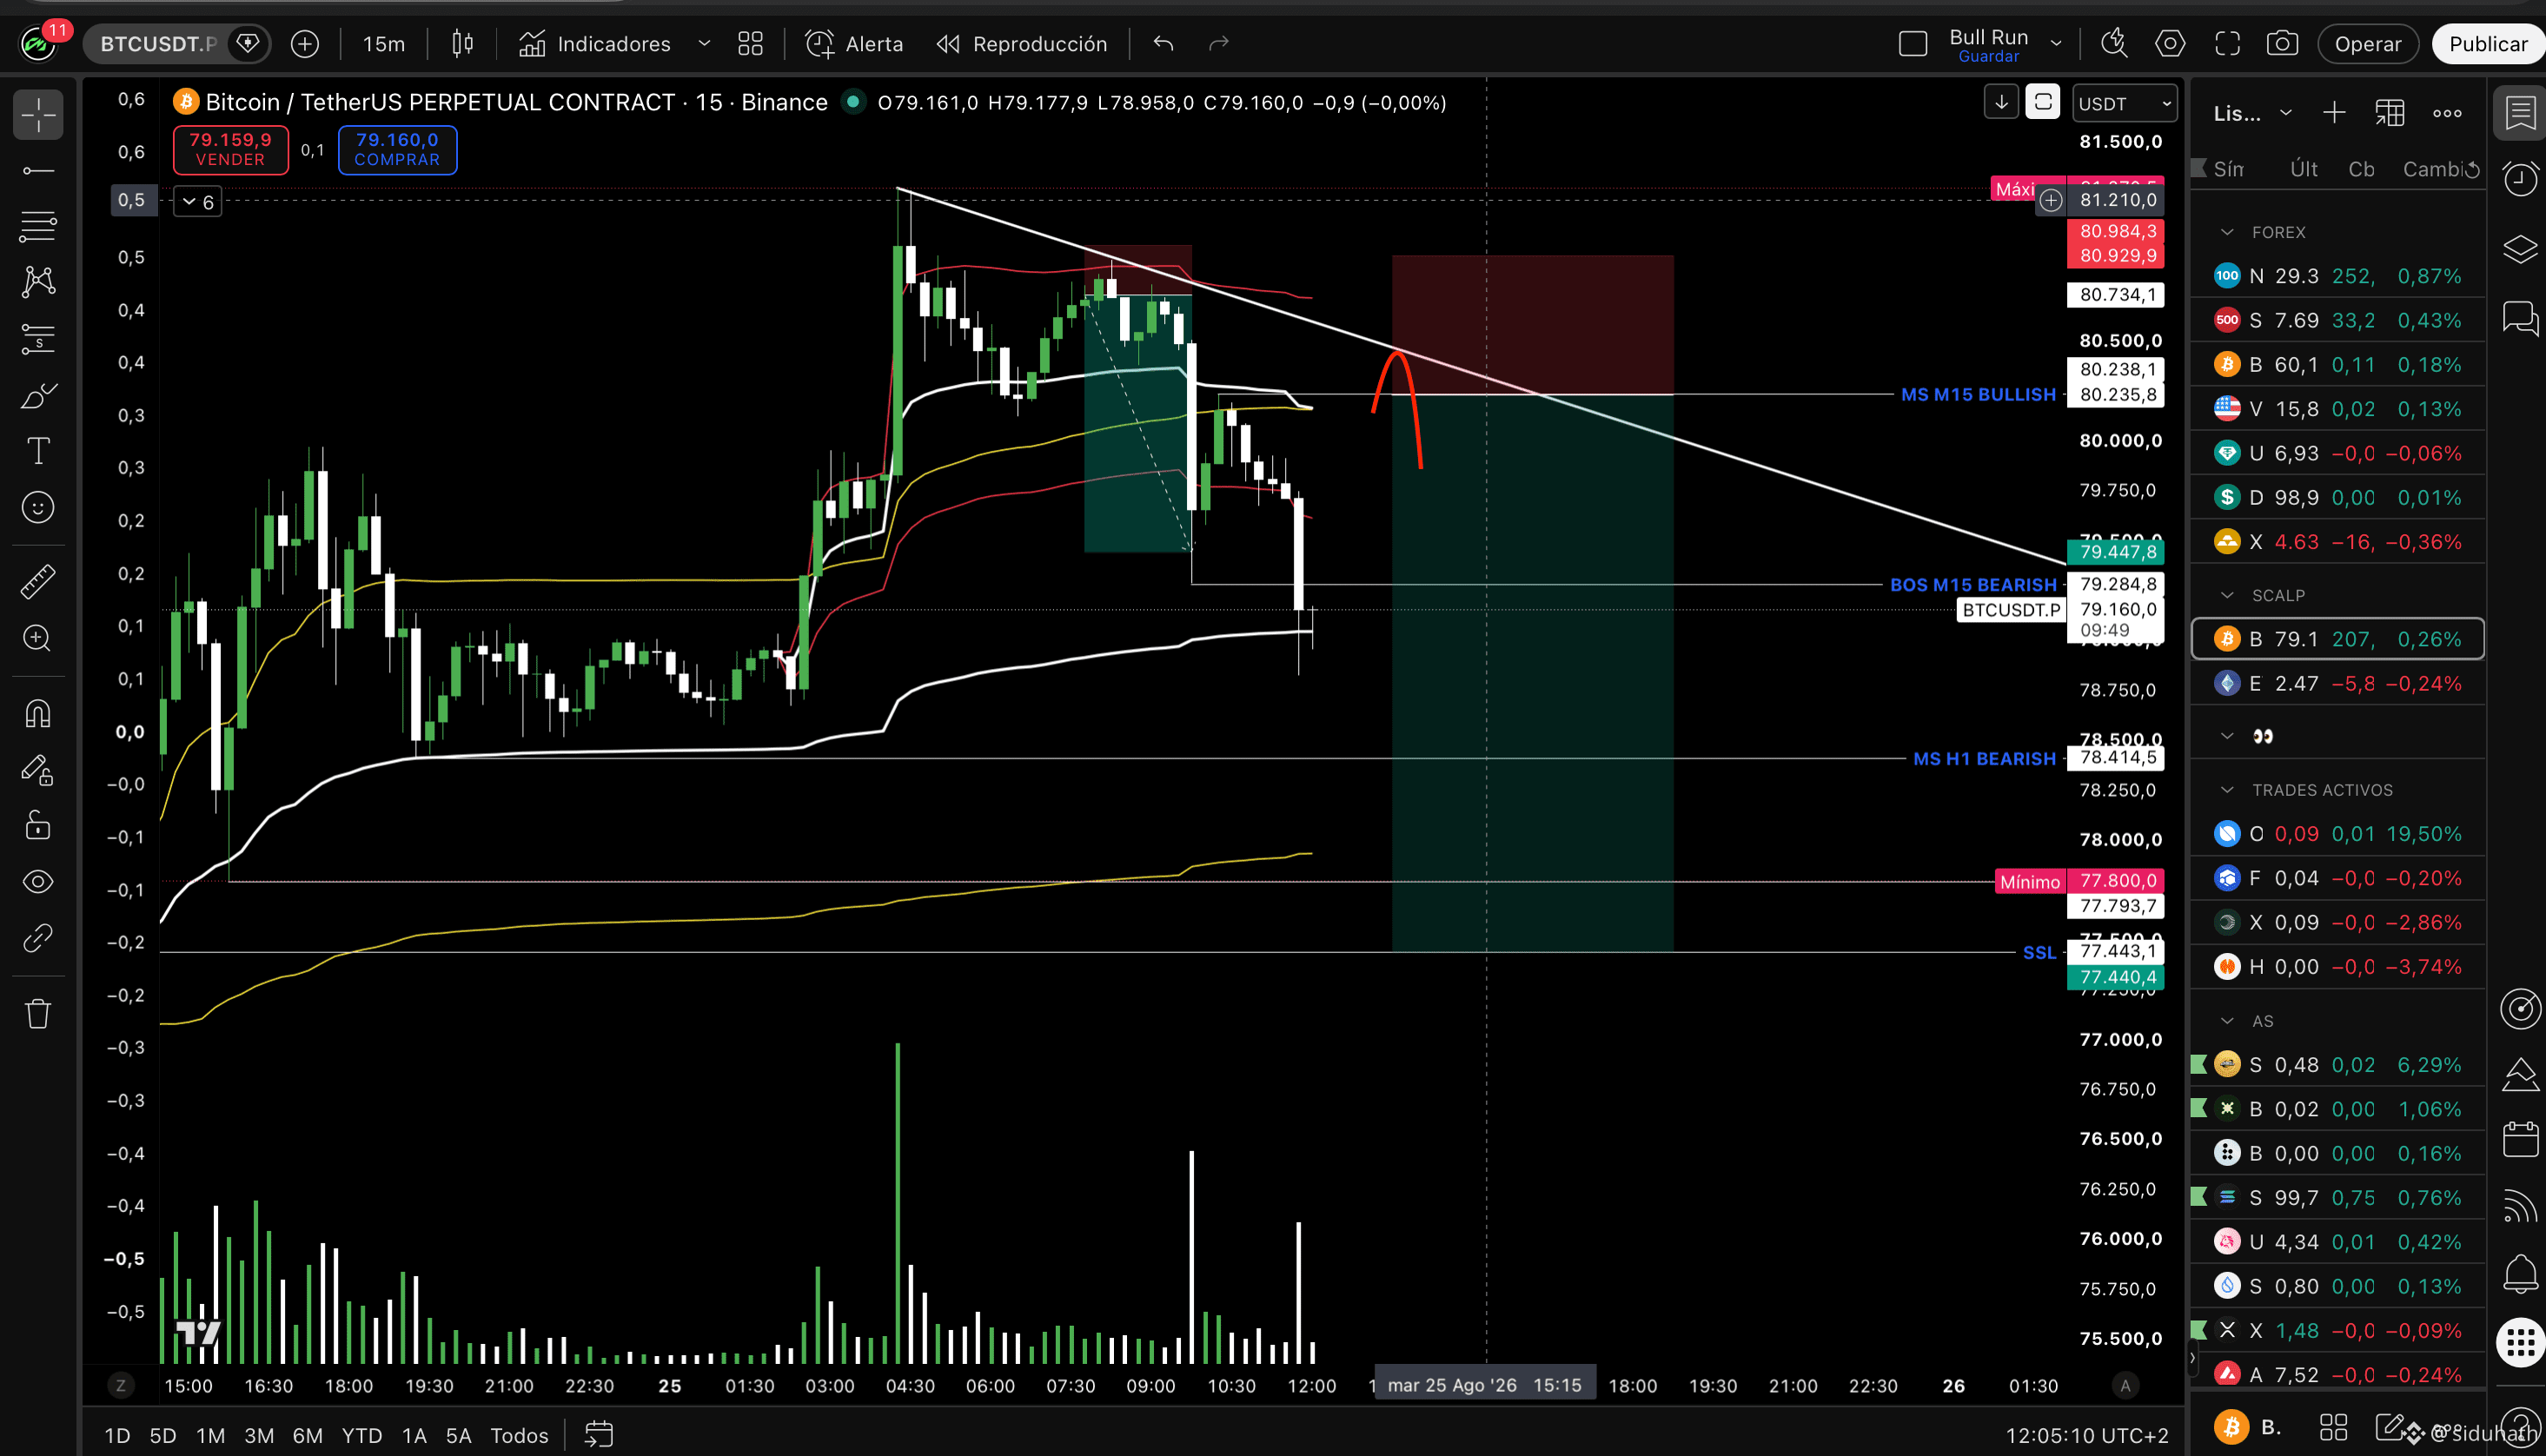
$BTC Bearish BOS done, now if we can get a sweep. And reject this swing short is so good
JBXBT
·
--
Bearish$BTC This is something I taught yesterday, but I’m teaching it again today. When you’re in a trend, to go against the trend you need a BOS. Yesterday’s example is the best one. You can look for short opportunities, but if the market forms a bearish MS on the M15 chart and fails to continue by making a LL, and then the market forms a bullish MS again, that’s a signal of its intention to form a HH The same principle applies now. If BTC isn’t able to make a HH and we see an accumulation that breaks out to the upside, it will be to make another HH. That’s why confirmations are important when you’re trading against the trend. And if there’s no BOS, there’s no confirmation of a trend reversal #BTCReaches$80000
$BTC This is something I taught yesterday, but I’m teaching it again today. When you’re in a trend, to go against the trend you need a BOS. Yesterday’s example is the best one. You can look for short opportunities, but if the market forms a bearish MS on the M15 chart and fails to continue by making a LL, and then the market forms a bullish MS again, that’s a signal of its intention to form a HH The same principle applies now. If BTC isn’t able to make a HH and we see an accumulation that breaks out to the upside, it will be to make another HH. That’s why confirmations are important when you’re trading against the trend. And if there’s no BOS, there’s no confirmation of a trend reversal #BTCReaches$80000
JBXBT
·
--
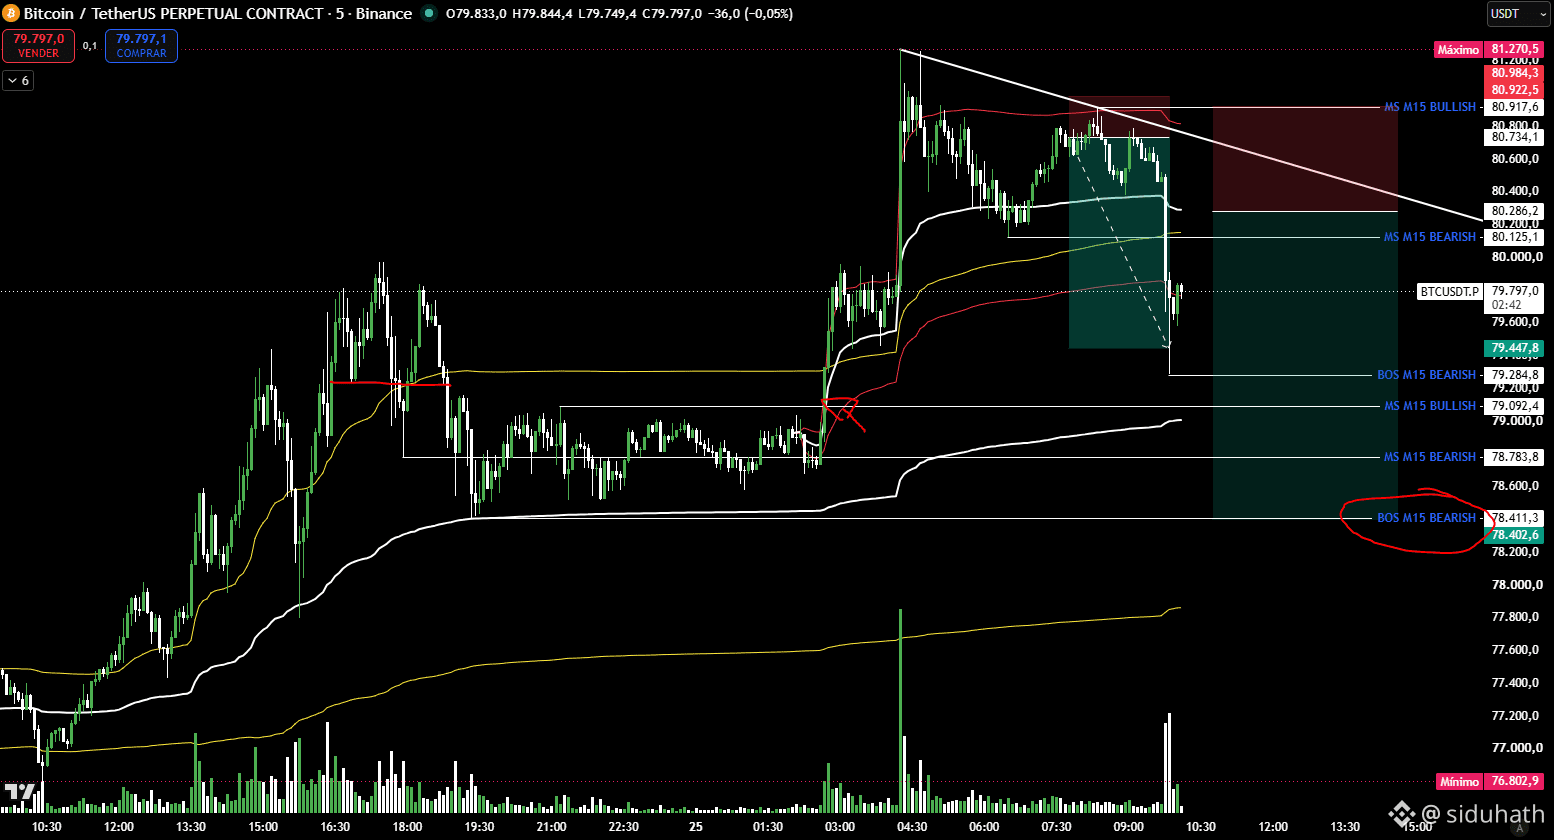
Bearish$BTC If we continue to “retrace,” look for the MS in a bearish M5 pattern to re-enter a short position
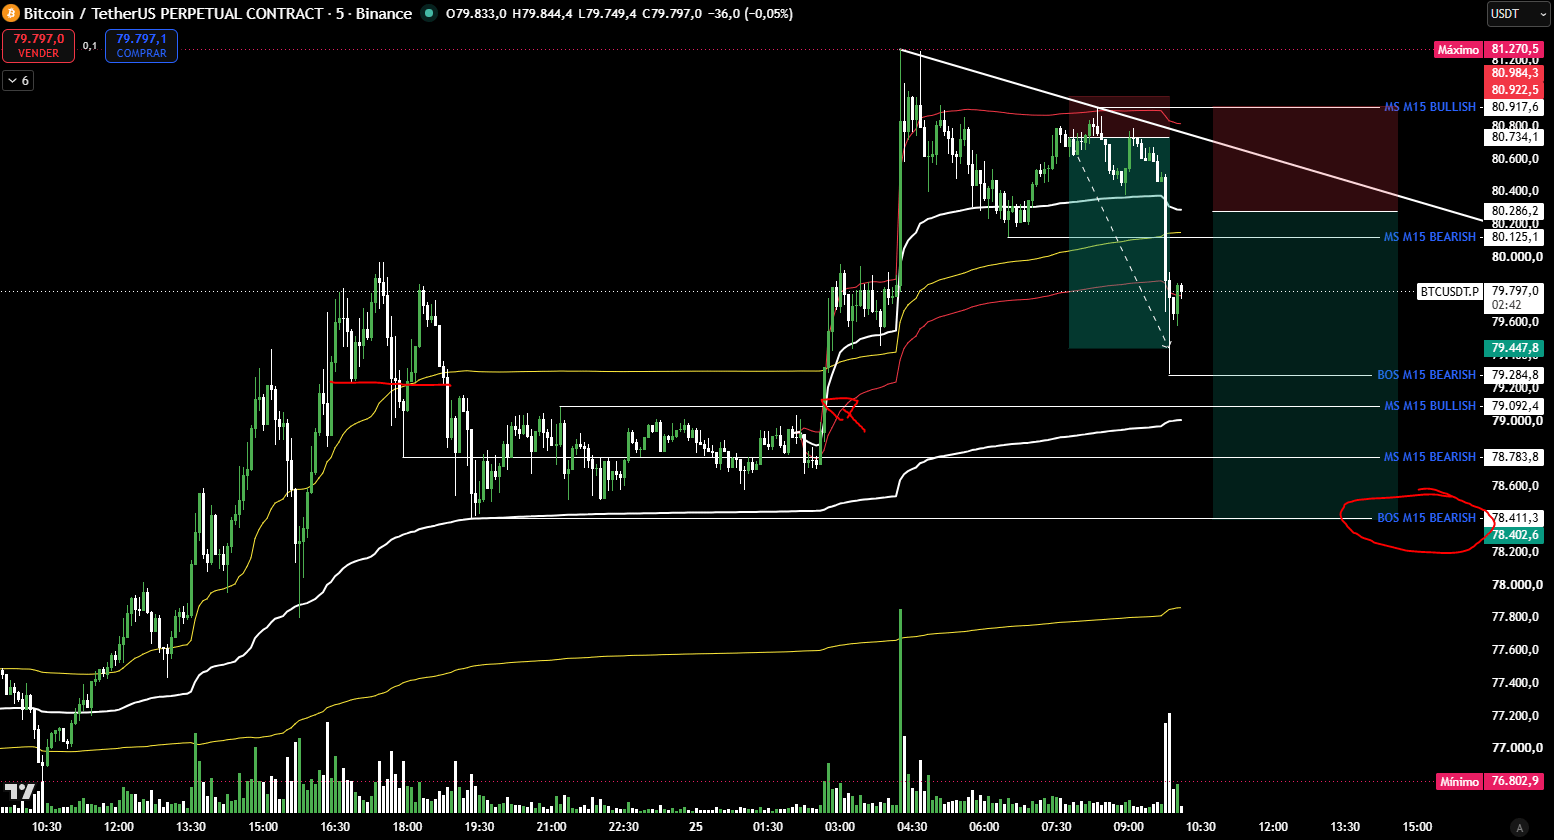
$BTC If we continue to “retrace,” look for the MS in a bearish M5 pattern to re-enter a short position
JBXBT
·
--
$BTC Right now I'm short. But I'm watching to see which spot is holding the price for now. If it reclaim that level, I'll probably enter this long position to hedge against a sweep
Log in to explore more content