

Huutruong
10.3k Posts

Huutruong
Report
Block User
💰 Theo dõi Crypto | Tìm kiếm cơ hội mỗi ngày ( KITE-277880 )
Open Trade
Frequent Trader
5.5 Years
3.6K+ Following
2.4K+ Followers
846 Liked
Posts
Portfolio
All
Quotes
Videos
Live
·
--
Bearish
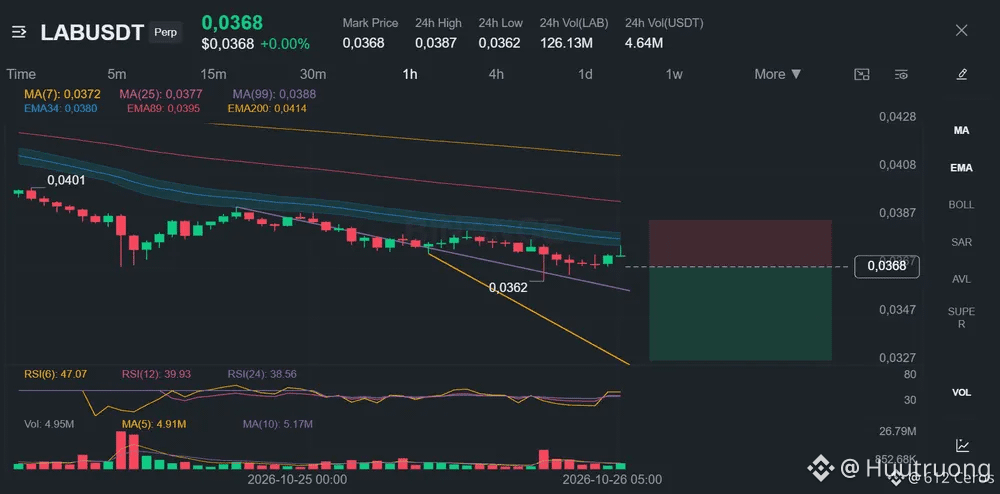
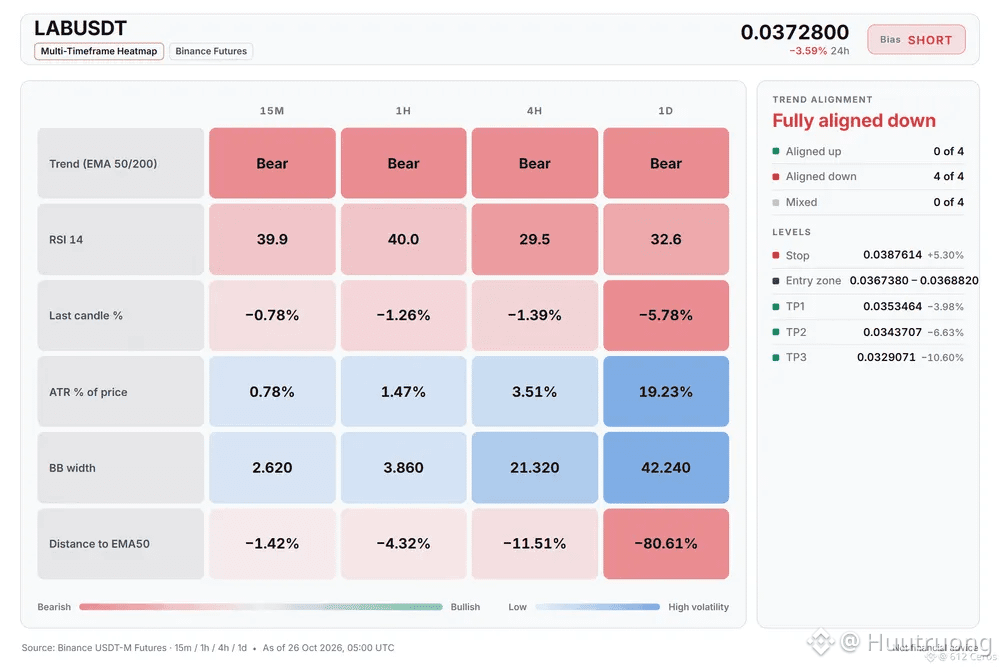
LAB is deep in a bearish stack across every trend
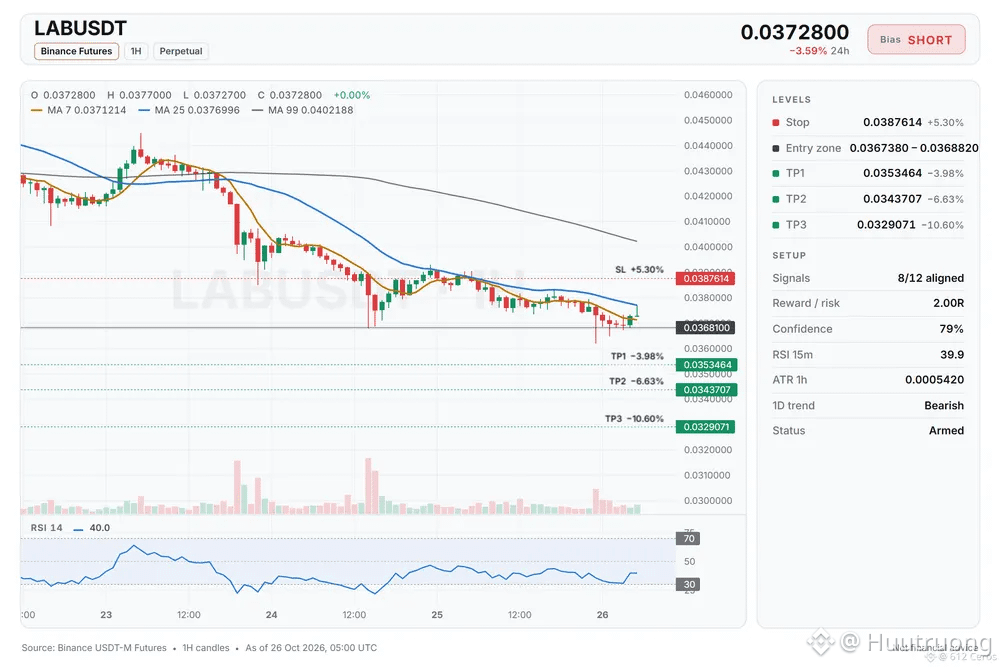
🔴 SHORT $LAB /USDT: expecting price to go DOWN
Bias: SHORT · Strong
Entry: 0.0367380 – 0.0368820
TP1: 0.0353464 (-4.0%)
TP2: 0.0343707 (-6.6%)
TP3: 0.0329071 (-10.6%)
SL: 0.0387614 (+5.3%)
Plan: enter only inside the zone, close 50% at TP1, 25% at TP2, 25% at TP3, and move the stop to entry after TP1.
Why SHORT? LAB checklist: 8/12 agree, 1 against.
• Daily trend down (below EMA50 & EMA200)
• 4h trend down (below EMA50 & EMA200)
• 1h trend down (below EMA50 & EMA200)
Watch: Far below its average, bounce likely (−3.1 ATR from 1h EMA50)
Watch: The idea is wrong if price reaches the stop at 0.0387614
Bottom line: The daily bearish stack (price below both EMAs) is the strongest sign, but price is 3.1 ATR below the 1h EMA50, which means a bounce is likely
Where is your invalidation level if this short fails?
1
·
--
Bearish
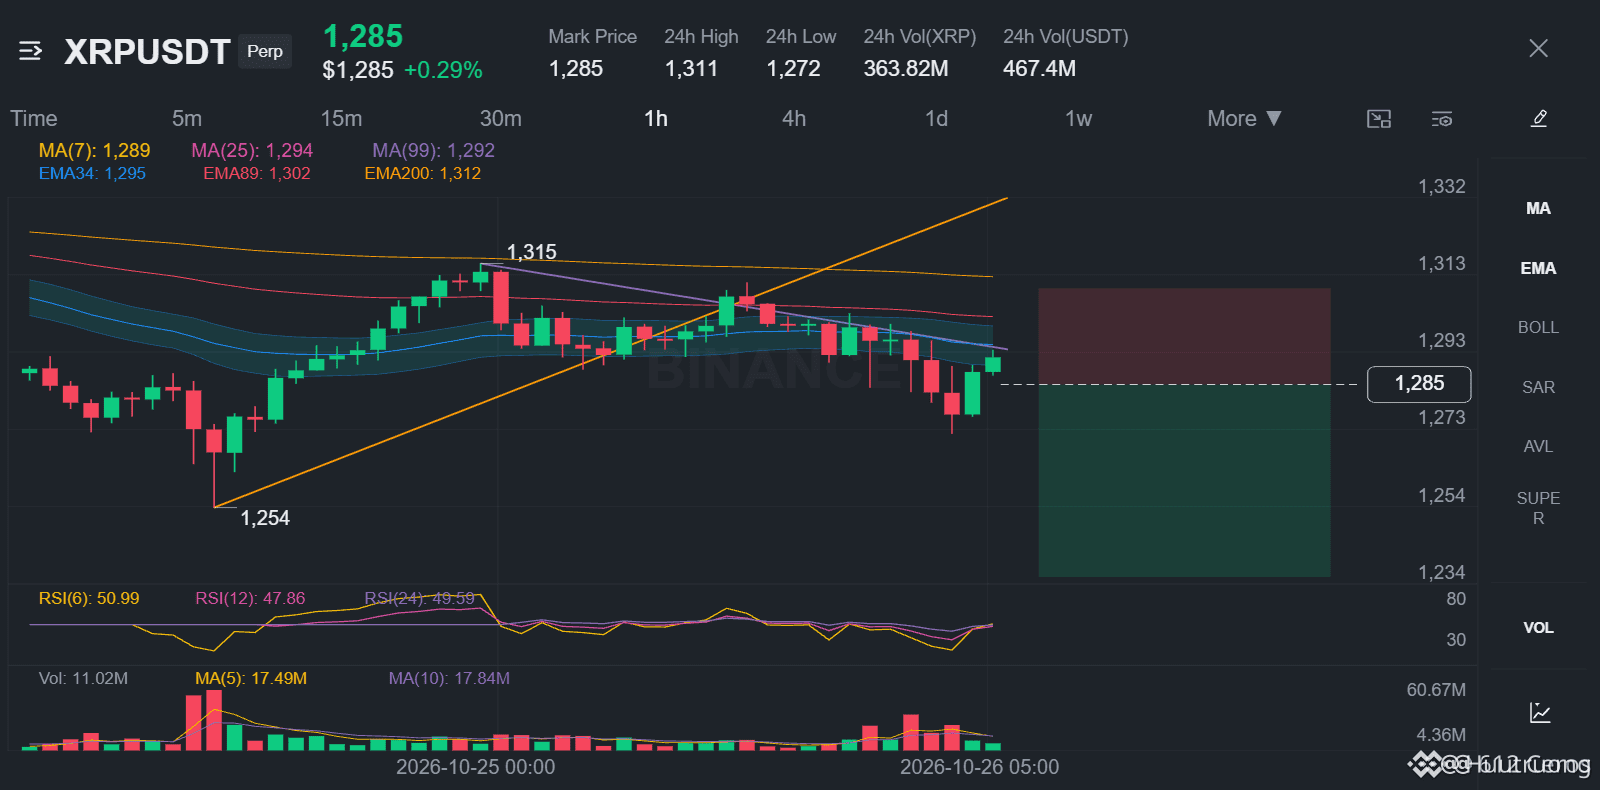
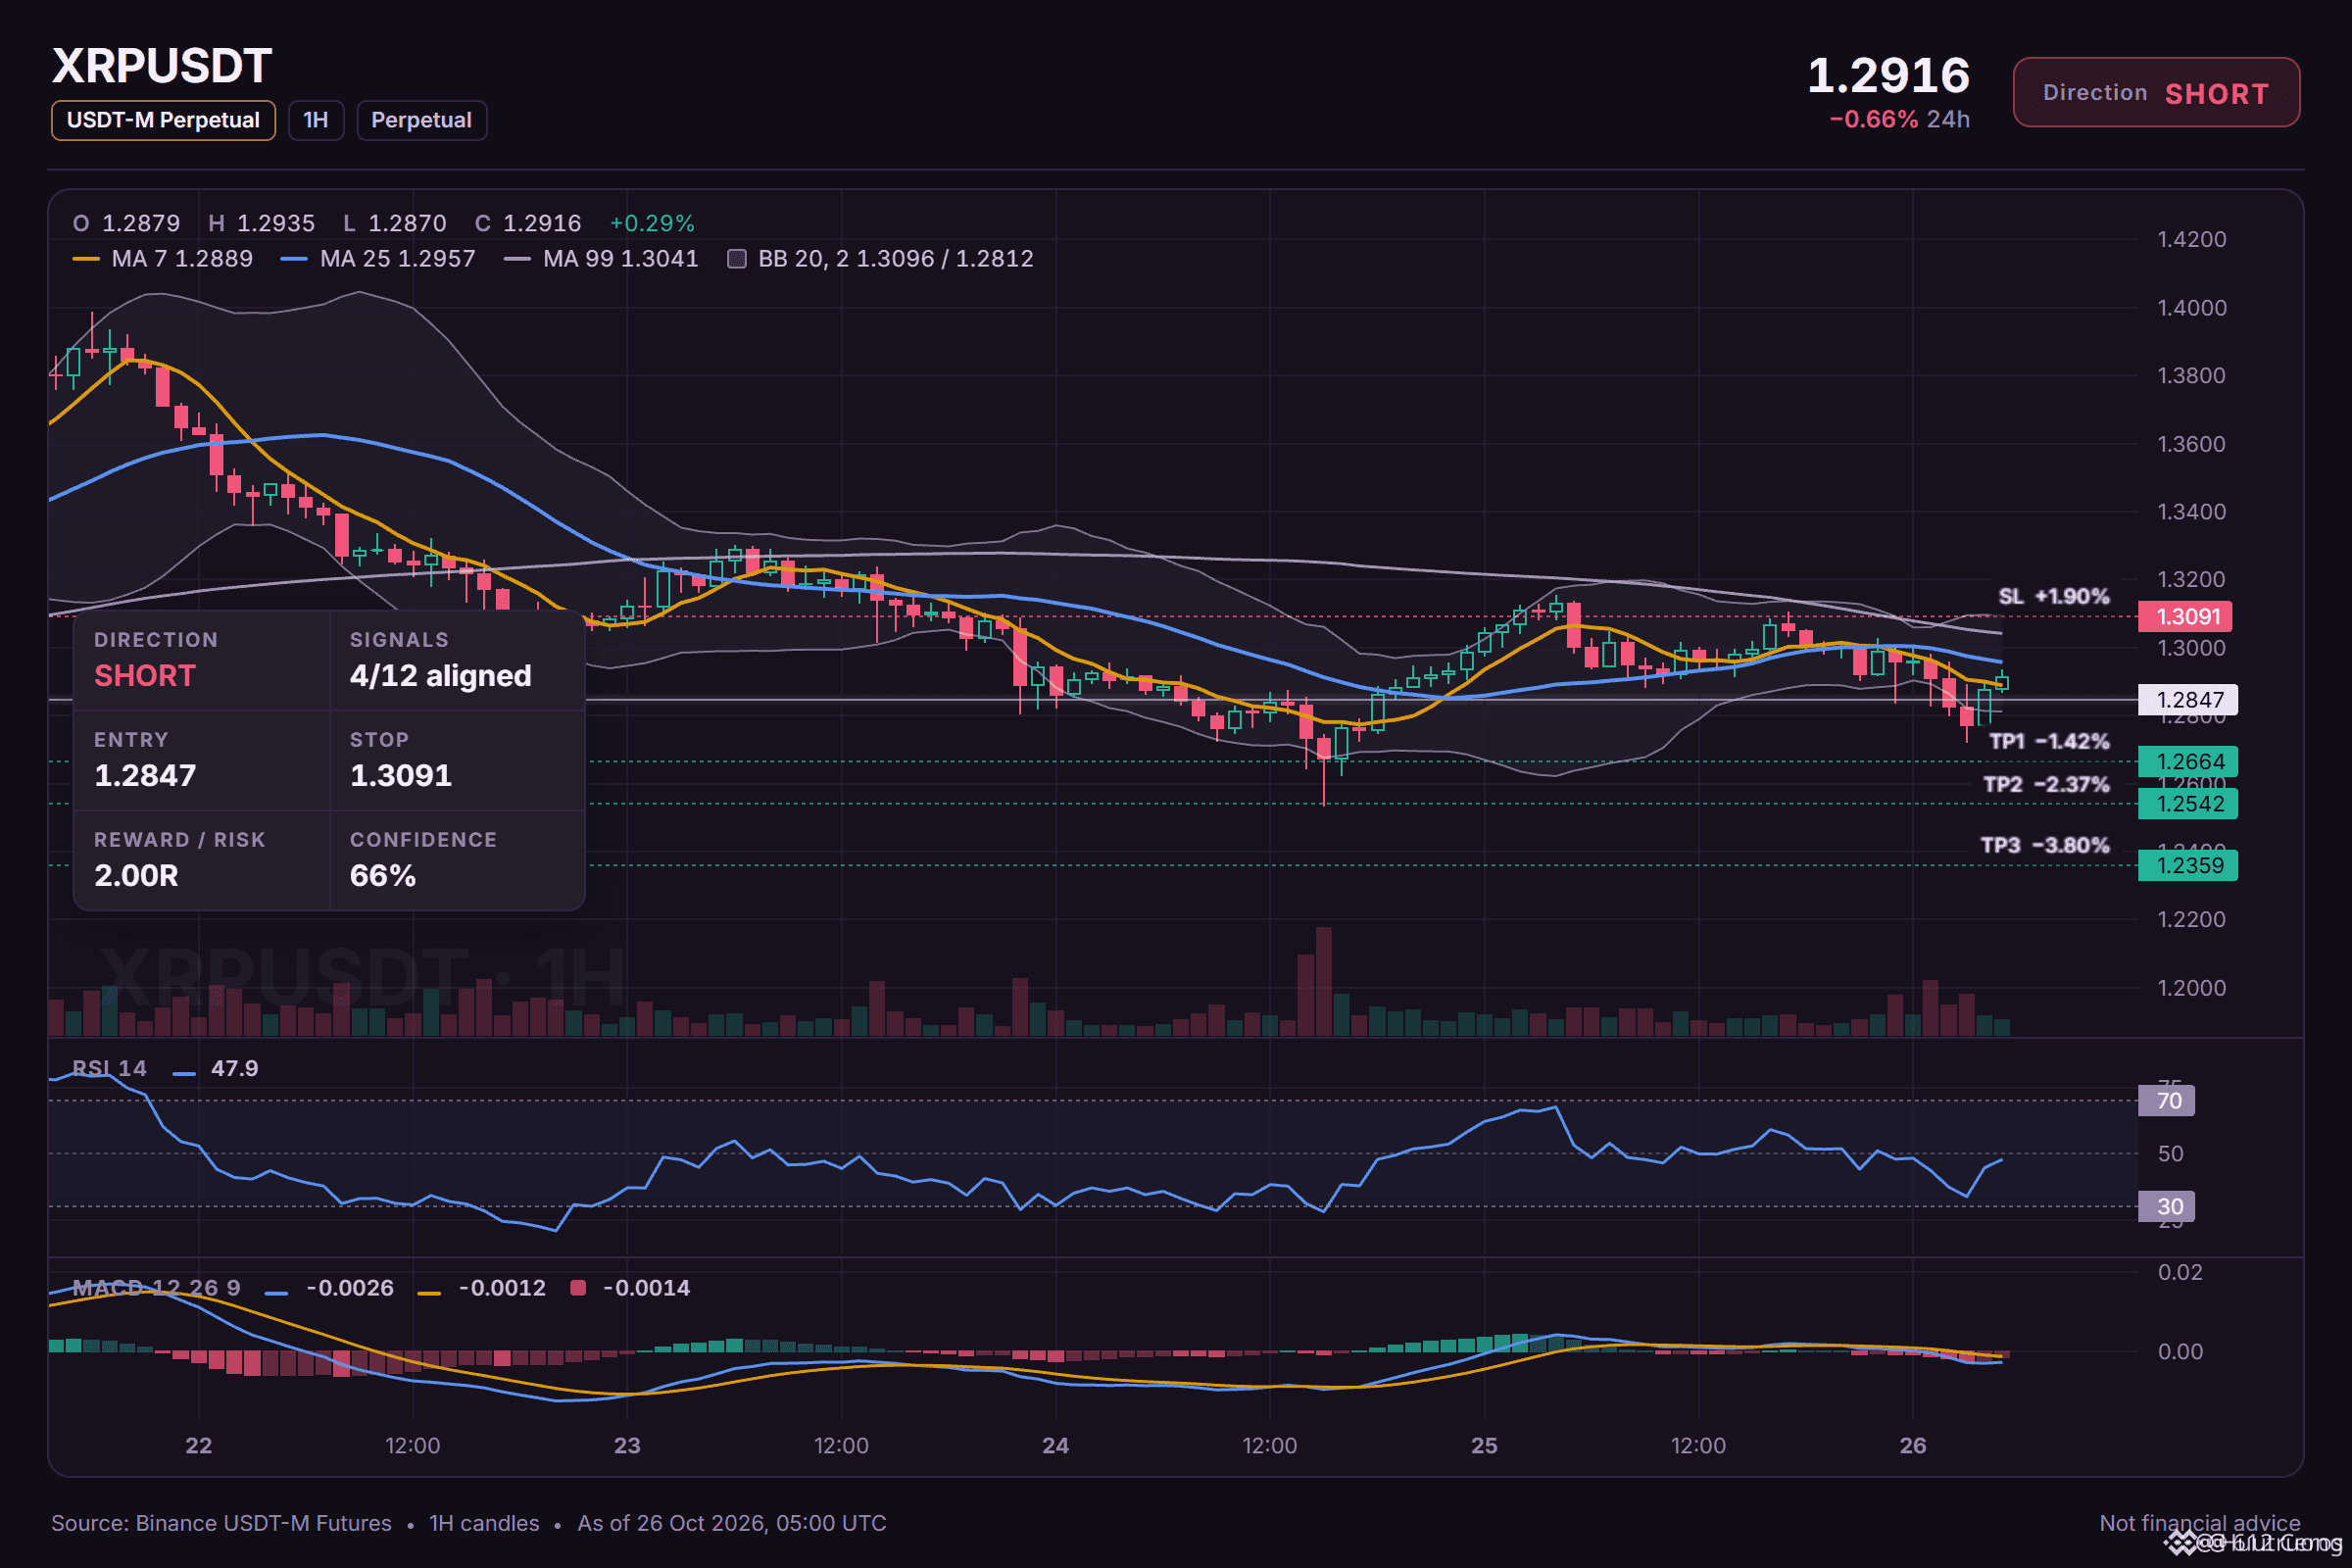
XRP stays below a stacked EMA ribbon on the 4h
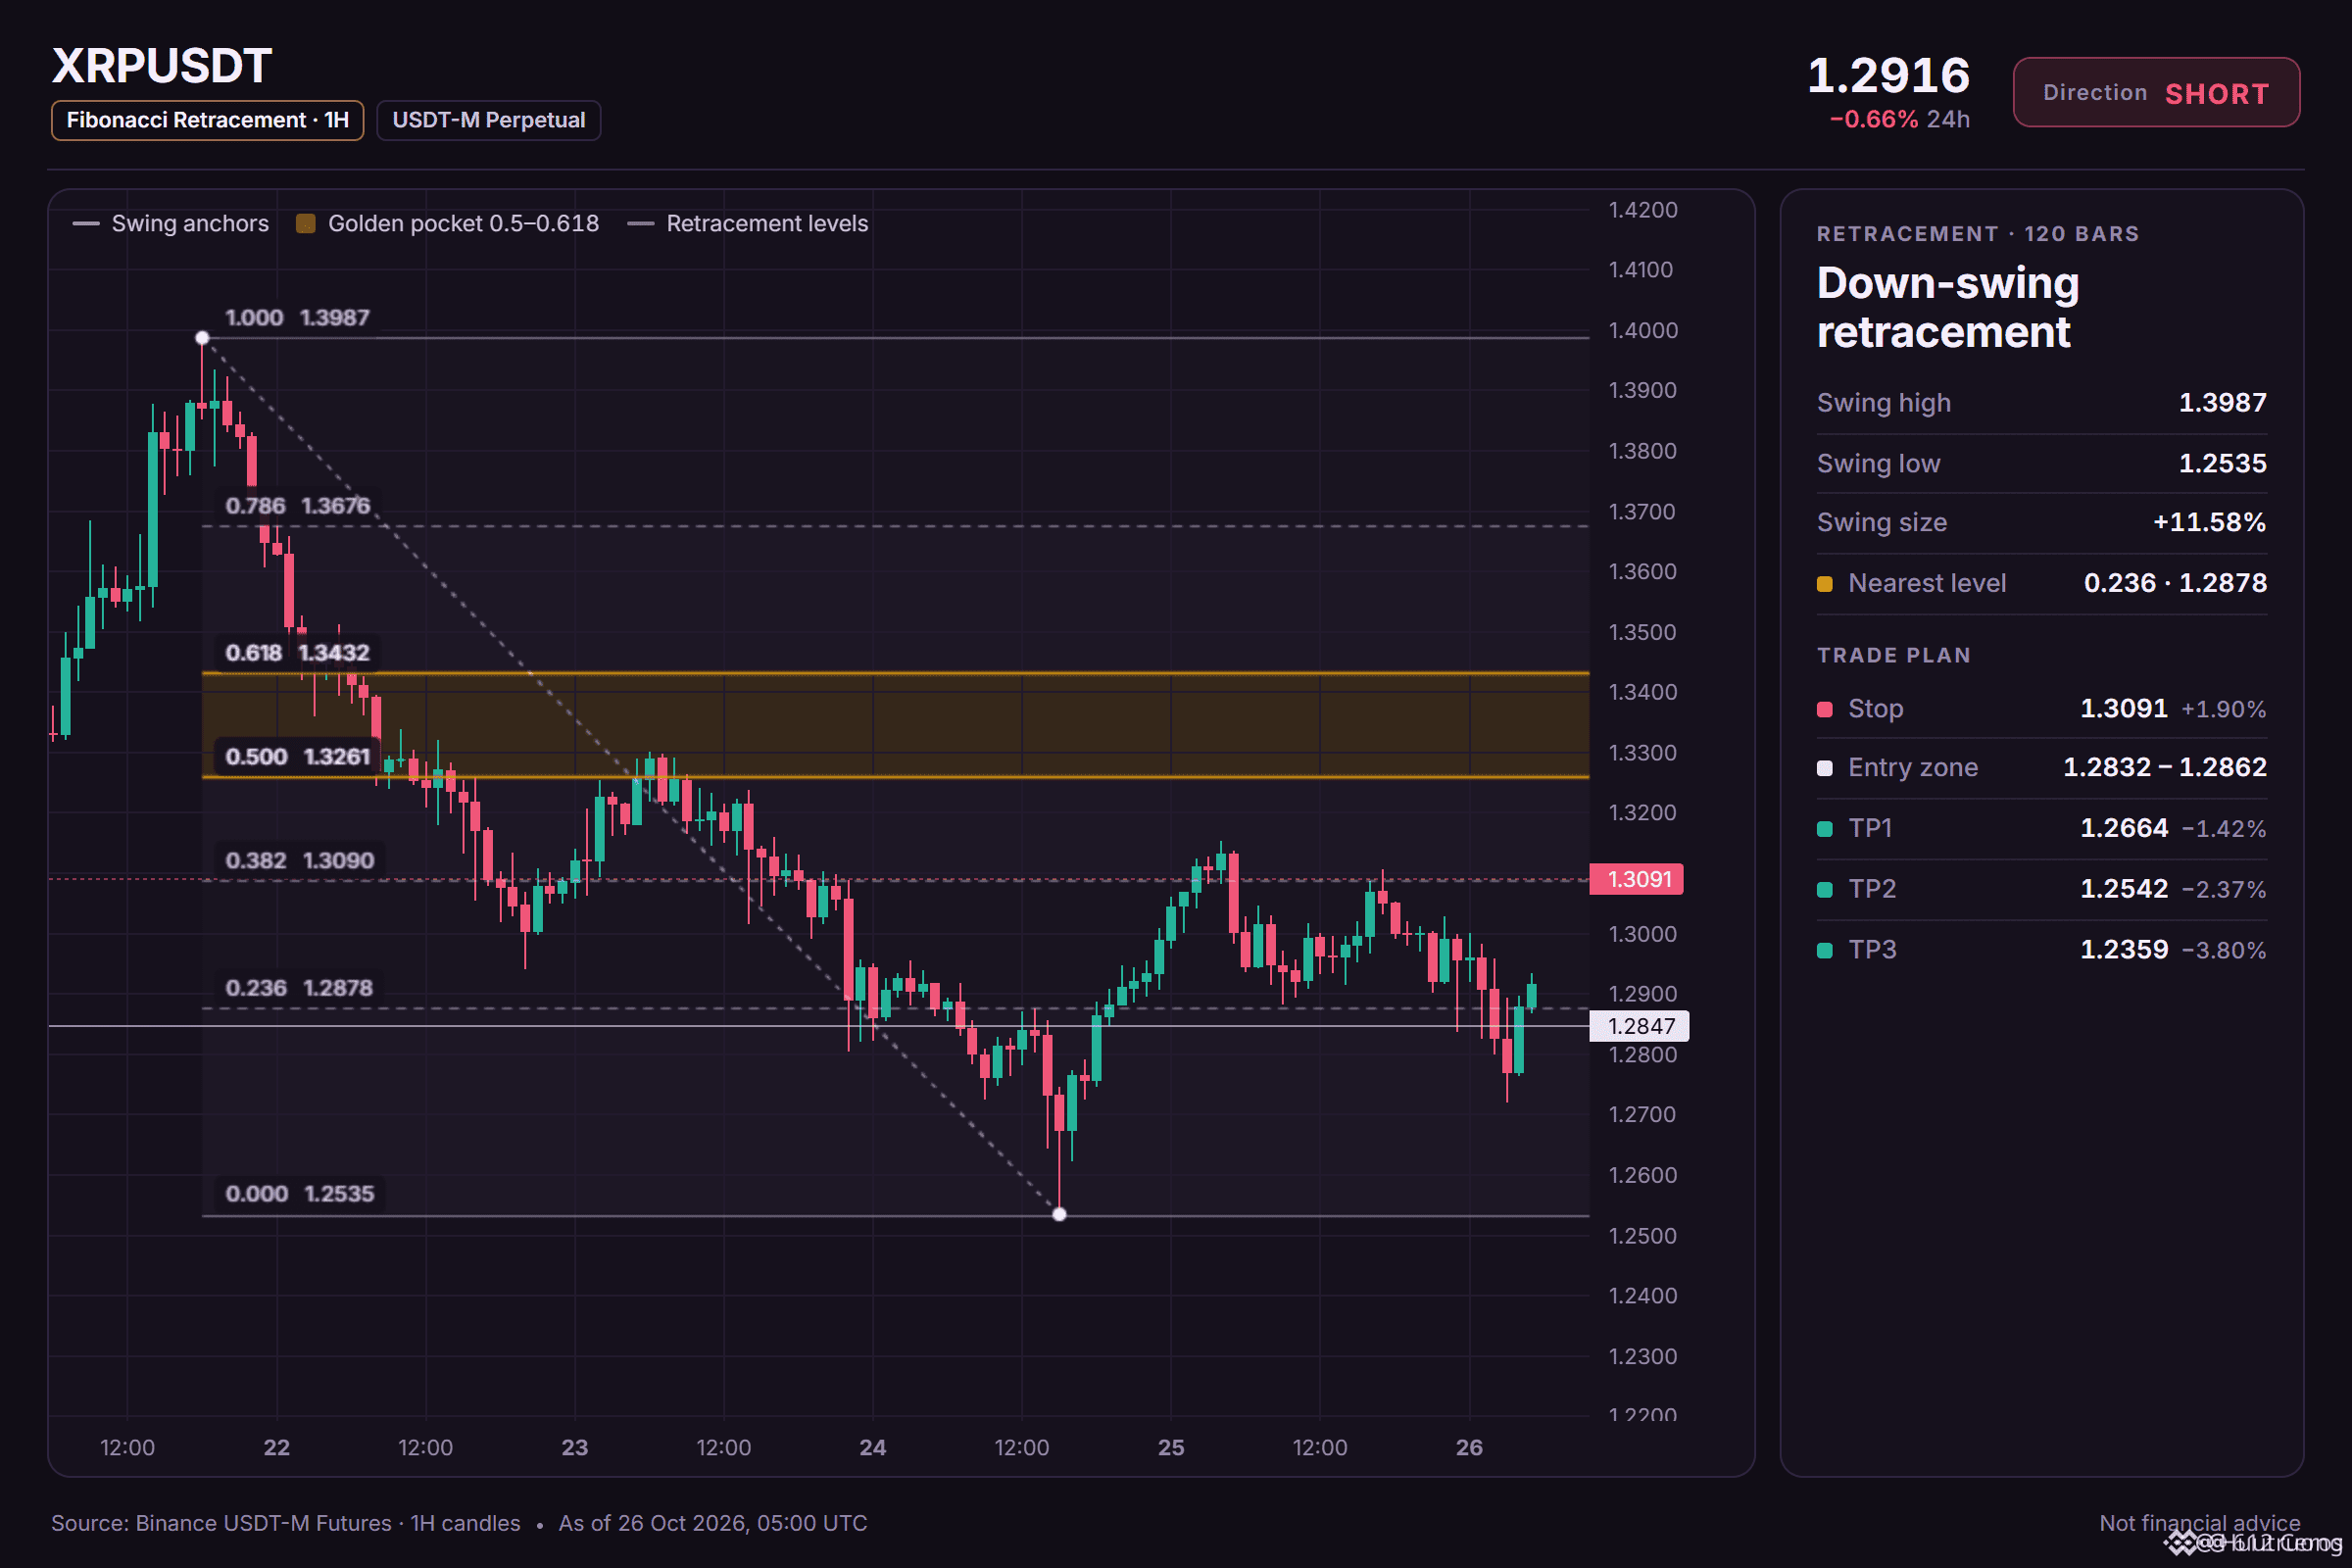
🔴 SHORT $XRP /USDT: expecting price to go DOWN
Bias: SHORT · Leaning
Entry: 1.2832 – 1.2862
TP1: 1.2664 (-1.4%)
TP2: 1.2542 (-2.4%)
TP3: 1.2359 (-3.8%)
SL: 1.3091 (+1.9%)
Plan: enter only inside the zone, close 50% at TP1, 25% at TP2, 25% at TP3, and move the stop to entry after TP1.
Note: moderate conviction only, keep size light.
Why SHORT? 4/12 signals agree, 0 against.
• 4h trend down (below EMA50 & EMA200)
• 1h trend down (below EMA50 & EMA200)
• Sellers are driving the move (15m ADX 25.8)
The short version:
1. the 4h trend shows price below EMA50 and EMA200, a bearish stack suggesting the swing is down.
2. the 1h trend also has price below EMA50 and EMA200, so the short-term trend is down too.
3. the 4h RSI sits at 38.1, bearish momentum below 45, but the daily range makes the move less decisive.
Where would you set your level if you disagreed?
4
·
--
Bearish
Range-bound coins often trap longs into fading moves.
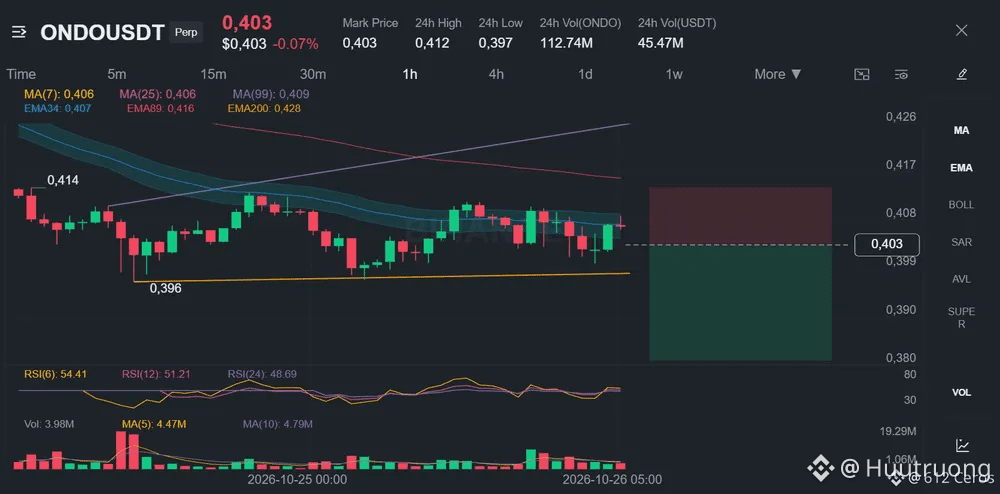
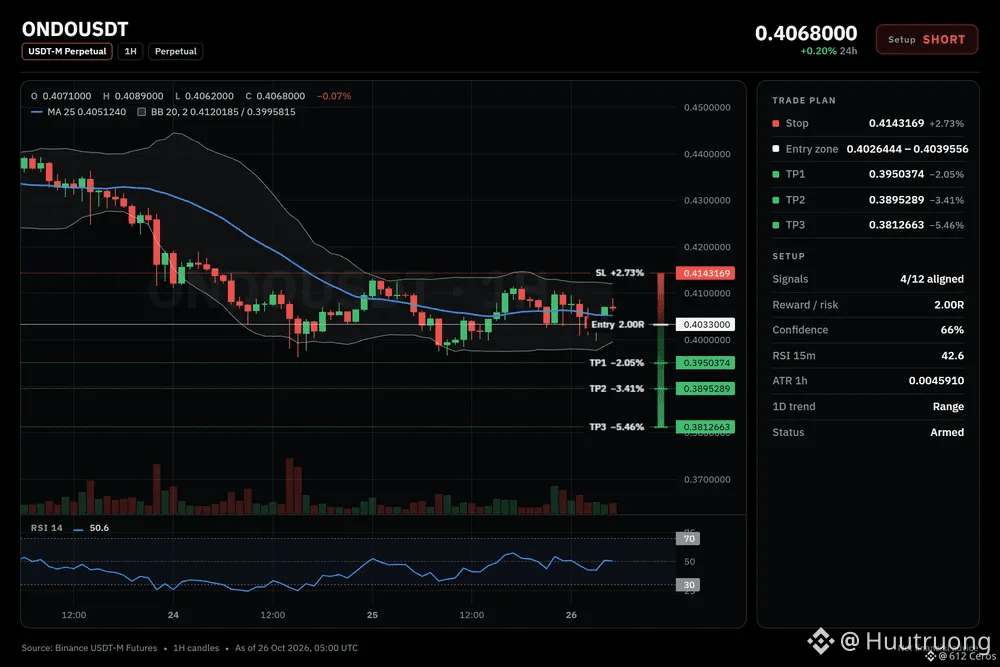
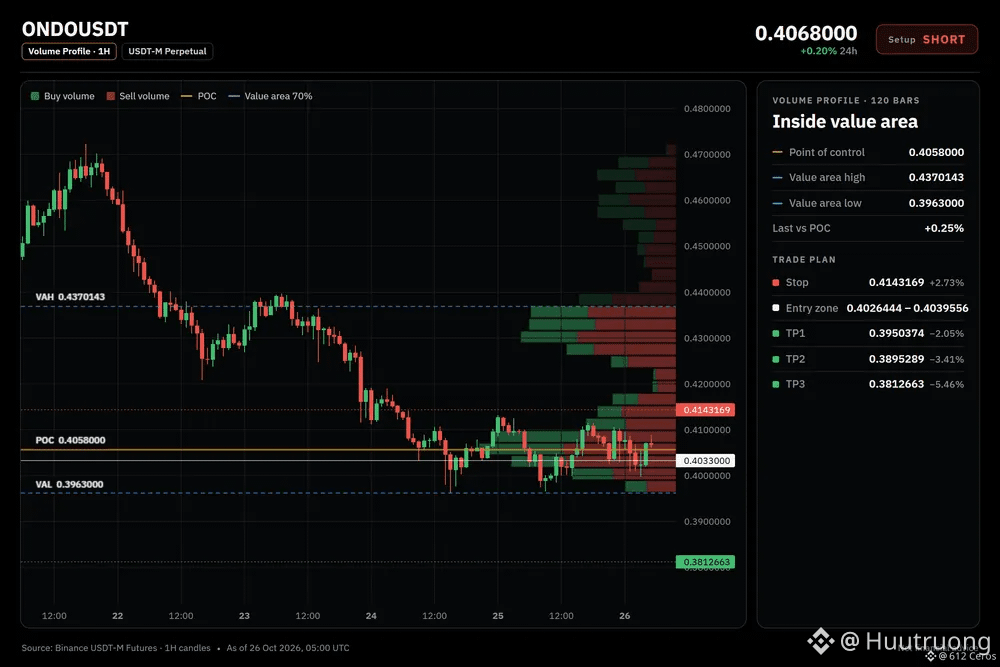
🔴 SHORT $ONDO /USDT: expecting price to go DOWN
Bias: SHORT · Leaning
Entry: 0.4026444 – 0.4039556
TP1: 0.3950374 (-2.0%)
TP2: 0.3895289 (-3.4%)
TP3: 0.3812663 (-5.5%)
SL: 0.4143169 (+2.7%)
Plan: enter only inside the zone, close 50% at TP1, 25% at TP2, 25% at TP3, and move the stop to entry after TP1.
Note: moderate conviction only, keep size light.
Why SHORT? 4/12 signals agree, 0 against.
• 4h trend down (below EMA50 & EMA200)
• 1h trend down (below EMA50 & EMA200)
• Sellers are driving the move (15m ADX 20.9)
Bear path:
If the 4h trend holds with price below the EMA stack, the 1h price may continue sliding toward the first target. The daily trend being range means the move could stay contained.
What kills it:
If the 1h price reclaims the entry level at 0.4039556, the bearish structure breaks and I would exit the short.
Where do you want to see price before shorting?
3
·
--
Bearish
The 4h stack is bearish across every timeframe.
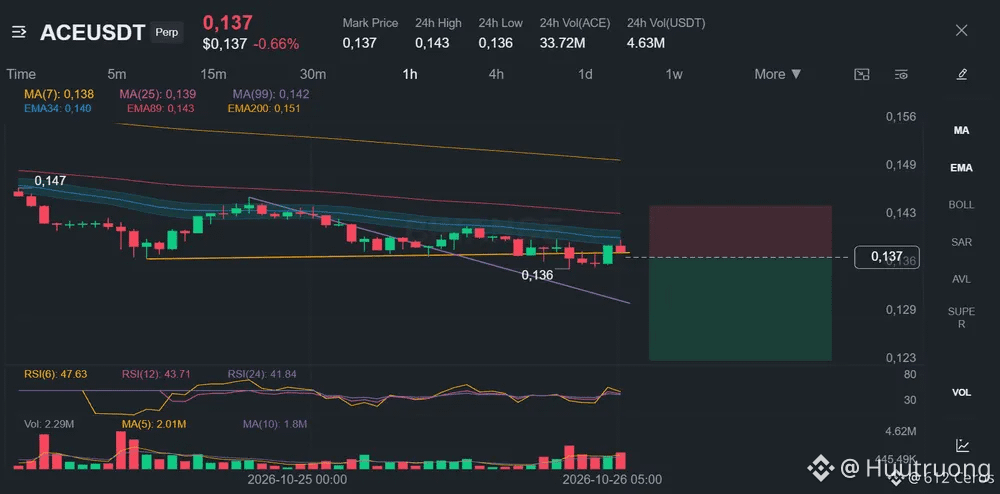
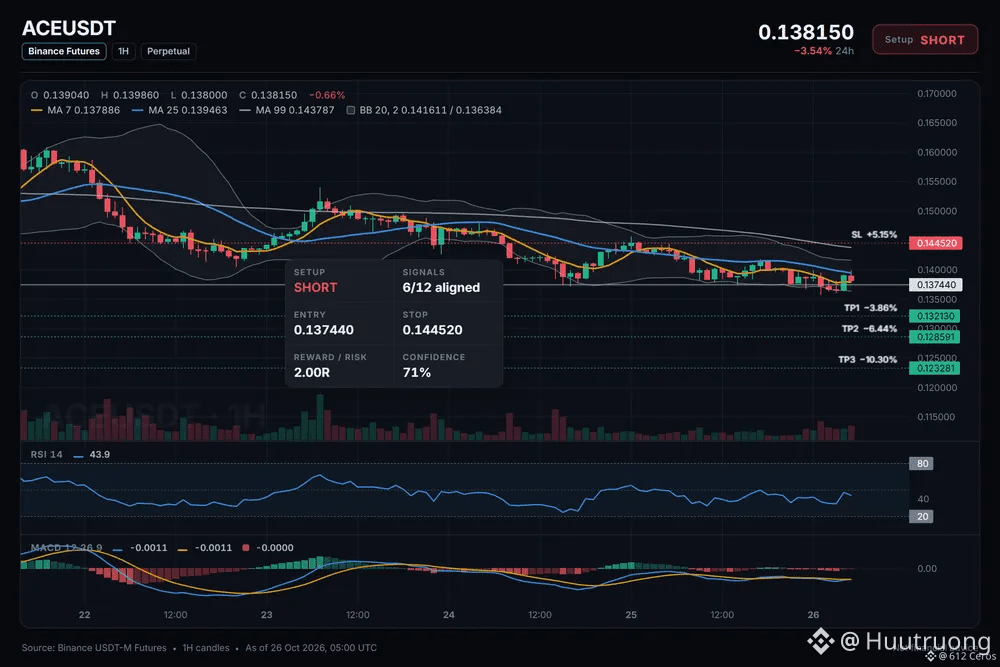
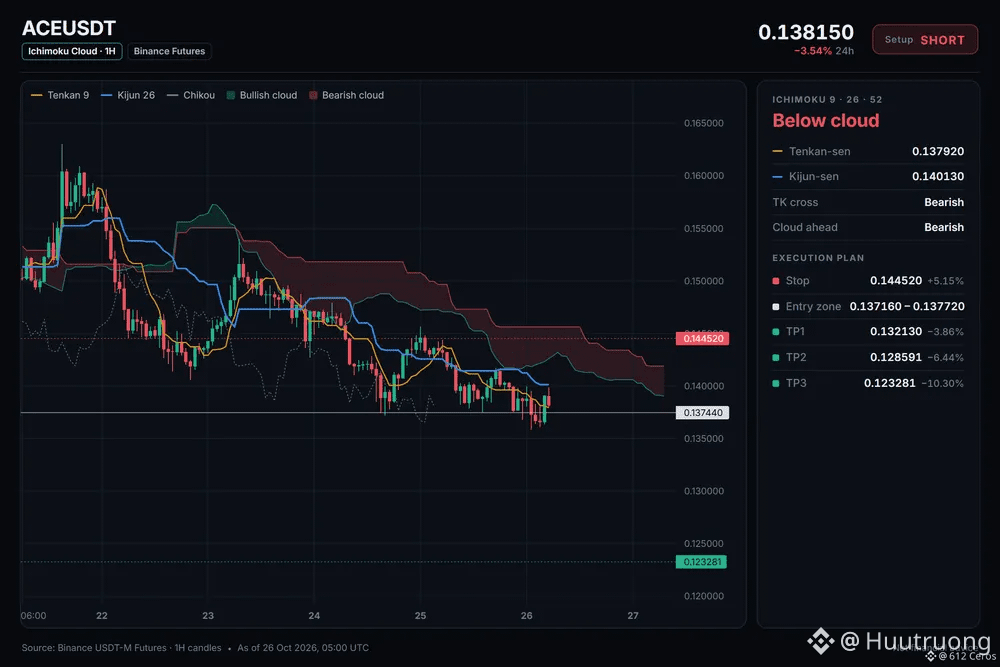
🔴 SHORT $ACE /USDT: expecting price to go DOWN
Bias: SHORT · Strong
Entry: 0.137160 – 0.137720
TP1: 0.132130 (-3.9%)
TP2: 0.128591 (-6.4%)
TP3: 0.123281 (-10.3%)
SL: 0.144520 (+5.2%)
Plan: enter only inside the zone, close 50% at TP1, 25% at TP2, 25% at TP3, and move the stop to entry after TP1.
Why SHORT? 6/12 signals agree, 0 against.
• 4h trend down (below EMA50 & EMA200)
• 1h trend down (below EMA50 & EMA200)
• Sellers have the momentum (4h RSI 33.9)
My read on ACE today
I'm watching a short setup on ACE. The 1h price is 0.137440, and the daily trend is a range, so the move is driven by the 4h bearish stack. I want to see the daily trend stay in range while the 4h stack holds.
Where is your invalidation level for this trade?
3
·
--
Bearish
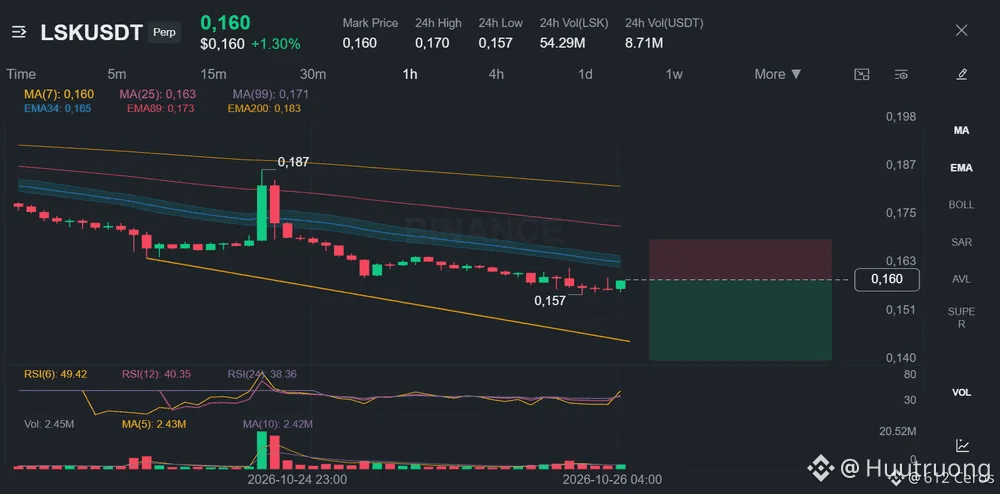
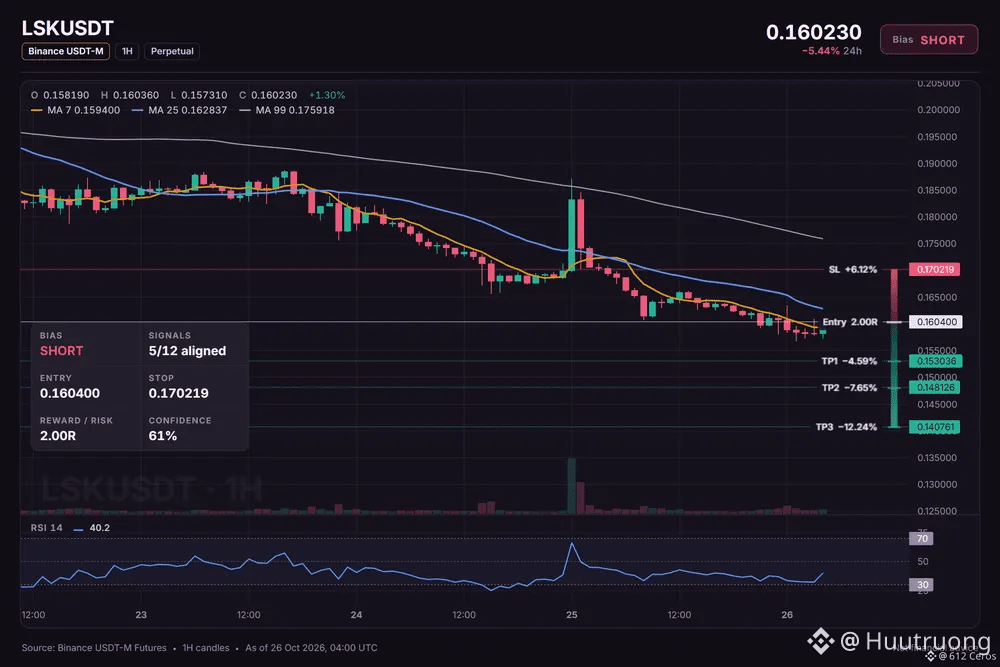
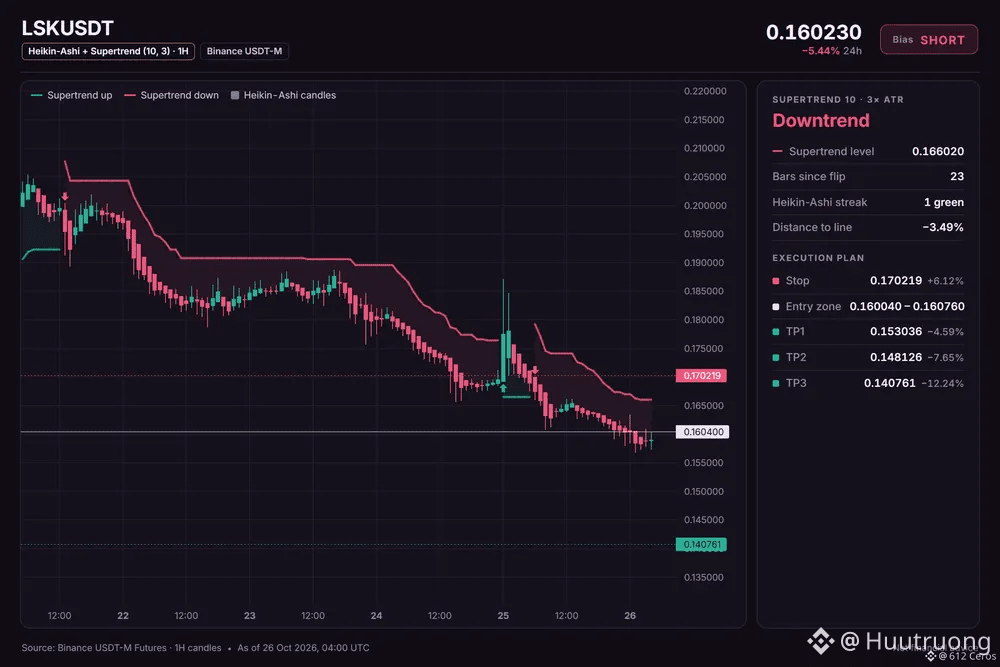
🔴 SHORT $LSK /USDT: expecting price to go DOWN
Bias: SHORT · Leaning
Entry: 0.160040 – 0.160760
TP1: 0.153036 (-4.6%)
TP2: 0.148126 (-7.7%)
TP3: 0.140761 (-12.2%)
SL: 0.170219 (+6.1%)
Plan: enter only inside the zone, close 50% at TP1, 25% at TP2, 25% at TP3, and move the stop to entry after TP1.
Note: moderate conviction only, keep size light.
LSK looks weak but buyers are fighting back now
Why SHORT? 5/12 signals agree, 2 against.
• 4h trend down (below EMA50 & EMA200)
• 1h trend down (below EMA50 & EMA200)
• Sellers have the momentum (1h RSI 40.2)
Risk: Price is washed out, bounces are common from here (4h RSI 24.4, oversold)
The 4h trend is bearish and the 1h RSI is below 45, but the 15m RSI shows buyers in control, so conviction is moderate.
What is your invalidation level if you are in this trade?
2
·
--
Bearish
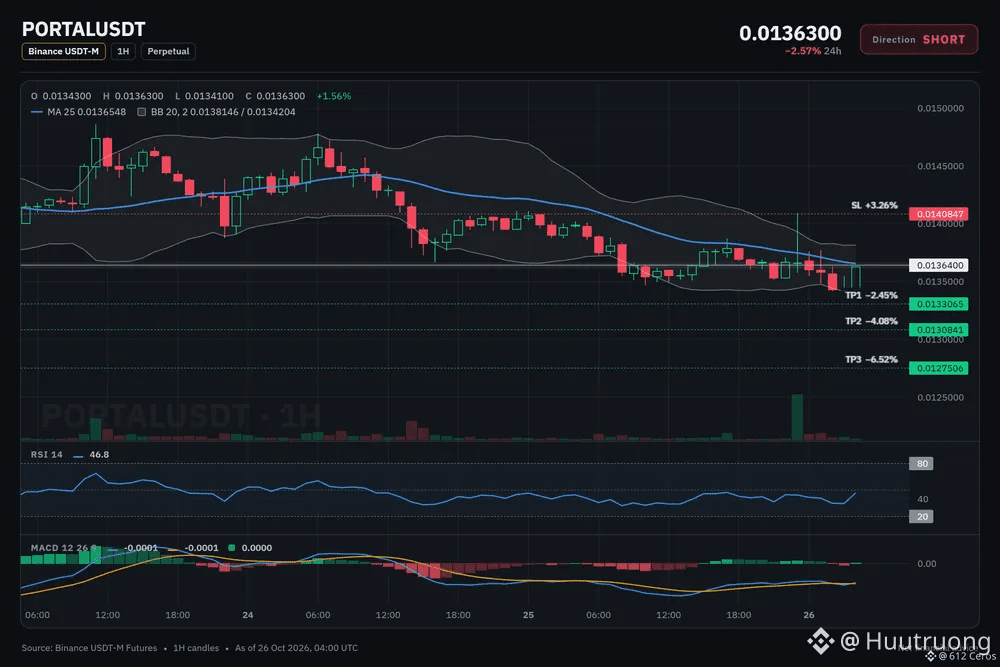
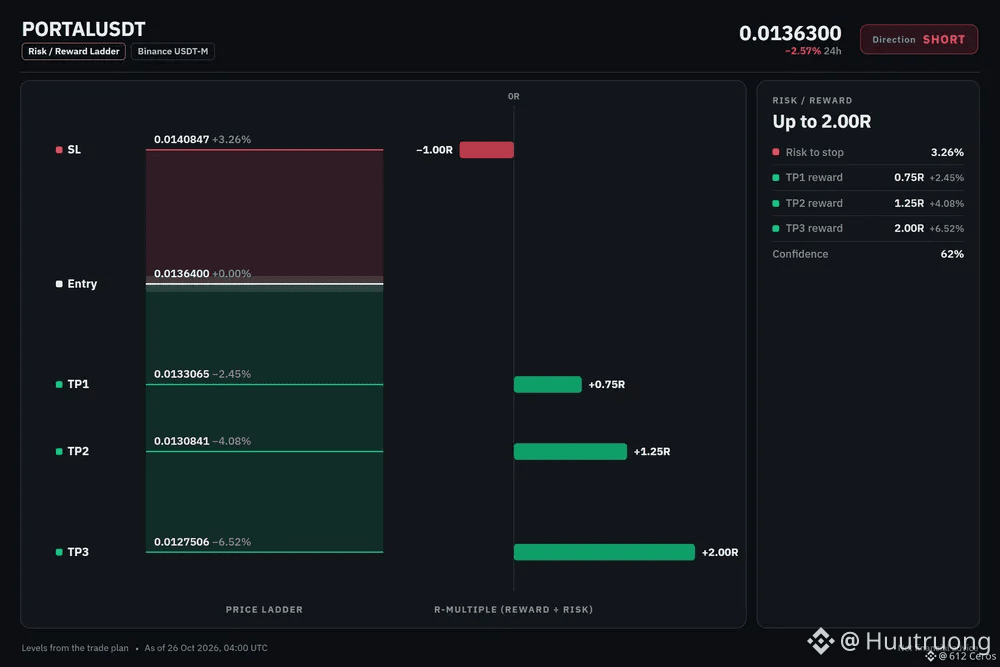
PORTAL short setup: the levels I'm watching
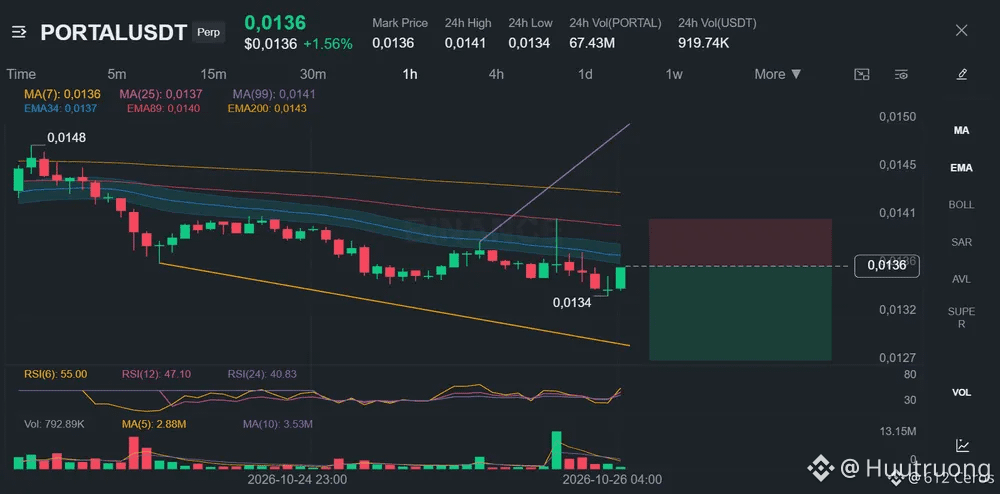
🔴 SHORT $PORTAL /USDT: expecting price to go DOWN
Bias: SHORT · Leaning
Entry: 0.0136135 – 0.0136665
TP1: 0.0133065 (-2.4%)
TP2: 0.0130841 (-4.1%)
TP3: 0.0127506 (-6.5%)
SL: 0.0140847 (+3.3%)
Plan: enter only inside the zone, close 50% at TP1, 25% at TP2, 25% at TP3, and move the stop to entry after TP1.
Note: moderate conviction only, keep size light.
Why SHORT? 4/12 signals agree, 1 against.
• 4h trend down (below EMA50 & EMA200)
• 1h trend down (below EMA50 & EMA200)
• Sellers have the momentum (4h RSI 34.9)
Risk: Buyers are pushing right now (+0.74% 15m candle)
In plain words:
The daily trend reads range, and 4/12 signals aligned favour the short side. The plan is to work the 0.0136135 – 0.0136665 zone, scale out at 0.0133065 and 0.0130841, and stay patient for 0.0127506. A move through 0.0140847 means the idea is wrong and the stop does its job.
Does PORTAL tag 0.0133065 first, or the stop?
7
·
--
Bullish
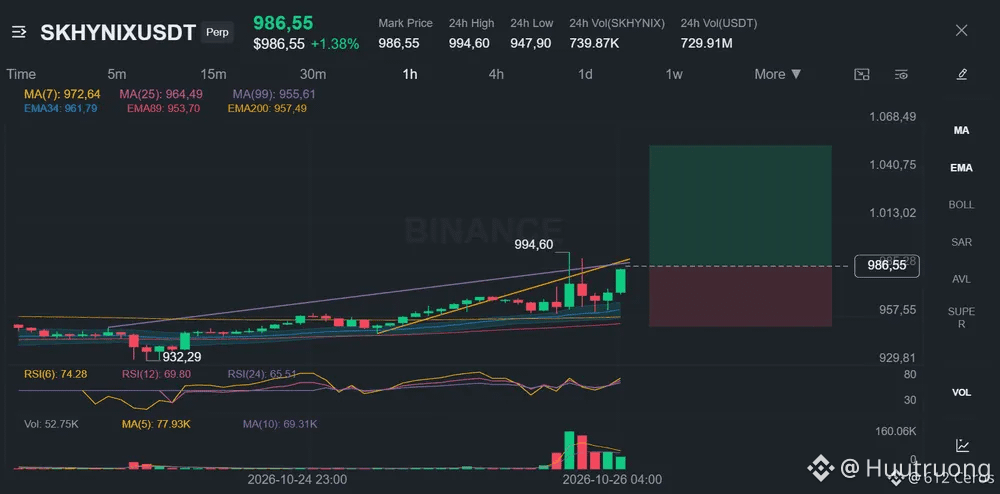
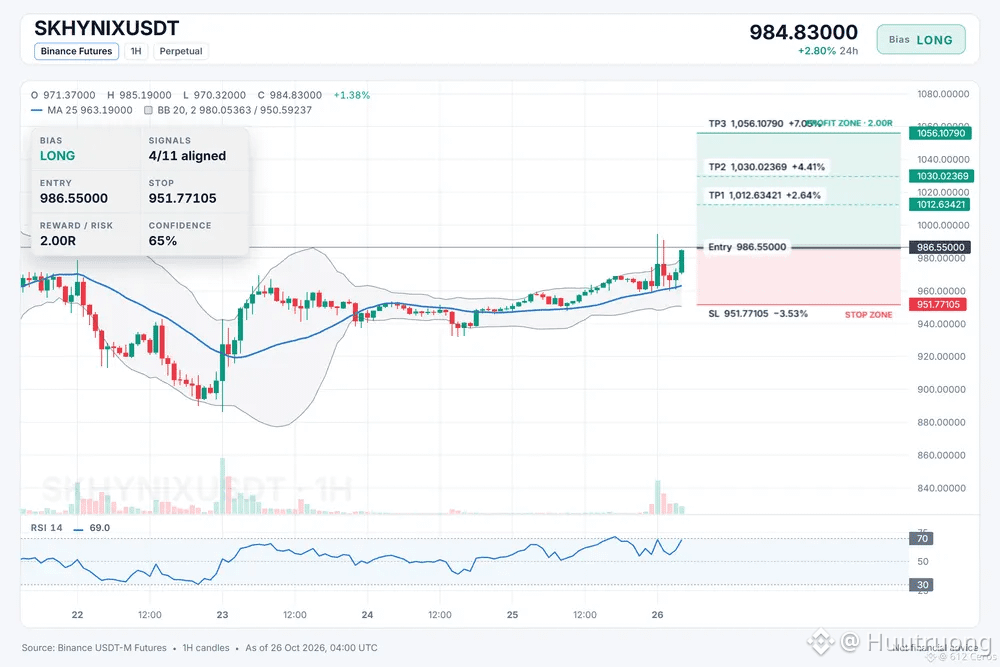
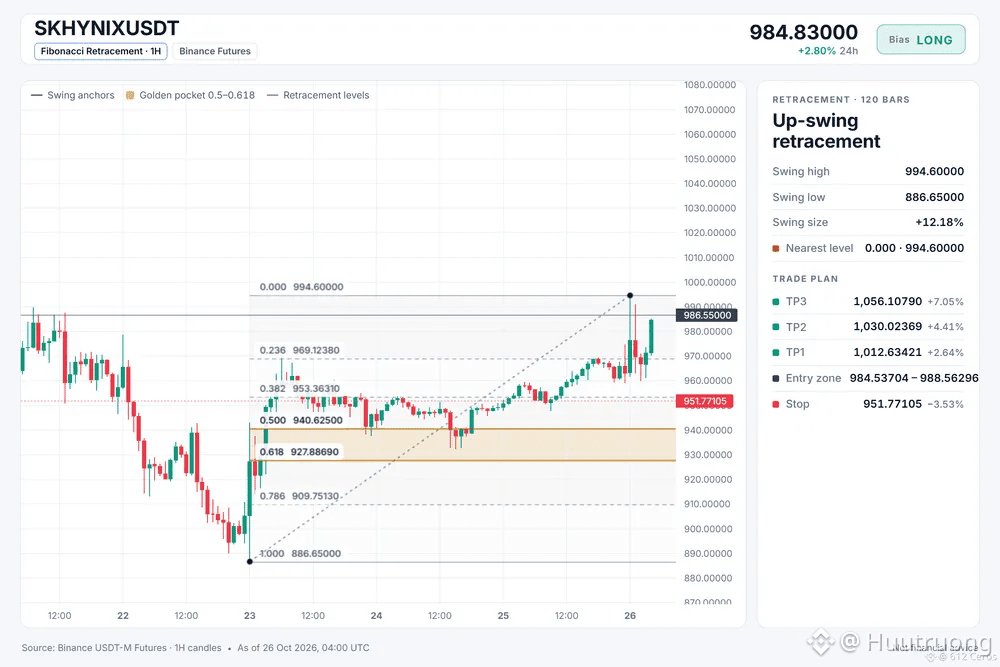
SKHYNIX looks stretched above its 1h EMA stack
🟢 LONG $SKHYNIX /USDT: expecting price to go UP
Bias: LONG · Leaning
Entry: 984.53704 – 988.56296
TP1: 1012.63421 (+2.6%)
TP2: 1030.02369 (+4.4%)
TP3: 1056.10790 (+7.1%)
SL: 951.77105 (-3.5%)
Plan: enter only inside the zone, close 50% at TP1, 25% at TP2, 25% at TP3, and move the stop to entry after TP1.
Note: moderate conviction only, keep size light.
Why LONG? 4/11 signals agree, 0 against.
• 1h trend up (above EMA50 & EMA200)
• Buyers have the momentum (4h RSI 59.1)
• Buyers have the momentum (1h RSI 69.0)
Bull path:
If the 1h trend holds above the EMA200, price could reach the first target, where the 1h RSI shows buyers still have momentum.
What kills it:
If price breaks the stop loss at the entry low, the daily range regime likely means this setup was wrong, so I would exit.
Where do you set your invalidation for this trade?
1
·
--
Bearish
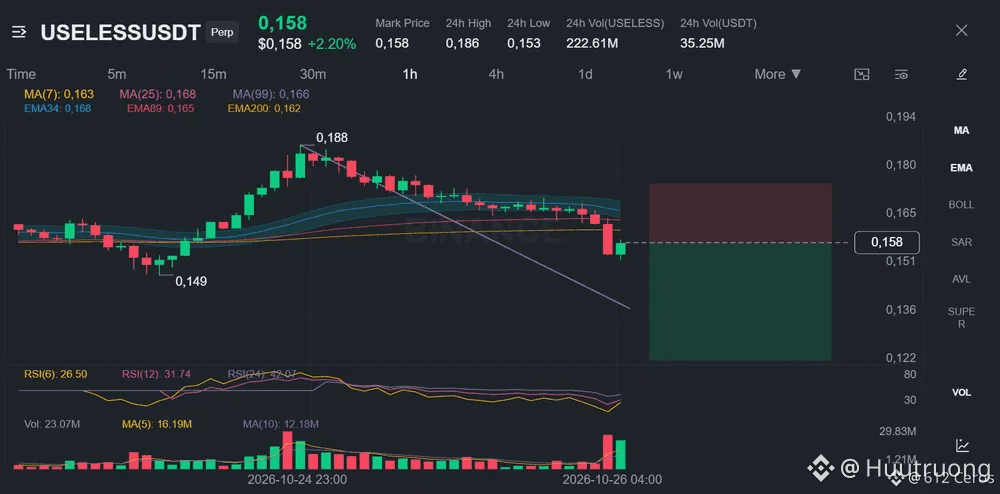
USELESS is grinding below its moving averages
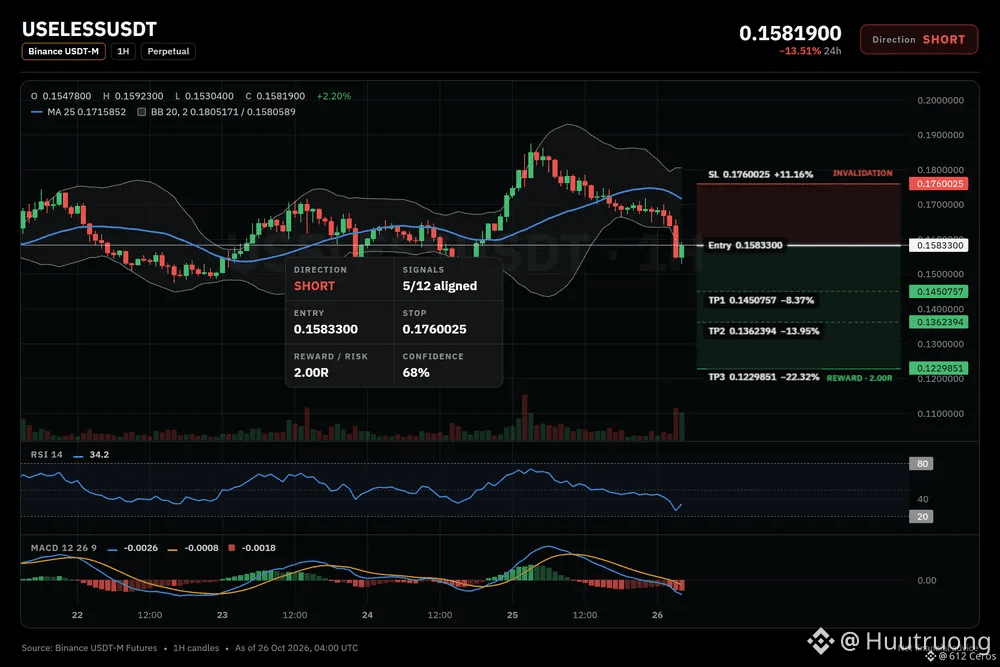
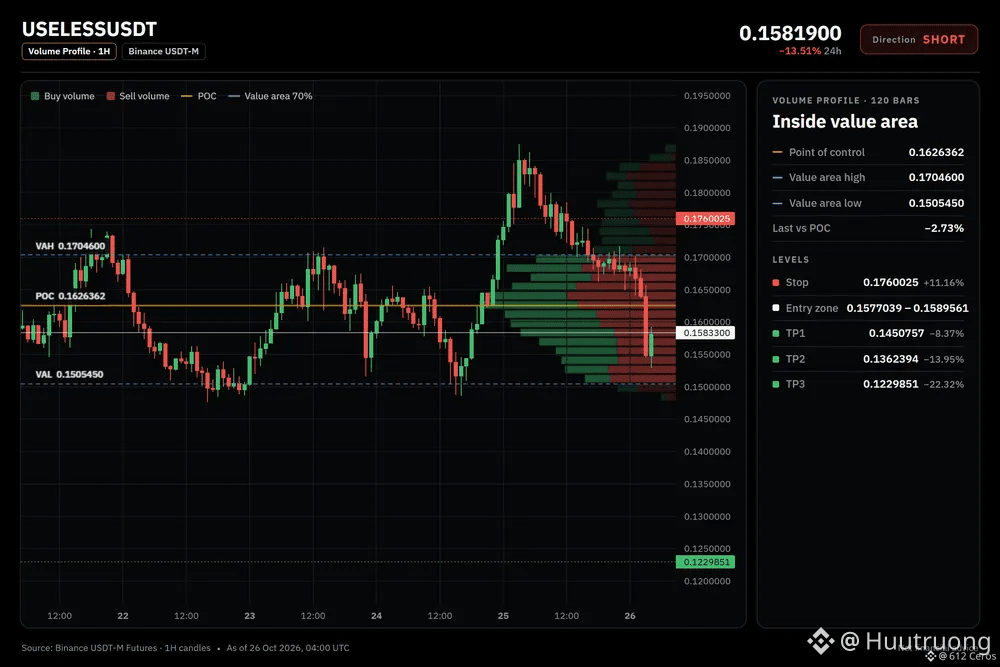
🔴 SHORT $USELESS /USDT: expecting price to go DOWN
Bias: SHORT · Leaning
Entry: 0.1577039 – 0.1589561
TP1: 0.1450757 (-8.4%)
TP2: 0.1362394 (-14.0%)
TP3: 0.1229851 (-22.3%)
SL: 0.1760025 (+11.2%)
Plan: enter only inside the zone, close 50% at TP1, 25% at TP2, 25% at TP3, and move the stop to entry after TP1.
Note: moderate conviction only, keep size light.
Why SHORT? 5/12 signals agree, 0 against.
• 4h trend down (below EMA50 & EMA200)
• Sellers are driving the move (15m ADX 37.1)
• Sellers have the momentum (4h RSI 43.4)
Q: Why short when the daily trend is range?
A: The 4h chart shows a bearish stack with price below both EMAs.
Q: When is this setup wrong?
A: If price holds above 0.1760025 the short thesis fails.
What is your invalidation level for this trade?
9
·
--
Bearish
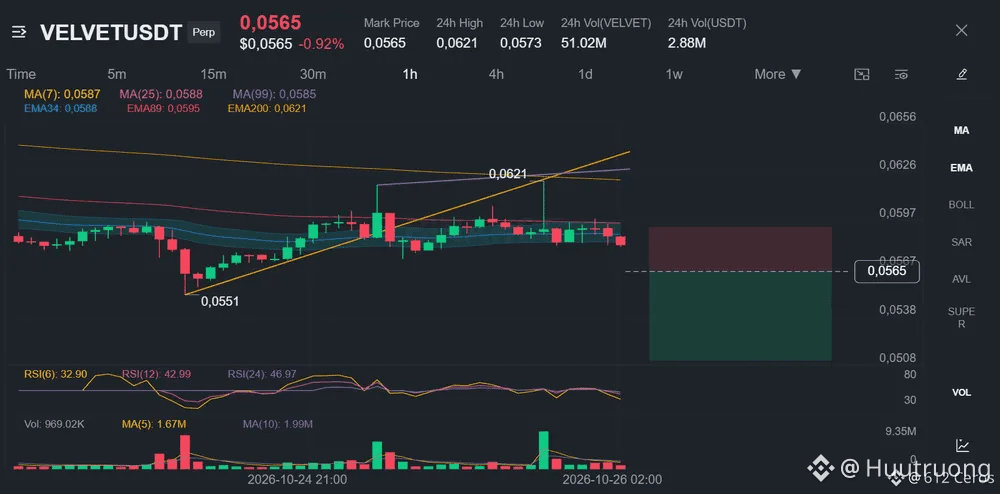
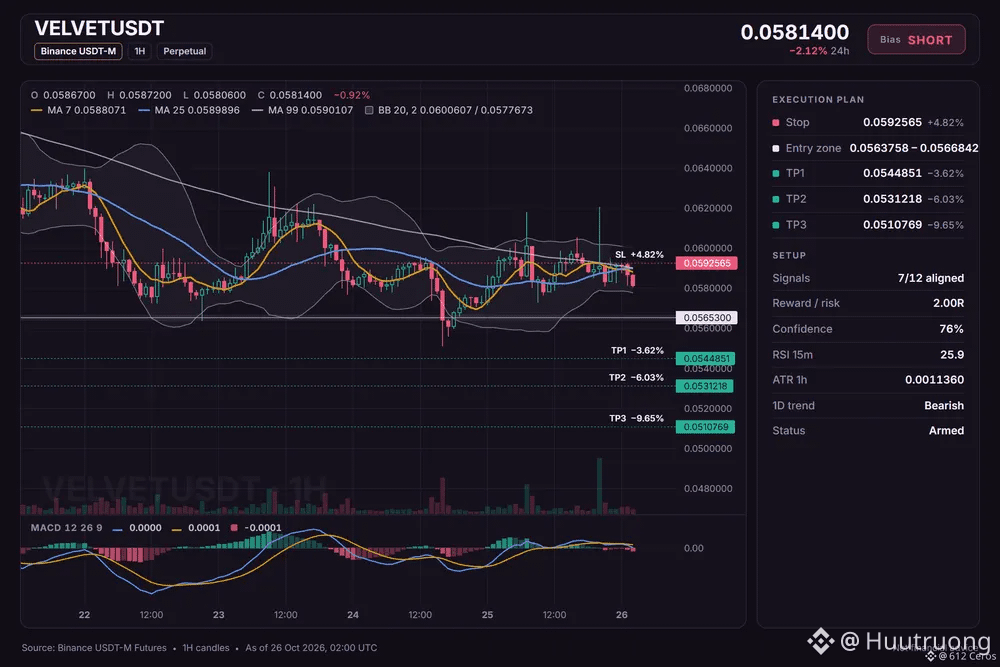
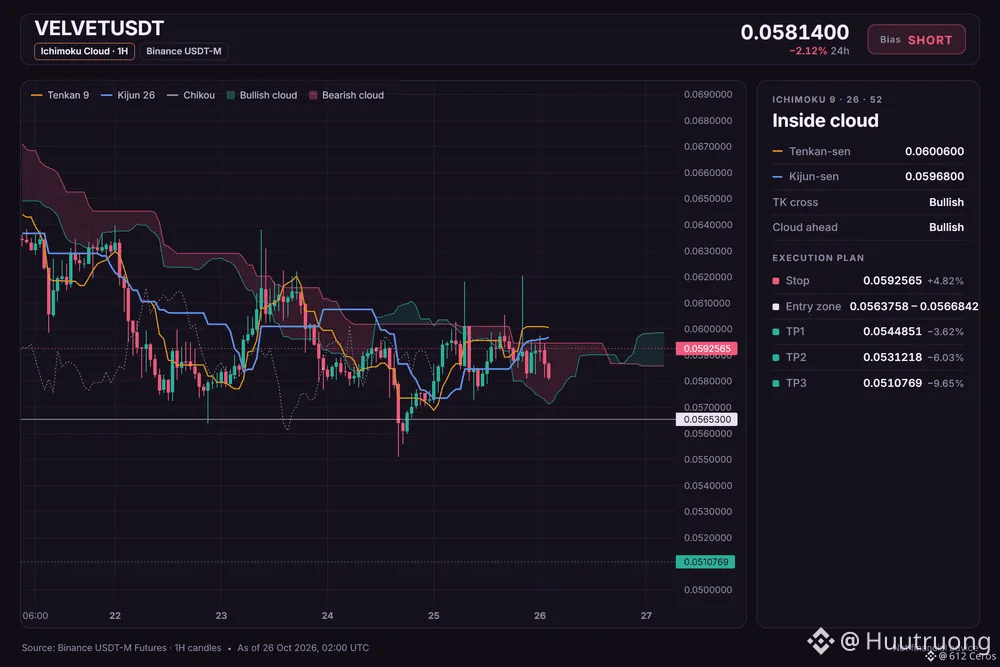
VELVET short setup: the levels I'm watching
🔴 SHORT $VELVET /USDT: expecting price to go DOWN
Bias: SHORT · Strong
Entry: 0.0563758 – 0.0566842
TP1: 0.0544851 (-3.6%)
TP2: 0.0531218 (-6.0%)
TP3: 0.0510769 (-9.6%)
SL: 0.0592565 (+4.8%)
Plan: enter only inside the zone, close 50% at TP1, 25% at TP2, 25% at TP3, and move the stop to entry after TP1.
Why SHORT? 7/12 signals agree, 1 against.
• Daily trend down (below EMA50 & EMA200)
• 4h trend down (below EMA50 & EMA200)
• 1h trend down (below EMA50 & EMA200)
Risk: Range bottom, buyers often step in (RSI z −2.72)
In plain words:
The daily trend reads bearish, and 7/12 signals aligned favour the short side. The plan is to work the 0.0563758 – 0.0566842 zone, scale out at 0.0544851 and 0.0531218, and stay patient for 0.0510769. A move through 0.0592565 means the idea is wrong and the stop does its job.
Does VELVET tag 0.0544851 first, or the stop?
6
·
--
Bearish
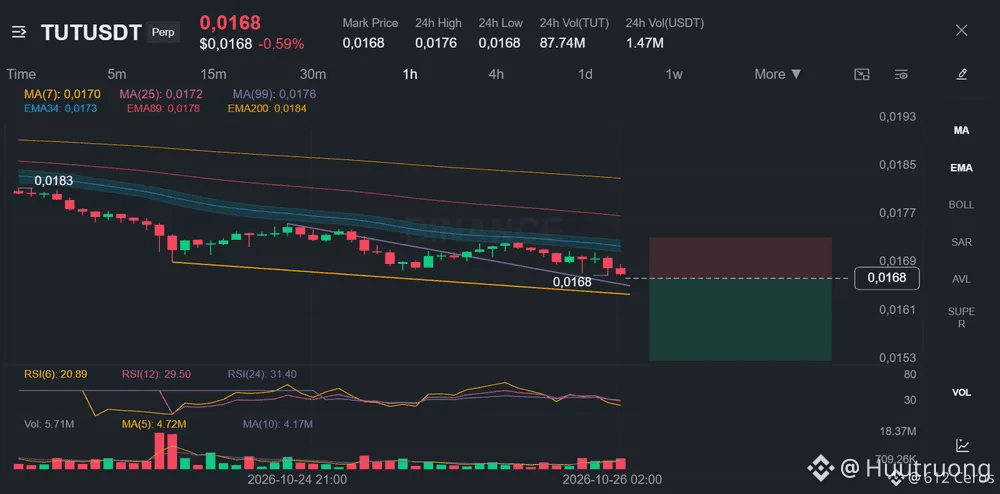
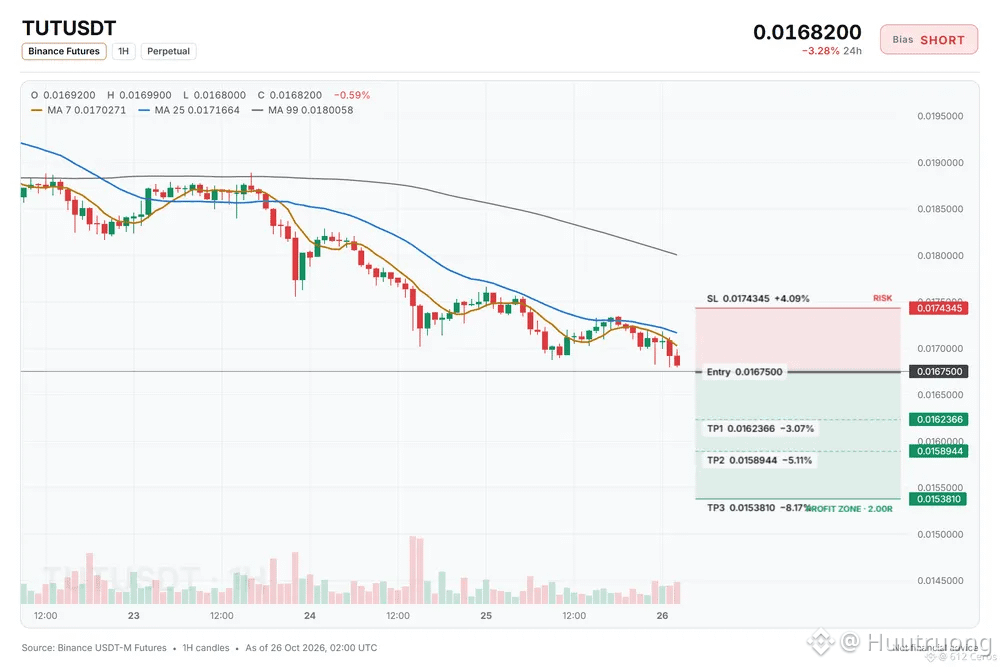
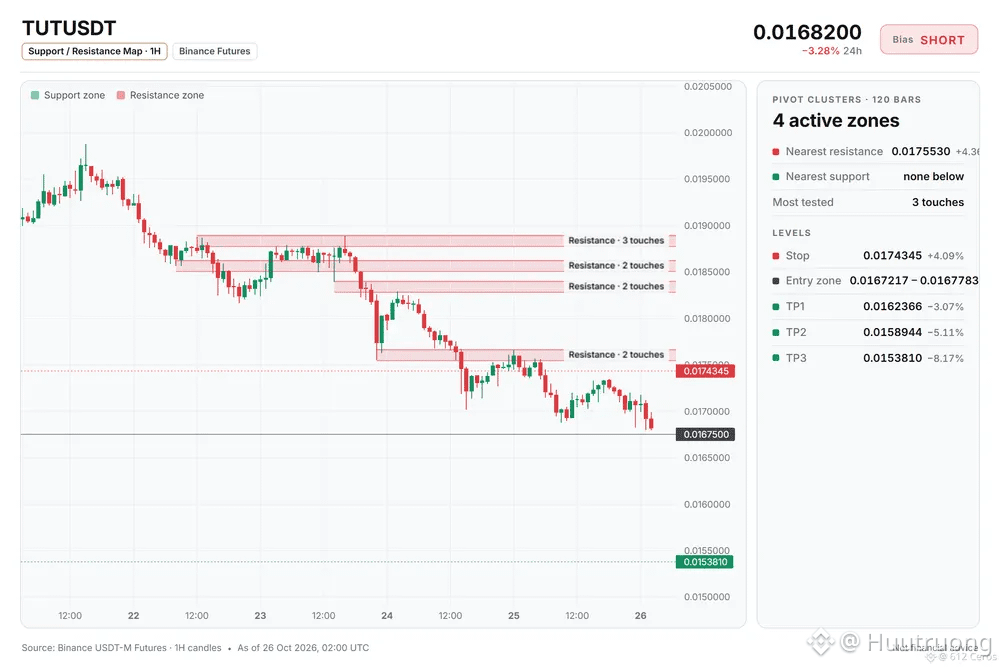
TUT is grinding below both EMAs across two timeframes.
🔴 SHORT $TUT /USDT: expecting price to go DOWN
Bias: SHORT · Strong
Entry: 0.0167217 – 0.0167783
TP1: 0.0162366 (-3.1%)
TP2: 0.0158944 (-5.1%)
TP3: 0.0153810 (-8.2%)
SL: 0.0174345 (+4.1%)
Plan: enter only inside the zone, close 50% at TP1, 25% at TP2, 25% at TP3, and move the stop to entry after TP1.
Why SHORT? checklist: 8/12 agree, 1 against.
• 4h trend down (below EMA50 & EMA200)
• 1h trend down (below EMA50 & EMA200)
• Sellers are driving the move (15m ADX 34.4)
Watch: Far below its average, bounce likely (−3.7 ATR from 1h EMA50)
Watch: The idea is wrong if price reaches the stop at 0.0174345
Bottom line: The 4h bearish stack and strong seller momentum support the short, but price is 3.7 ATR below the 1h EMA50, so a bounce is possible.
Where would you set your short entry on ?
4
·
--
Bearish
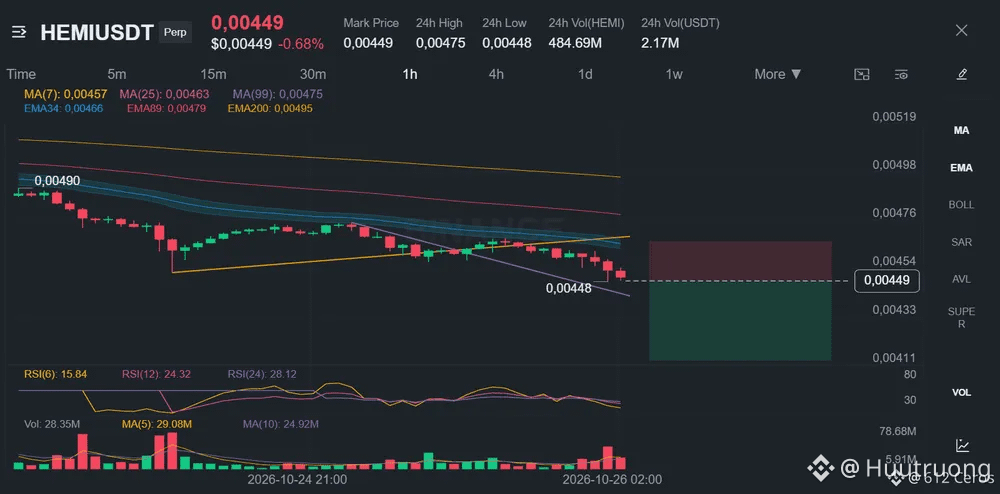
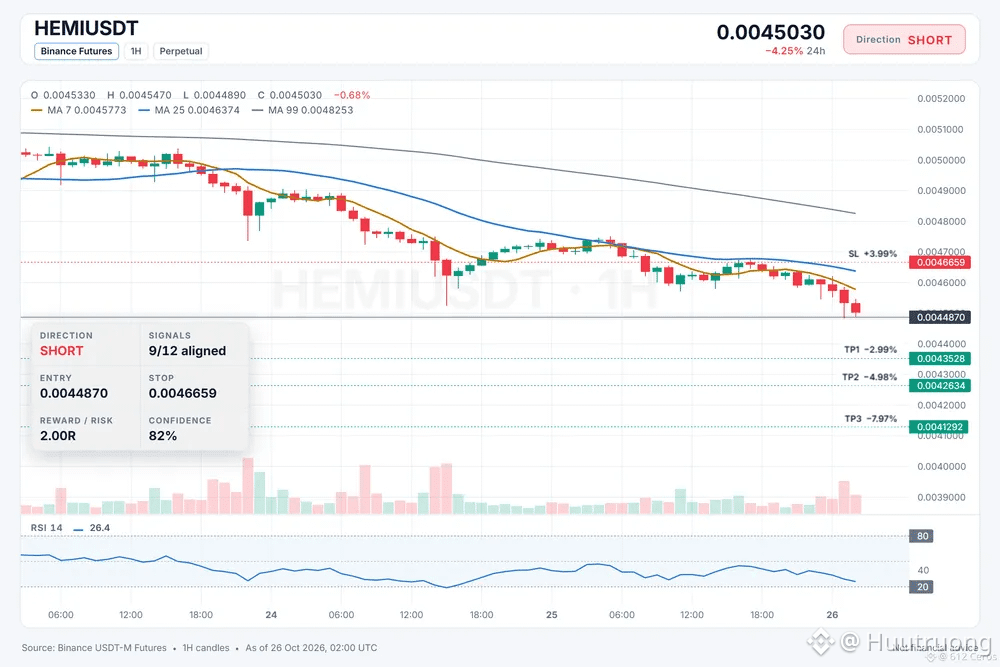
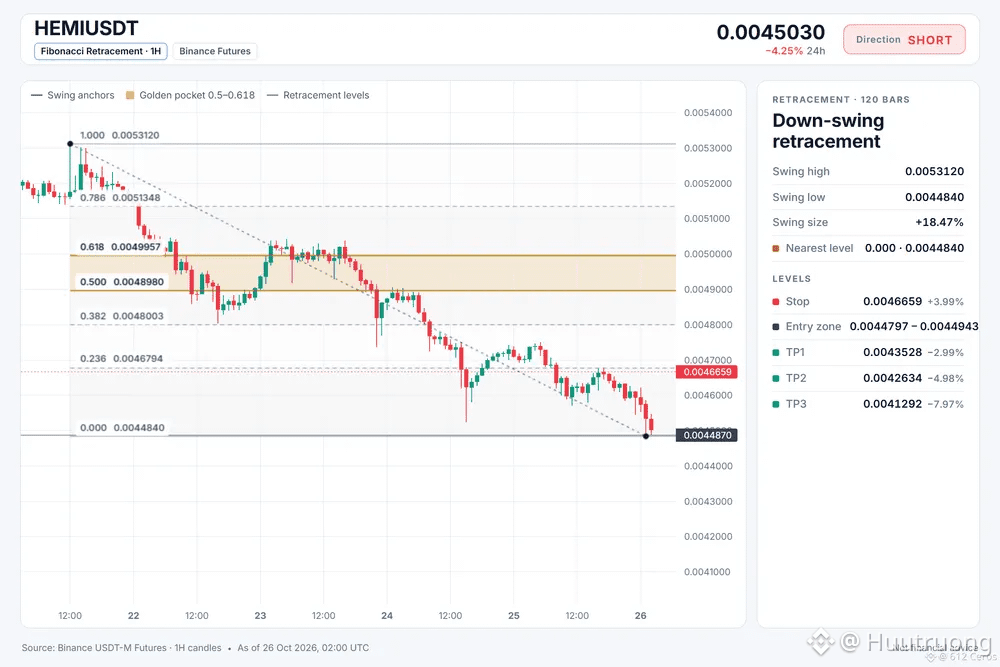
HEMI is grinding lower through a bearish stack across timeframes.
🔴 SHORT $HEMI /USDT: expecting price to go DOWN
Bias: SHORT · Strong
Entry: 0.0044797 – 0.0044943
TP1: 0.0043528 (-3.0%)
TP2: 0.0042634 (-5.0%)
TP3: 0.0041292 (-8.0%)
SL: 0.0046659 (+4.0%)
Plan: enter only inside the zone, close 50% at TP1, 25% at TP2, 25% at TP3, and move the stop to entry after TP1.
Why SHORT? 9/12 signals agree, 1 against.
• Daily trend down (below EMA50 & EMA200)
• 4h trend down (below EMA50 & EMA200)
• 1h trend down (below EMA50 & EMA200)
Risk: Far below its average, bounce likely (−4.2 ATR from 1h EMA50)
Bear path:
If the idea works, price should keep sliding toward the 1h EMA50, confirming the bearish momentum.
What kills it:
A bounce back above the entry invalidates the short and proves the sellers are exhausted.
Where do you see HEMI finding resistance first?
3
·
--
Bearish
Liệu BTC có thể tiếp tục giảm xuống trong vùng giảm giá 4 giờ không?
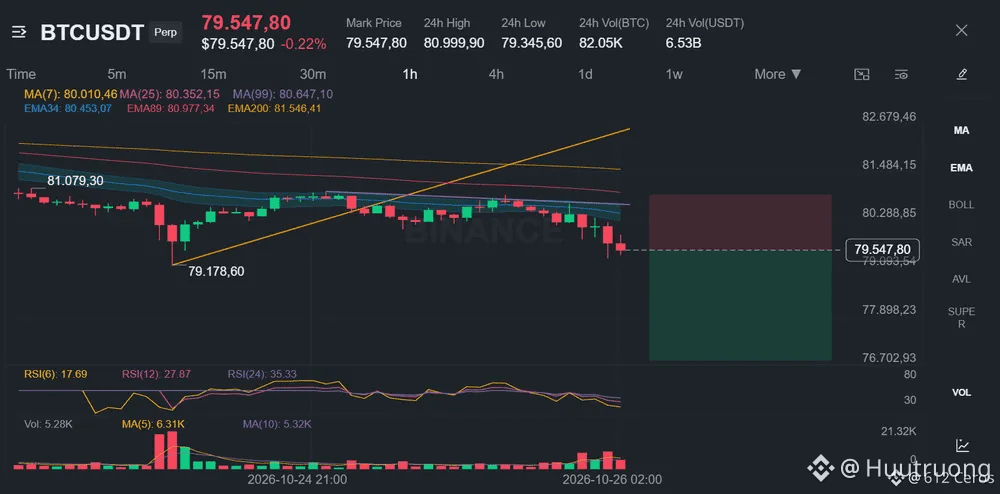
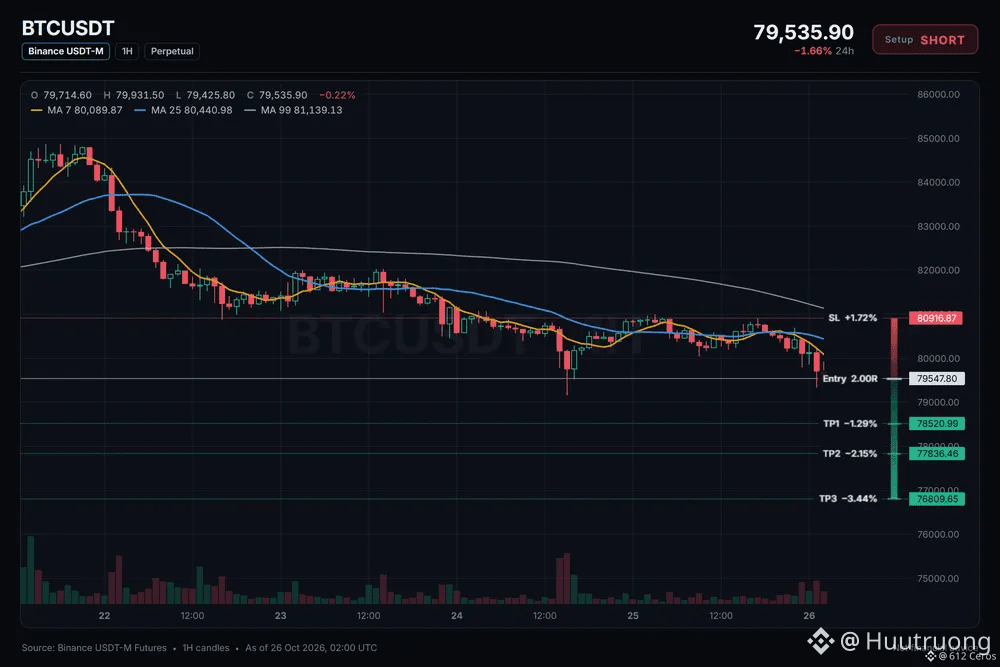
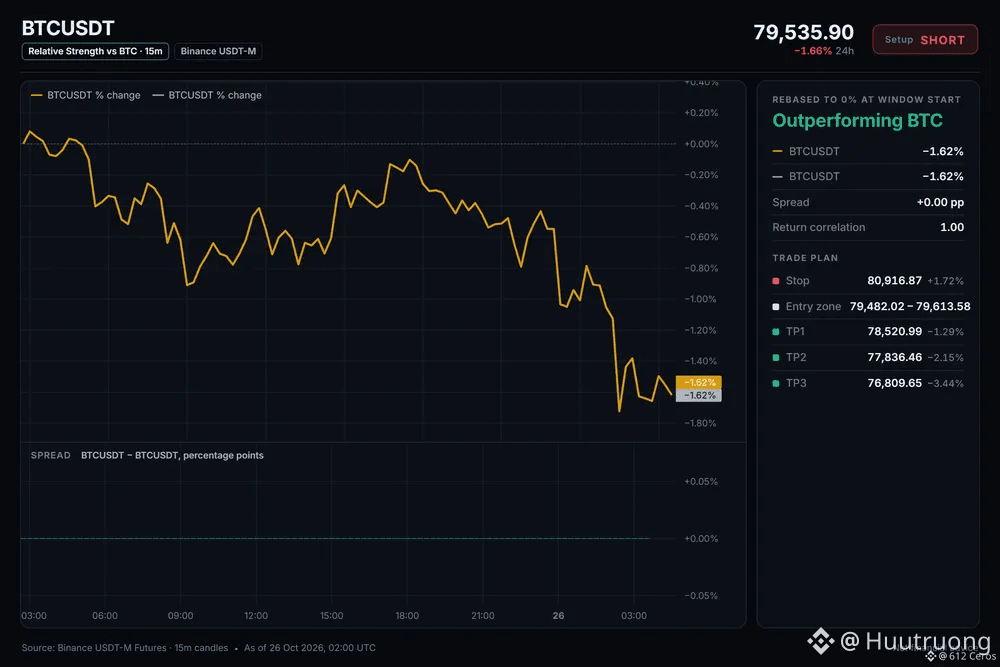
🔴 BÁN KHỐNG $BTC /USDT: dự đoán giá sẽ GIẢM.
Xu hướng: BÁN KHỐNG · Điểm vào lệnh mạnh
: 79482.02 – 79613.58
TP1: 78520.99 (-1.3%)
TP2: 77836.46 (-2.2%)
TP3: 76809.65 (-3.4%)
SL: 80916.87 (+1.7%)
Kế hoạch: chỉ vào lệnh trong vùng này, chốt lời 50% tại TP1, 25% tại TP2, 25% tại TP3, và di chuyển điểm dừng lỗ về điểm vào lệnh sau TP1.
Tại sao BÁN KHỐNG? 6/12 tín hiệu đồng ý, 0 tín hiệu phản đối.
• Xu hướng giảm trên biểu đồ 4 giờ (dưới EMA50 & EMA200)
• Xu hướng giảm trên biểu đồ 1 giờ (dưới EMA50 & EMA200)
• Người bán đang đẩy giá xuống (ADX 15 phút ở mức 33.3)
Tại sao lại là bây giờ?
Xu hướng 4 giờ cho thấy giá nằm dưới cả EMA 50 và 200, với người bán đang đẩy giá xuống khi ADX ở mức 33.3 và RSI 1 giờ ở mức 30.2. Xu hướng hàng ngày đang đi ngang và bối cảnh BTC đang giảm, vì vậy thiết lập lệnh bán phù hợp với động lượng chung. Cửa sổ vào lệnh là từ 79482.02 đến 79613.58.
Bạn sẽ đặt điểm hủy lệnh ở đâu nếu bạn thực hiện lệnh bán này?
14
·
--
Kite and the Next Chapter of the Agent Economy
The real opportunity in the agent economy is not simply creating more AI agents. It is building an environment where agents can coordinate, interact, and contribute to meaningful economic activity.
As AI agents become more capable, a critical question emerges: how can independent agents discover opportunities, establish trust, and collaborate effectively across digital ecosystems?
This is where I believe Kite deserves attention. Rather than looking at the agent economy only through the lens of AI performance, we should also consider the infrastructure, coordination, and participation needed to make agent-driven systems useful in practice.
For Web3, the deeper opportunity lies at the intersection of autonomous software and open digital networks. If agents can participate more effectively in these environments, entirely new forms of collaboration and digital services may become possible. However, real progress will depend on practical adoption, security, reliability, and measurable utility—not hype alone.
My perspective is that the future of the agent economy will be shaped not by the number of agents created, but by how well they work together to solve real problems.
How do you think projects like Kite can help turn the agent economy from an emerging idea into practical infrastructure?
[https://app.binance.com/uni-qr/cpro/Deaflove?l=en&r=JQ3F4UE9&uc=web_square_share_link&us=copylink](https://app.binance.com/uni-qr/cpro/Deaflove?l=en&r=JQ3F4UE9&uc=web_square_share_link&us=copylink)
#KiteBBW $KITE @GoKiteAI
Kite and the Next Chapter of the Agent Economy
The real opportunity in the agent economy is not simply creating more AI agents. It is building an environment where agents can coordinate, interact, and contribute to meaningful economic activity.
As AI agents become more capable, a critical question emerges: how can independent agents discover opportunities, establish trust, and collaborate effectively across digital ecosystems?
This is where I believe Kite deserves attention. Rather than looking at the agent economy only through the lens of AI performance, we should also consider the infrastructure, coordination, and participation needed to make agent-driven systems useful in practice.
For Web3, the deeper opportunity lies at the intersection of autonomous software and open digital networks. If agents can participate more effectively in these environments, entirely new forms of collaboration and digital services may become possible. However, real progress will depend on practical adoption, security, reliability, and measurable utility—not hype alone.
My perspective is that the future of the agent economy will be shaped not by the number of agents created, but by how well they work together to solve real problems.
How do you think projects like Kite can help turn the agent economy from an emerging idea into practical infrastructure?
https://app.binance.com/uni-qr/cpro/Deaflove?l=en&r=JQ3F4UE9&uc=web_square_share_link&us=copylink
#KiteBBW $KITE @GoKiteAI

35
·
--
Bearish
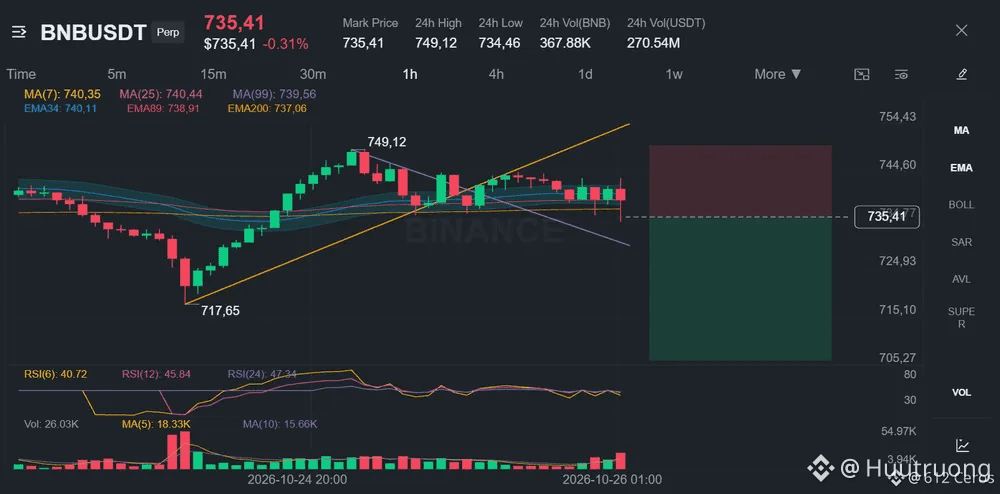
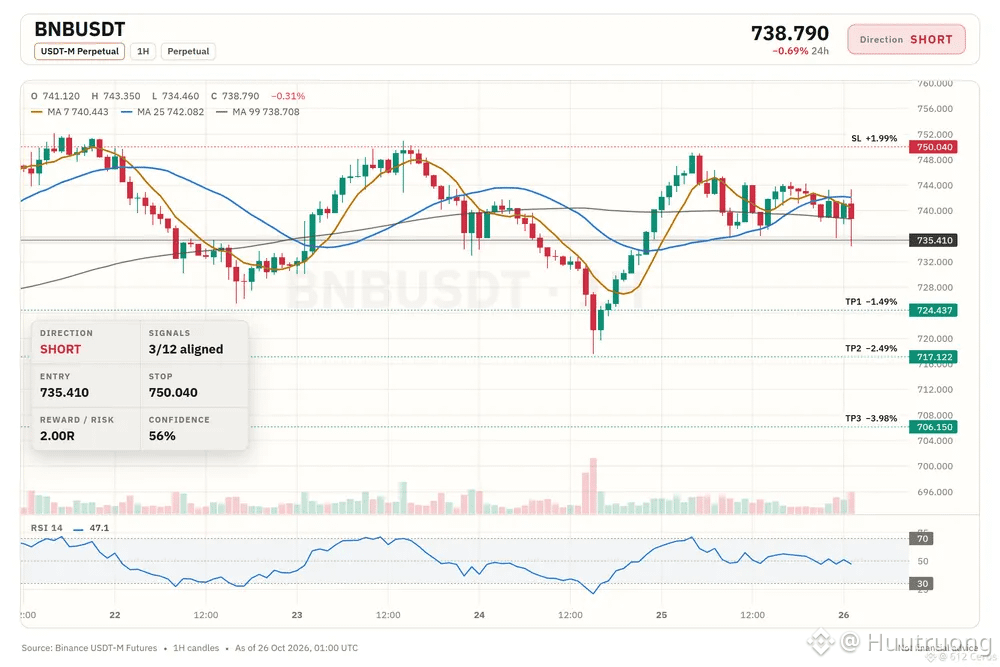
price below both EMAs on the 4h chart
🔴 SHORT $BNB /USDT: expecting price to go DOWN
Bias: SHORT · Leaning
Entry: 734.743 – 736.077
TP1: 724.437 (-1.5%)
TP2: 717.122 (-2.5%)
TP3: 706.150 (-4.0%)
SL: 750.040 (+2.0%)
Plan: enter only inside the zone, close 50% at TP1, 25% at TP2, 25% at TP3, and move the stop to entry after TP1.
Caution: counter-trend idea backed by 3 signals only. Smaller size, hard stop.
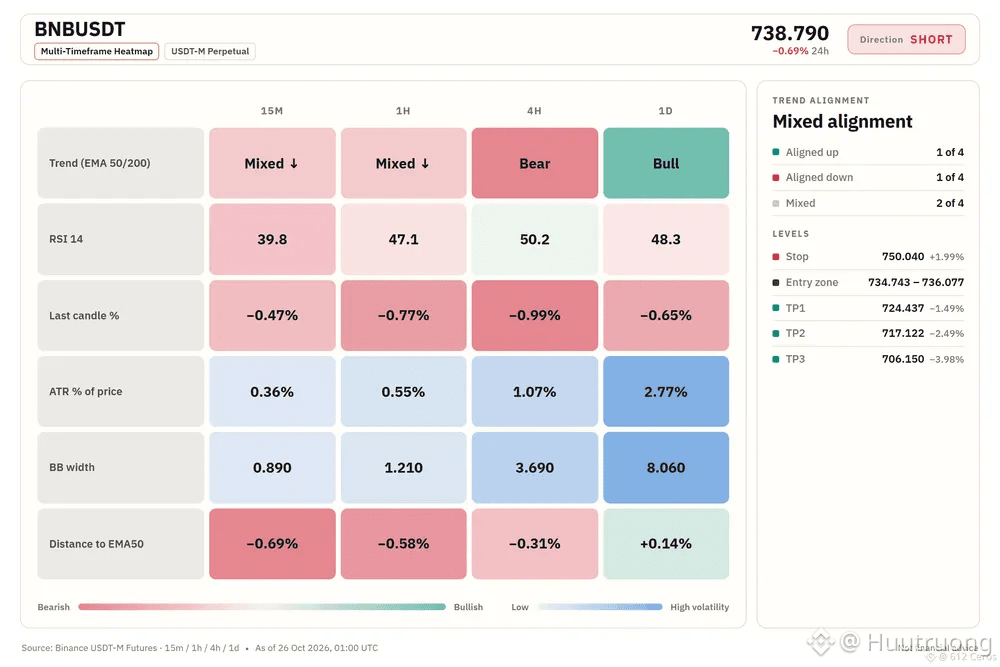
Why SHORT? 3/12 signals agree, 1 against.
• 4h trend down (below EMA50 & EMA200)
• is falling, this coin follows (corr 0.90)
• Sellers are pushing right now (−0.47% 15m candle)
Risk: Daily trend up (above EMA50 & EMA200)
Trade note:
I'm watching for a short on because the 4h trend shows price below the EMA50 and EMA200, a bearish stack. The 15m RSI is 39.78, a reading below 50 that means sellers are in control right now. I want to see BNB push from the 1h price of 735.41 toward the daily trend, but the daily trend is bullish, so this is a counter-trend reversal bet and I will size down and respect the stop at 750.040. The strongest support is the 4h bearish stack and the BTC backdrop with a 0.90 correlation showing BTC is falling and BNB tends to follow; the main risk is the bullish daily trend stacking against the setup.
Where do you take profit on this short?
32
·
--
Bearish
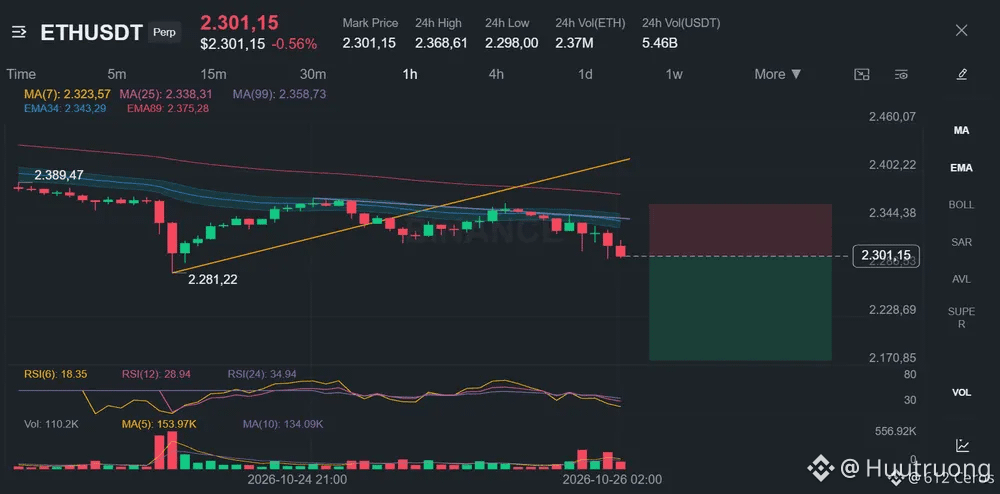
ETH shows a bearish stack across every trend timeframe
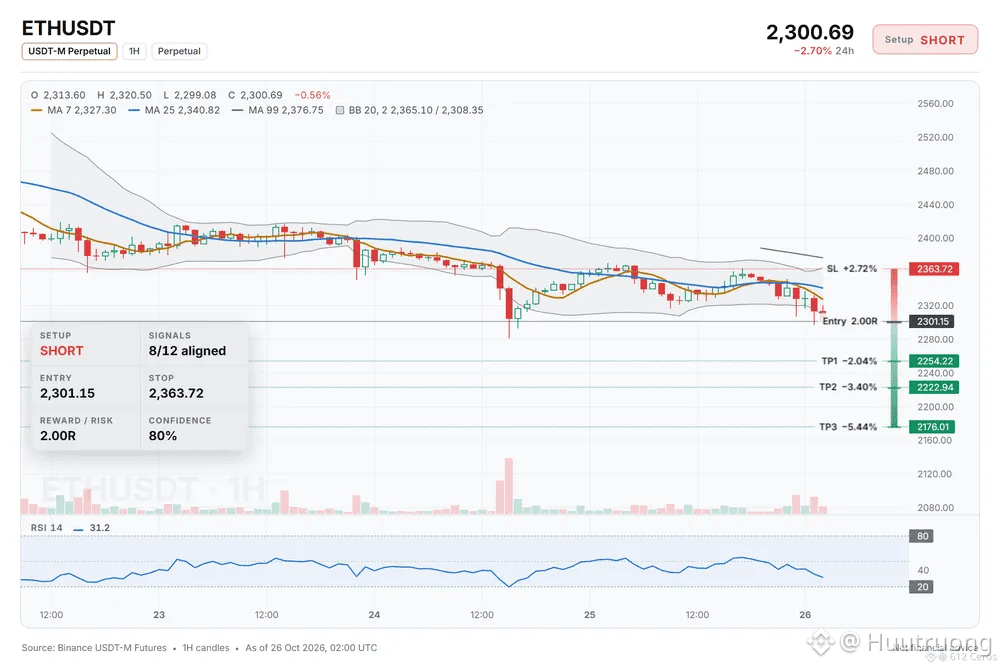
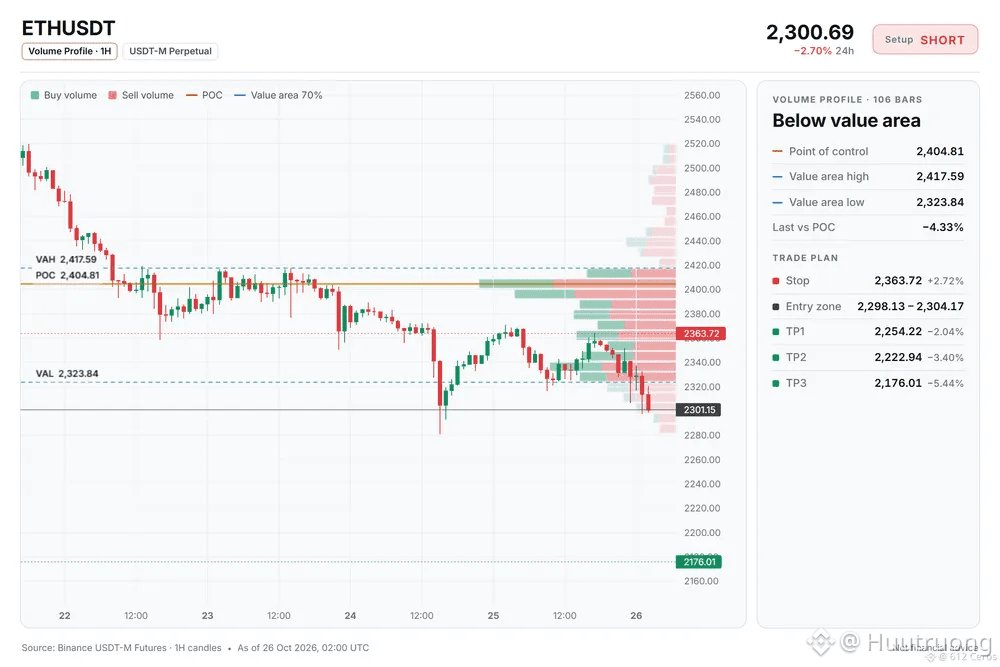
🔴 SHORT $ETH /USDT: expecting price to go DOWN
Bias: SHORT · Strong
Entry: 2298.13 – 2304.17
TP1: 2254.22 (-2.0%)
TP2: 2222.94 (-3.4%)
TP3: 2176.01 (-5.4%)
SL: 2363.72 (+2.7%)
Plan: enter only inside the zone, close 50% at TP1, 25% at TP2, 25% at TP3, and move the stop to entry after TP1.
Why SHORT? 8/12 signals agree, 0 against.
• 4h trend down (below EMA50 & EMA200)
• 1h trend down (below EMA50 & EMA200)
• Sellers are driving the move (15m ADX 36.5)
Q: Why short now?
A: The 4h trend shows price below EMA50 below EMA200, confirming the swing trend is down.
Q: When is this trade wrong?
A: If the 1h price moves above 2363.72, the invalidation level is hit and the setup fails.
What is your level if this fails?
47
·
--
Bearish
Range breaks often flip into fast moves lower.
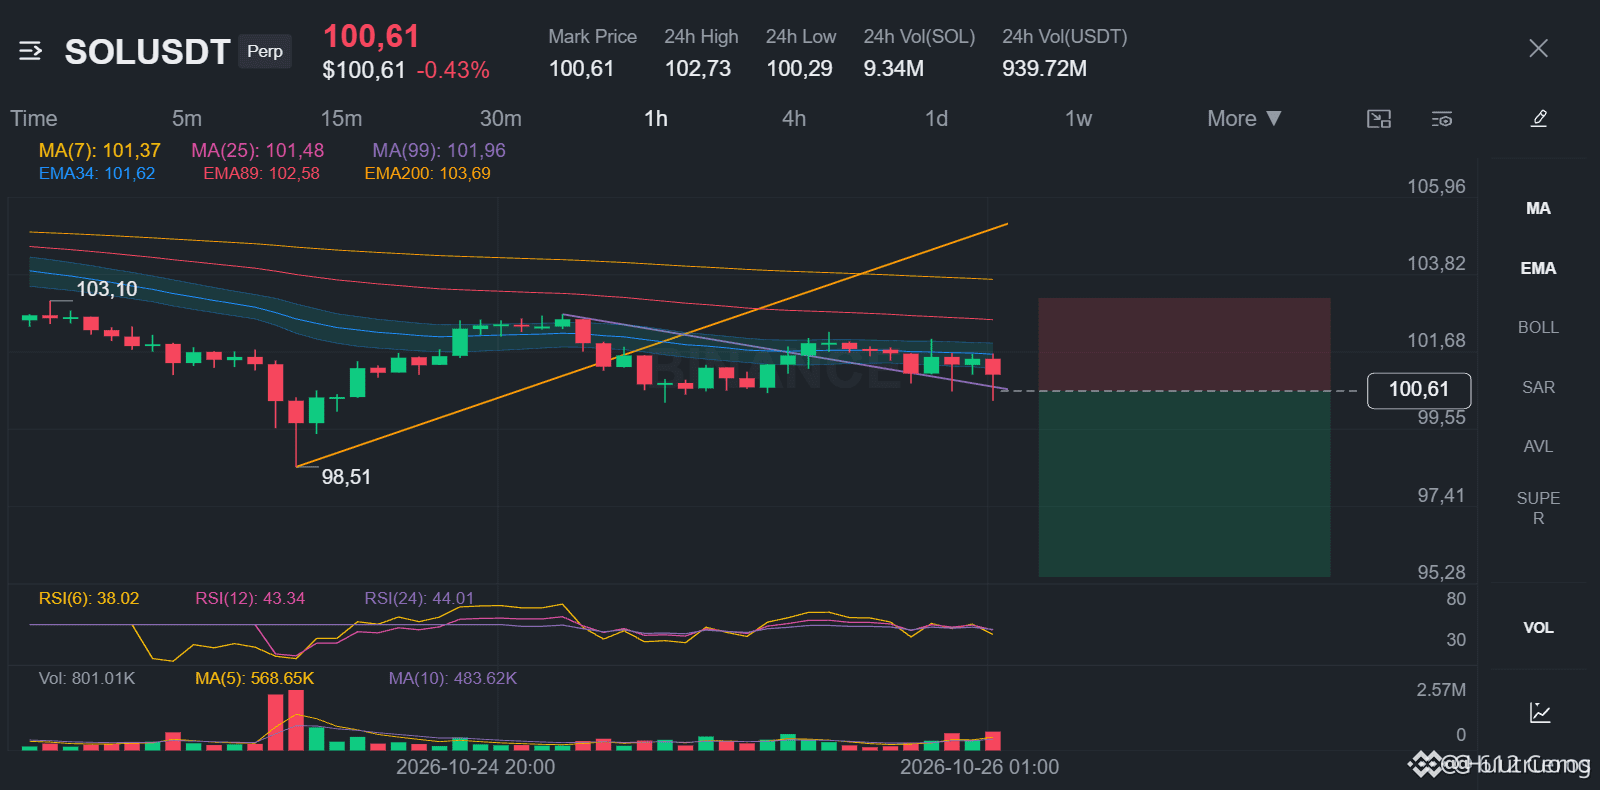
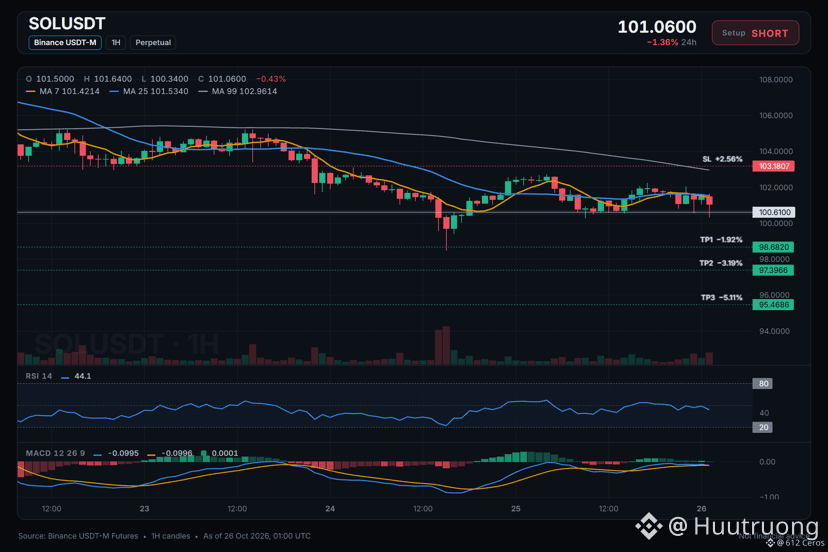
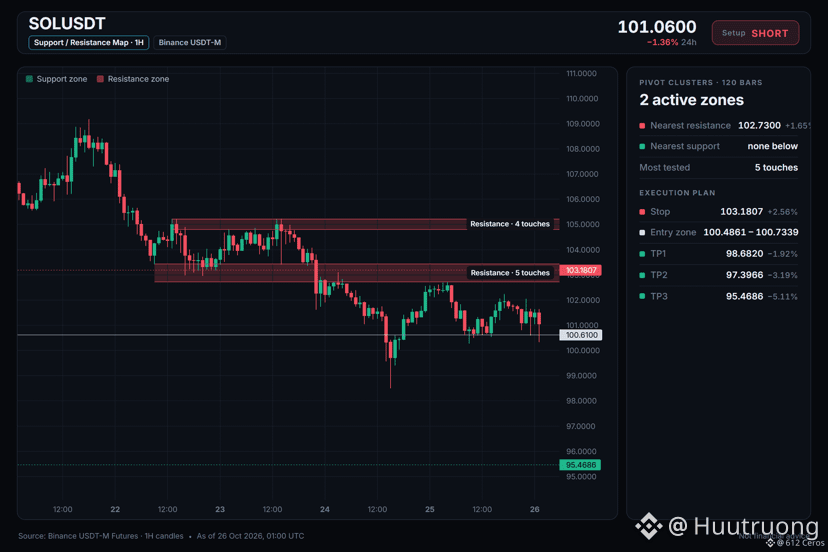
🔴 SHORT $SOL /USDT: expecting price to go DOWN
Bias: SHORT · Strong
Entry: 100.4861 – 100.7339
TP1: 98.6820 (-1.9%)
TP2: 97.3966 (-3.2%)
TP3: 95.4686 (-5.1%)
SL: 103.1807 (+2.6%)
Plan: enter only inside the zone, close 50% at TP1, 25% at TP2, 25% at TP3, and move the stop to entry after TP1.
Why SHORT? 7/12 signals agree, 1 against.
• 4h trend down (below EMA50 & EMA200)
• 1h trend down (below EMA50 & EMA200)
• Sellers are driving the move (15m ADX 24.6)
Risk: Range bottom, buyers often step in (RSI z −2.04)
The short version:
1. The daily trend is range bound but the 4h trend is a clear bearish stack.
2. The 1h trend is also bearish with price below EMA50 and EMA200.
3. A bounce back to the 1h EMA50 would make this idea wrong.
What level would make you take the other side?
{spot}(SOLUSDT)
Range breaks often flip into fast moves lower.
🔴 SHORT $SOL /USDT: expecting price to go DOWN
Bias: SHORT · Strong
Entry: 100.4861 – 100.7339
TP1: 98.6820 (-1.9%)
TP2: 97.3966 (-3.2%)
TP3: 95.4686 (-5.1%)
SL: 103.1807 (+2.6%)
Plan: enter only inside the zone, close 50% at TP1, 25% at TP2, 25% at TP3, and move the stop to entry after TP1.
Why SHORT? 7/12 signals agree, 1 against.
• 4h trend down (below EMA50 & EMA200)
• 1h trend down (below EMA50 & EMA200)
• Sellers are driving the move (15m ADX 24.6)
Risk: Range bottom, buyers often step in (RSI z −2.04)
The short version:
1. The daily trend is range bound but the 4h trend is a clear bearish stack.
2. The 1h trend is also bearish with price below EMA50 and EMA200.
3. A bounce back to the 1h EMA50 would make this idea wrong.
What level would make you take the other side?
58
·
--
Bearish
ONG looks ripe for a short, but conviction is moderate.
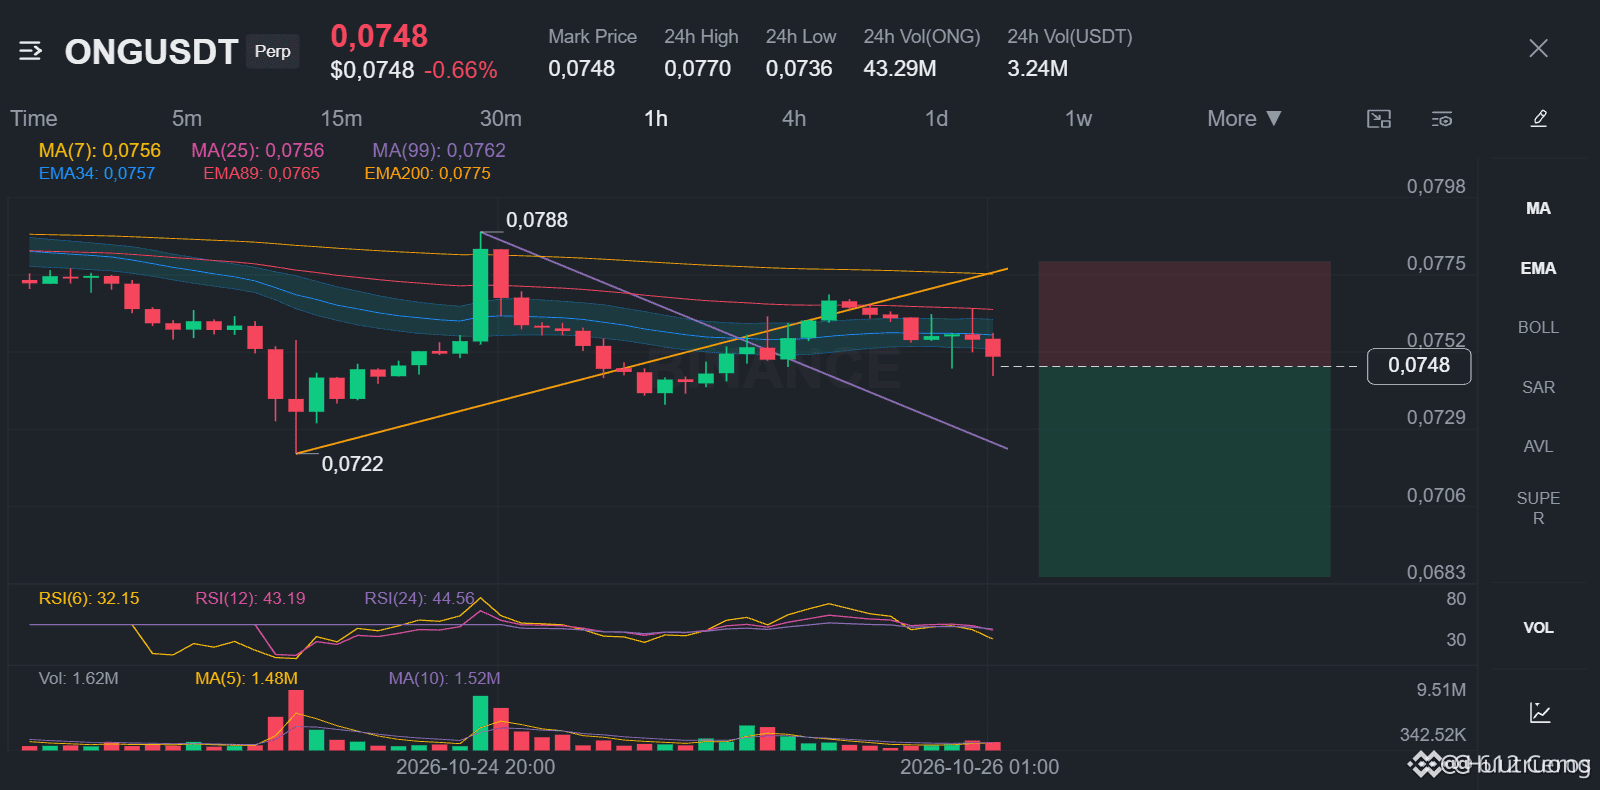
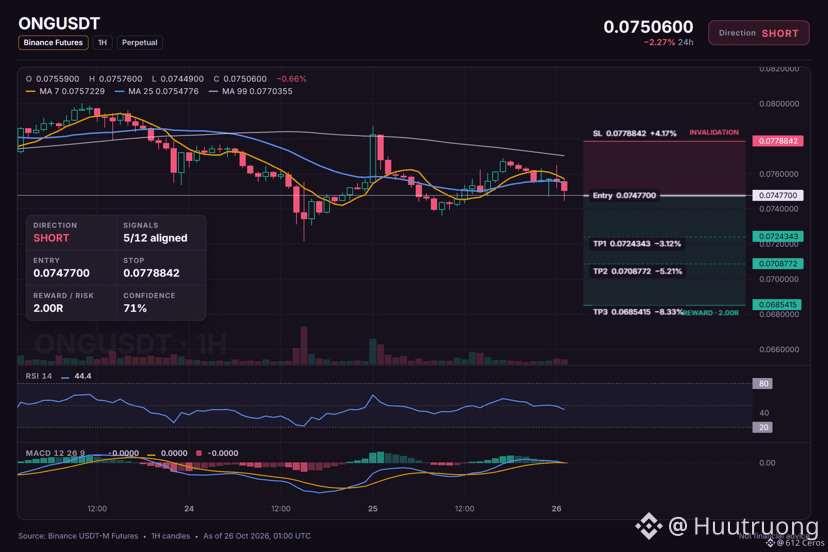
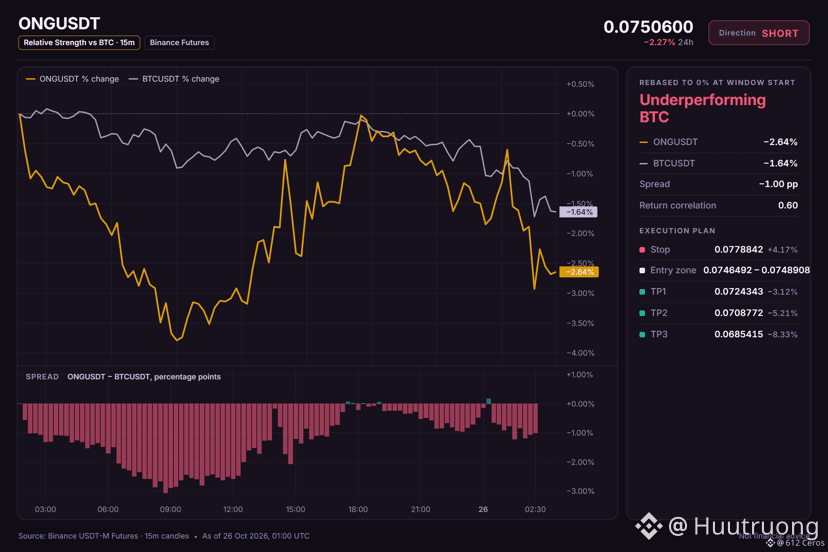
🔴 SHORT $ONG /USDT: expecting price to go DOWN
Bias: SHORT · Leaning
Entry: 0.0746492 – 0.0748908
TP1: 0.0724343 (-3.1%)
TP2: 0.0708772 (-5.2%)
TP3: 0.0685415 (-8.3%)
SL: 0.0778842 (+4.2%)
Plan: enter only inside the zone, close 50% at TP1, 25% at TP2, 25% at TP3, and move the stop to entry after TP1.
Note: moderate conviction only, keep size light.
Why SHORT? 5/12 signals agree, 0 against.
• 4h trend down (below EMA50 & EMA200)
• 1h trend down (below EMA50 & EMA200)
• Sellers are driving the move (15m ADX 22.2)
In plain words:
ONG is sliding in a bearish stack across the 1h and 4h timeframes, with the 4h trend pointing down. The 1h RSI sits below 45, showing sellers still have the momentum, and ADX shows DI- well above DI+, meaning sellers are in control.
Where would you place your stop for this short?
{spot}(ONGUSDT)
ONG looks ripe for a short, but conviction is moderate.
🔴 SHORT $ONG /USDT: expecting price to go DOWN
Bias: SHORT · Leaning
Entry: 0.0746492 – 0.0748908
TP1: 0.0724343 (-3.1%)
TP2: 0.0708772 (-5.2%)
TP3: 0.0685415 (-8.3%)
SL: 0.0778842 (+4.2%)
Plan: enter only inside the zone, close 50% at TP1, 25% at TP2, 25% at TP3, and move the stop to entry after TP1.
Note: moderate conviction only, keep size light.
Why SHORT? 5/12 signals agree, 0 against.
• 4h trend down (below EMA50 & EMA200)
• 1h trend down (below EMA50 & EMA200)
• Sellers are driving the move (15m ADX 22.2)
In plain words:
ONG is sliding in a bearish stack across the 1h and 4h timeframes, with the 4h trend pointing down. The 1h RSI sits below 45, showing sellers still have the momentum, and ADX shows DI- well above DI+, meaning sellers are in control.
Where would you place your stop for this short?
81
·
--
Bearish
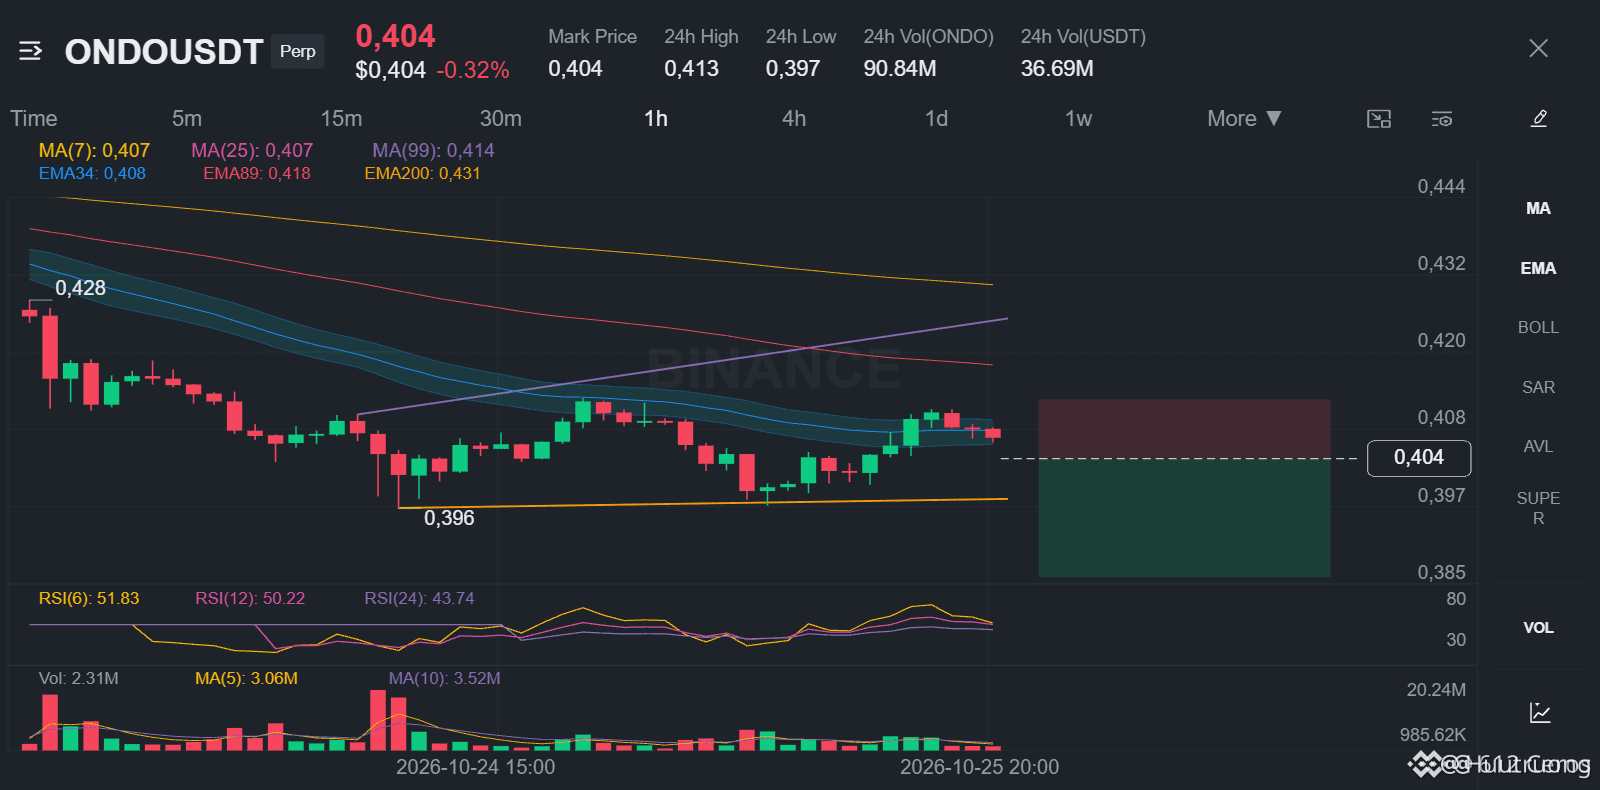
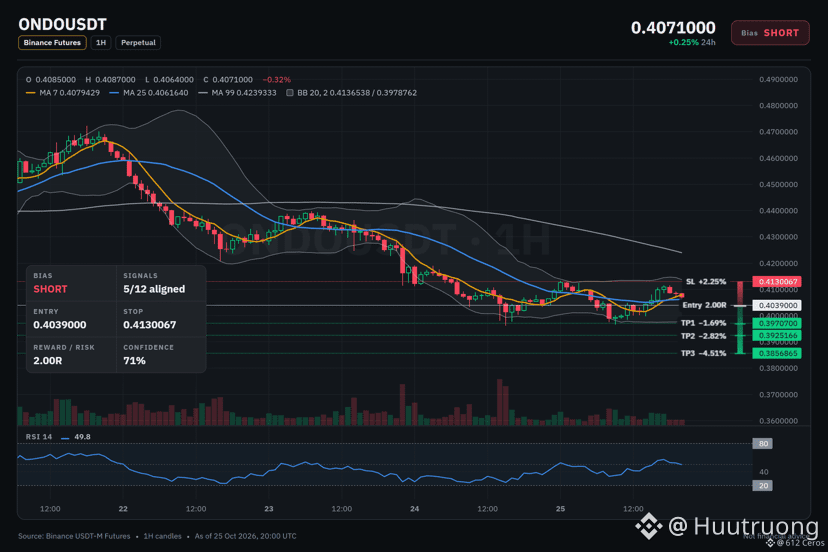
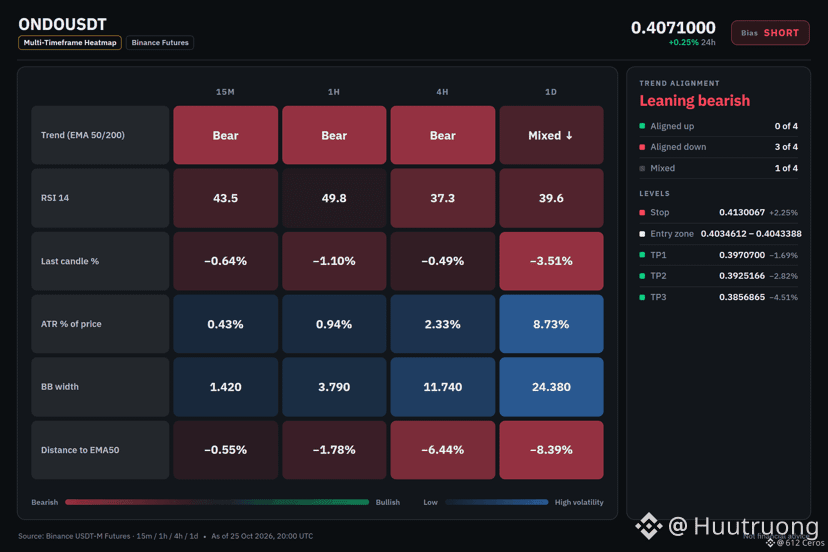
ONDO 4h bearish stack and sellers in control.
🔴 SHORT $ONDO /USDT: expecting price to go DOWN
Bias: SHORT · Leaning
Entry: 0.4034612 – 0.4043388
TP1: 0.3970700 (-1.7%)
TP2: 0.3925166 (-2.8%)
TP3: 0.3856865 (-4.5%)
SL: 0.4130067 (+2.3%)
Plan: enter only inside the zone, close 50% at TP1, 25% at TP2, 25% at TP3, and move the stop to entry after TP1.
Note: moderate conviction only, keep size light.
Why SHORT? 5/12 signals agree, 0 against.
• 4h trend down (below EMA50 & EMA200)
• 1h trend down (below EMA50 & EMA200)
• Sellers are driving the move (15m ADX 20.5)
Plan A:
If the setup works, 1h price continues below the EMA50 and EMA200, targeting the 1h entry low of 0.4034612.
Plan B (invalidation):
A daily close above 0.4130067 would break the short invalidation and I would exit.
Where would you place your stop on this trade?
{spot}(ONDOUSDT)
ONDO 4h bearish stack and sellers in control.
🔴 SHORT $ONDO /USDT: expecting price to go DOWN
Bias: SHORT · Leaning
Entry: 0.4034612 – 0.4043388
TP1: 0.3970700 (-1.7%)
TP2: 0.3925166 (-2.8%)
TP3: 0.3856865 (-4.5%)
SL: 0.4130067 (+2.3%)
Plan: enter only inside the zone, close 50% at TP1, 25% at TP2, 25% at TP3, and move the stop to entry after TP1.
Note: moderate conviction only, keep size light.
Why SHORT? 5/12 signals agree, 0 against.
• 4h trend down (below EMA50 & EMA200)
• 1h trend down (below EMA50 & EMA200)
• Sellers are driving the move (15m ADX 20.5)
Plan A:
If the setup works, 1h price continues below the EMA50 and EMA200, targeting the 1h entry low of 0.4034612.
Plan B (invalidation):
A daily close above 0.4130067 would break the short invalidation and I would exit.
Where would you place your stop on this trade?
26
·
--
Bearish
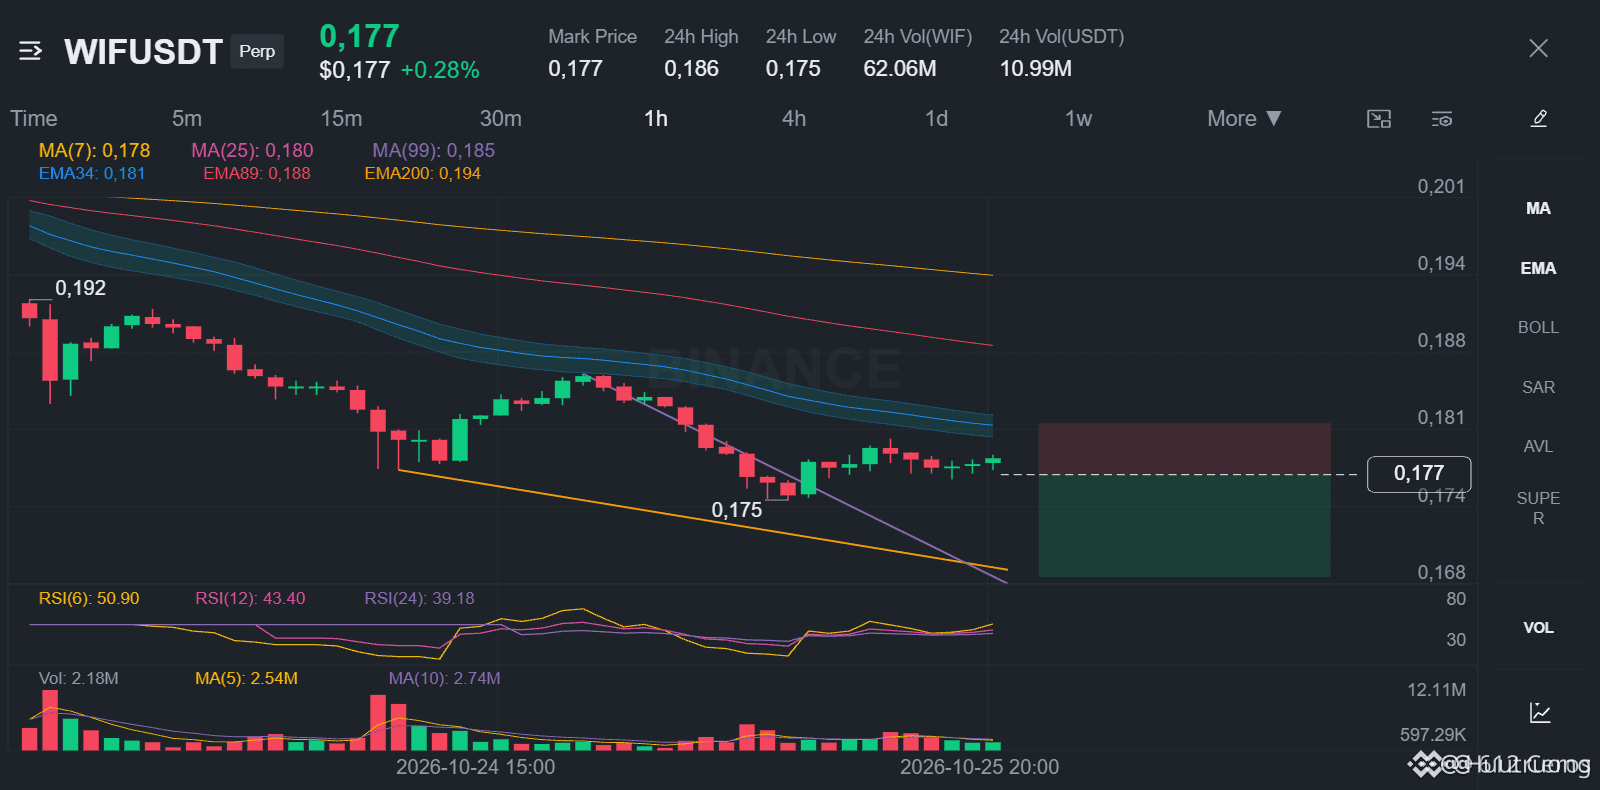
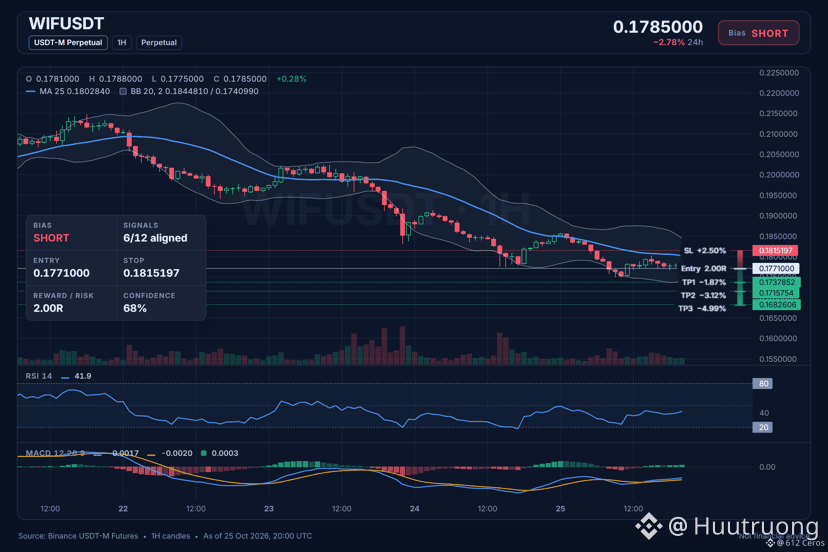
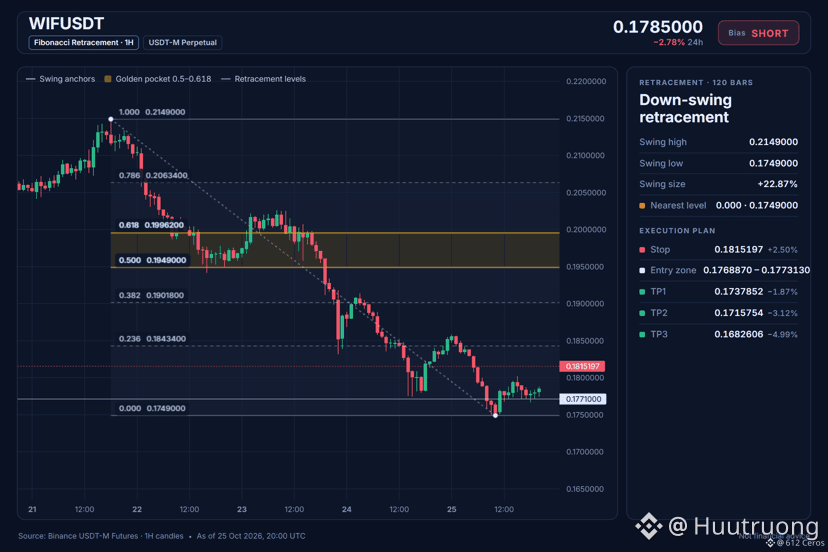
WIF short setup: bearish stack on the 4h trend.
🔴 SHORT $WIF /USDT: expecting price to go DOWN
Bias: SHORT · Strong
Entry: 0.1768870 – 0.1773130
TP1: 0.1737852 (-1.9%)
TP2: 0.1715754 (-3.1%)
TP3: 0.1682606 (-5.0%)
SL: 0.1815197 (+2.5%)
Plan: enter only inside the zone, close 50% at TP1, 25% at TP2, 25% at TP3, and move the stop to entry after TP1.
Why SHORT? What I checked: 6/12 agree, 1 against.
• 4h trend down (below EMA50 & EMA200)
• 1h trend down (below EMA50 & EMA200)
• BTC is falling, this coin follows (corr 0.77)
Watch: Far below its average, bounce likely (−3.6 ATR from 1h EMA50)
Watch: The idea is wrong if price reaches the stop at 0.1815197
Verdict: The 4h trend is bearish with price below both moving averages, but the 1h price is overextended and may bounce.
What is your WIF level or take?
{spot}(WIFUSDT)
WIF short setup: bearish stack on the 4h trend.
🔴 SHORT $WIF /USDT: expecting price to go DOWN
Bias: SHORT · Strong
Entry: 0.1768870 – 0.1773130
TP1: 0.1737852 (-1.9%)
TP2: 0.1715754 (-3.1%)
TP3: 0.1682606 (-5.0%)
SL: 0.1815197 (+2.5%)
Plan: enter only inside the zone, close 50% at TP1, 25% at TP2, 25% at TP3, and move the stop to entry after TP1.
Why SHORT? What I checked: 6/12 agree, 1 against.
• 4h trend down (below EMA50 & EMA200)
• 1h trend down (below EMA50 & EMA200)
• BTC is falling, this coin follows (corr 0.77)
Watch: Far below its average, bounce likely (−3.6 ATR from 1h EMA50)
Watch: The idea is wrong if price reaches the stop at 0.1815197
Verdict: The 4h trend is bearish with price below both moving averages, but the 1h price is overextended and may bounce.
What is your WIF level or take?
2
19
·
--
Bearish
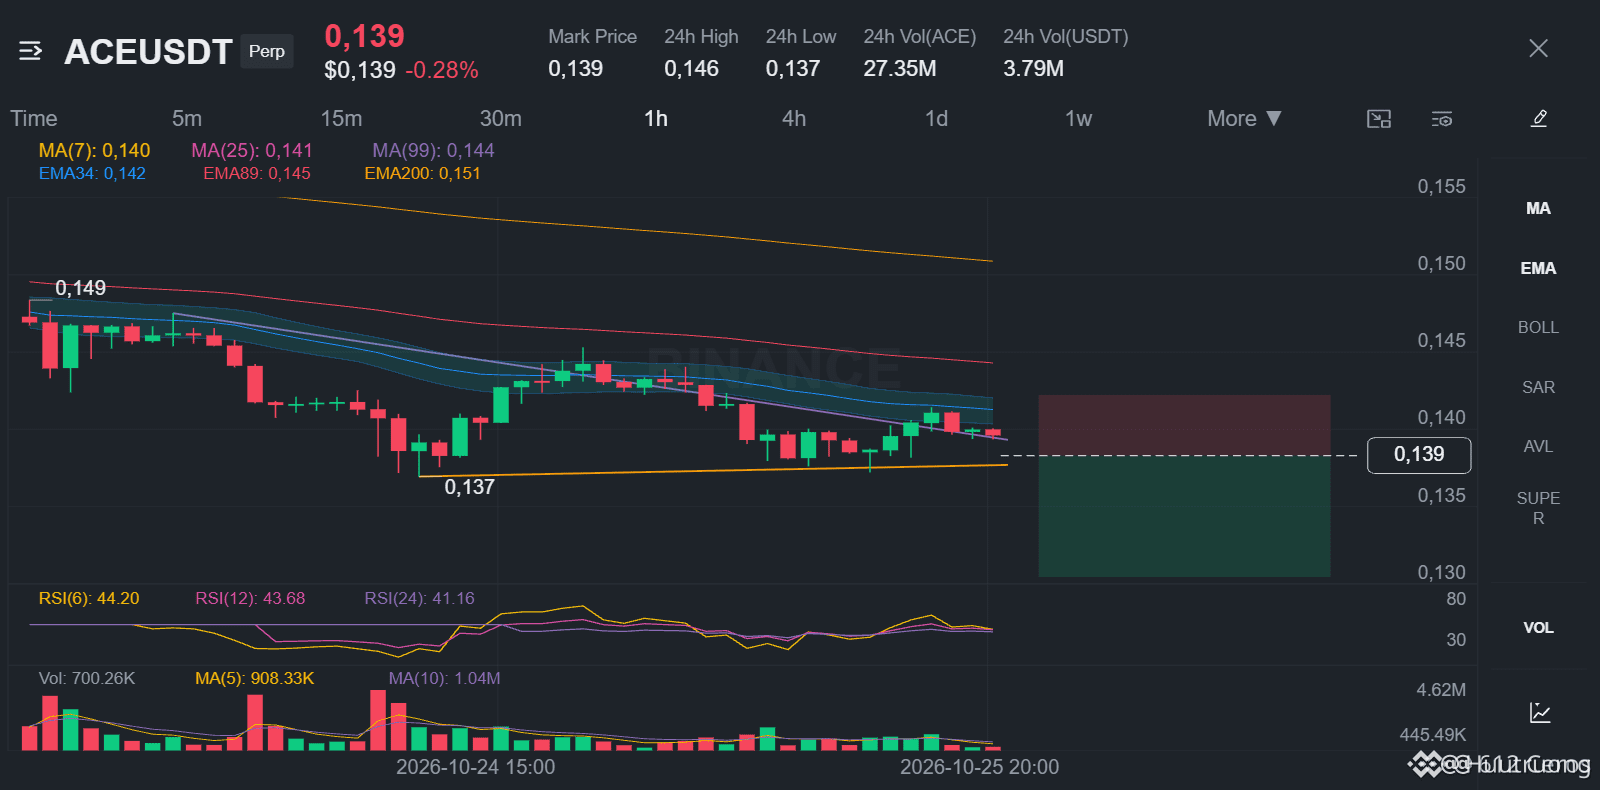
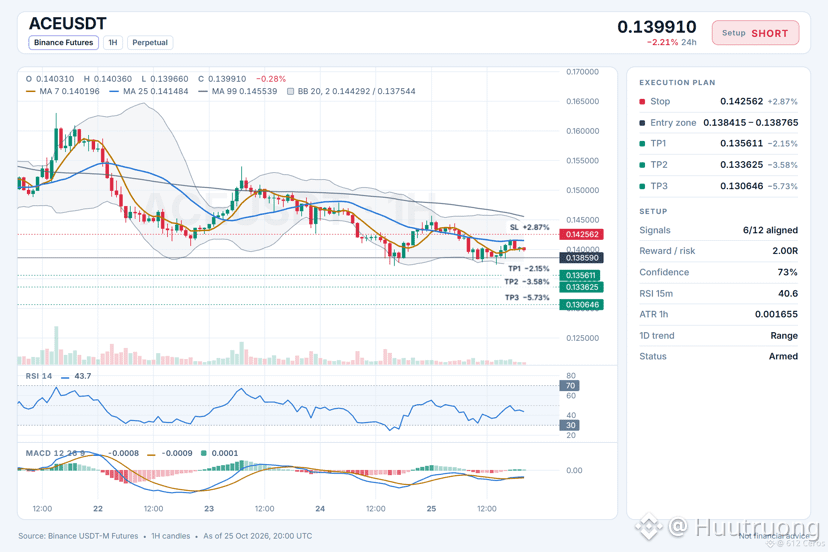
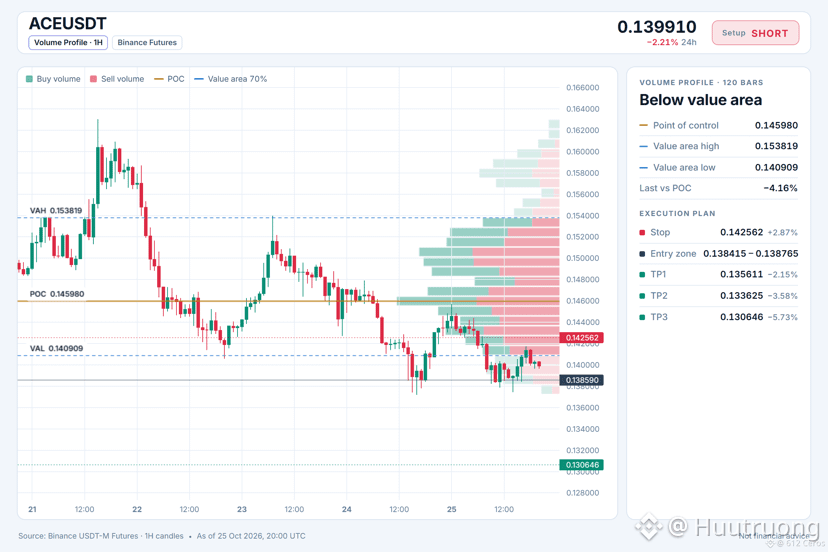
Is ACE ready to extend its slide?
🔴 SHORT $ACE /USDT: expecting price to go DOWN
Bias: SHORT · Strong
Entry: 0.138415 – 0.138765
TP1: 0.135611 (-2.1%)
TP2: 0.133625 (-3.6%)
TP3: 0.130646 (-5.7%)
SL: 0.142562 (+2.9%)
Plan: enter only inside the zone, close 50% at TP1, 25% at TP2, 25% at TP3, and move the stop to entry after TP1.
Why SHORT? 6/12 signals agree, 0 against.
• 4h trend down (below EMA50 & EMA200)
• 1h trend down (below EMA50 & EMA200)
• BTC is falling, this coin follows (corr 0.77)
Why now?
ACE is already below both the 1h and 4h EMAs, and the 4h stack is bearish, which means sellers control the short-term and swing trend. BTC is also falling with a 0.77 correlation, so ACE tends to follow. The 1h RSI sits at 43.7, below 45, confirming sellers still hold momentum.
Where would you place your invalidation level?
{spot}(ACEUSDT)
Is ACE ready to extend its slide?
🔴 SHORT $ACE /USDT: expecting price to go DOWN
Bias: SHORT · Strong
Entry: 0.138415 – 0.138765
TP1: 0.135611 (-2.1%)
TP2: 0.133625 (-3.6%)
TP3: 0.130646 (-5.7%)
SL: 0.142562 (+2.9%)
Plan: enter only inside the zone, close 50% at TP1, 25% at TP2, 25% at TP3, and move the stop to entry after TP1.
Why SHORT? 6/12 signals agree, 0 against.
• 4h trend down (below EMA50 & EMA200)
• 1h trend down (below EMA50 & EMA200)
• BTC is falling, this coin follows (corr 0.77)
Why now?
ACE is already below both the 1h and 4h EMAs, and the 4h stack is bearish, which means sellers control the short-term and swing trend. BTC is also falling with a 0.77 correlation, so ACE tends to follow. The 1h RSI sits at 43.7, below 45, confirming sellers still hold momentum.
Where would you place your invalidation level?
13
Log in to explore more content
Join global crypto users on Binance Square
⚡️ Get latest and useful information about crypto.
💬 Trusted by the world’s largest crypto exchange.
👍 Discover real insights from verified creators.
Email / Phone number
Trending Topics
BinancePick
2.5M views
136,927 Discussing
Join #EarningsSeason: Predict Earnings on Binance Pick, Share Your Take on Binance Square!
Binance Square Official
·399 Likes
·336.7k views
EarningsSeason
4.9M views
23,784 Discussing
ElectrumWalletBugLetRogueServersStealFunds
1,035 views
95 Discussing