
Moonacci
747 Posts

Moonacci
Report
Block User
Professional SMC Trader | Precision-based liquidity & structure analysis. Focused on high-probability setups and disciplined execution.
X @Syedalirazase
249 Following
6.2K+ Followers
1.3K+ Liked
Posts
All
Quotes
Videos
Live
PINNED
·
--
Article
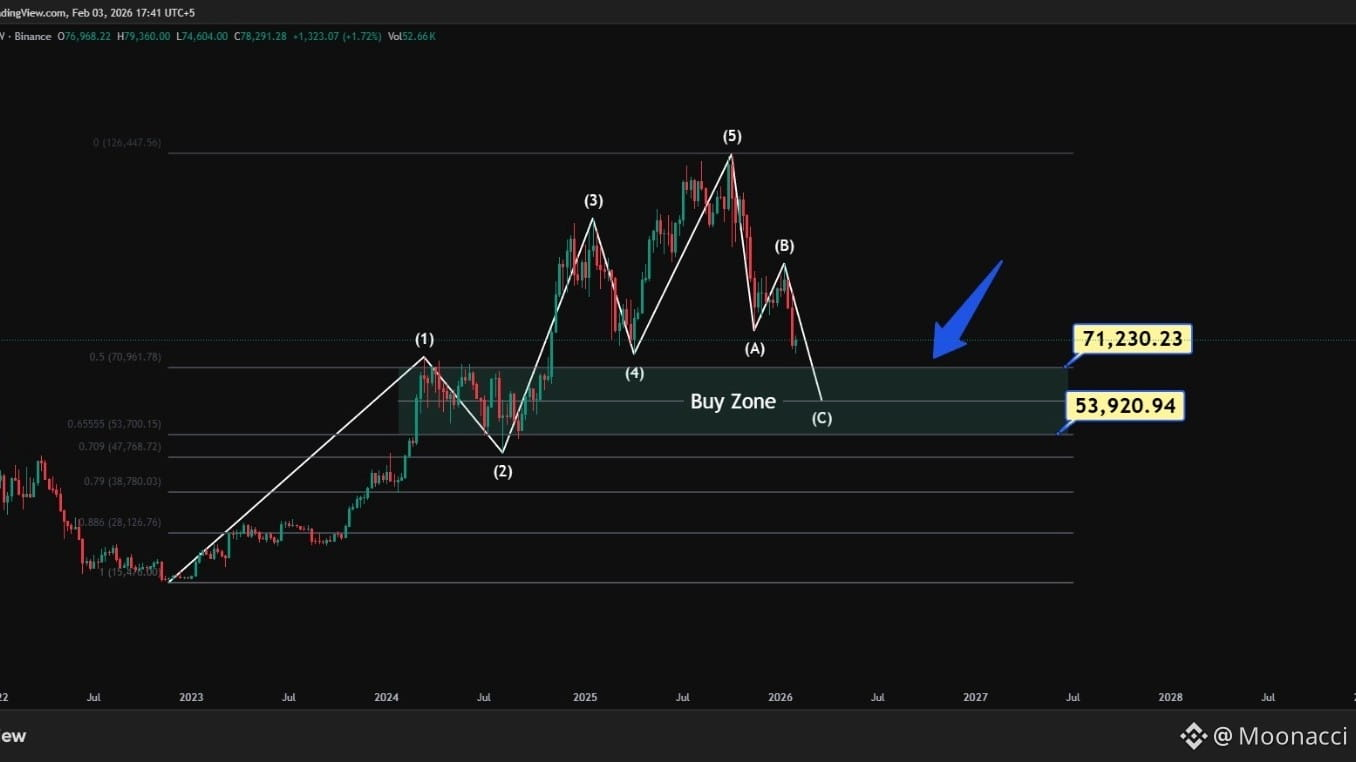
BTCUSDT | Rare Spot Accumulation Opportunity | Long-Term Elliott Wave OutlookAfter nearly three years, Bitcoin is approaching the completion of its major Elliott Wave cycle.
Historically, once a full impulsive Elliott Wave structure is completed, the market transitions into a corrective phase, which often creates rare, high-probability accumulation opportunities.
This is not a typical dip.
Such opportunities are short-lived and extremely rare, usually appearing once every five years.
🔍 Elliott Wave Structure
The impulsive Elliott Wave cycle is complete
The market has entered the A–B–C corrective phase
Waves A and B have already formed
The market is now developing the final C wave
📐 Elliott Wave + Fibonacci + Trend-Based Retracement
Using Elliott Wave Theory, Fibonacci retracement, and trend-based retracement, price action suggests that Bitcoin is moving toward a high-confluence accumulation zone.
This same analysis framework also provides a long-term trend projection once the corrective phase is complete.
🟢 Spot Accumulation Zone
71,000 – 53,000 USDT
If BTC enters this zone:
Begin spot accumulation
Follow DCA (dollar-cost averaging)
This opportunity should not be ignored
This zone is designed for long-term investors, not short-term traders.
🚀 Long-Term Trend Projection
According to Elliott Wave expansion and trend-based Fibonacci extensions, once the corrective structure is completed and a new impulsive cycle begins, Bitcoin has the potential to expand toward the 200,000 – 240,000 USDT range over the long term.
This projection is trend-based, not time-based, and depends on market structure continuation.
⚠️ Risk Management
Avoid futures trading — futures involve extremely high risk
Spot buying only
No leverage; patience and discipline are essential
📚 Disclaimer
This post is for educational purposes only.
I am not providing financial advice, as I do not know your financial circumstances.
Always do your own research (DYOR).
Markets reward patience, structure, and discipline — not emotion.
Please Do Trade Here. 👇$BTC
BTCUSDT | Rare Spot Accumulation Opportunity | Long-Term Elliott Wave Outlook
After nearly three years, Bitcoin is approaching the completion of its major Elliott Wave cycle.
Historically, once a full impulsive Elliott Wave structure is completed, the market transitions into a corrective phase, which often creates rare, high-probability accumulation opportunities.
This is not a typical dip.
Such opportunities are short-lived and extremely rare, usually appearing once every five years.
🔍 Elliott Wave Structure
The impulsive Elliott Wave cycle is complete
The market has entered the A–B–C corrective phase
Waves A and B have already formed
The market is now developing the final C wave
📐 Elliott Wave + Fibonacci + Trend-Based Retracement
Using Elliott Wave Theory, Fibonacci retracement, and trend-based retracement, price action suggests that Bitcoin is moving toward a high-confluence accumulation zone.
This same analysis framework also provides a long-term trend projection once the corrective phase is complete.
🟢 Spot Accumulation Zone
71,000 – 53,000 USDT
If BTC enters this zone:
Begin spot accumulation
Follow DCA (dollar-cost averaging)
This opportunity should not be ignored
This zone is designed for long-term investors, not short-term traders.
🚀 Long-Term Trend Projection
According to Elliott Wave expansion and trend-based Fibonacci extensions, once the corrective structure is completed and a new impulsive cycle begins, Bitcoin has the potential to expand toward the 200,000 – 240,000 USDT range over the long term.
This projection is trend-based, not time-based, and depends on market structure continuation.
⚠️ Risk Management
Avoid futures trading — futures involve extremely high risk
Spot buying only
No leverage; patience and discipline are essential
📚 Disclaimer
This post is for educational purposes only.
I am not providing financial advice, as I do not know your financial circumstances.
Always do your own research (DYOR).
Markets reward patience, structure, and discipline — not emotion.
Please Do Trade Here. 👇$BTC
Historically, once a full impulsive Elliott Wave structure is completed, the market transitions into a corrective phase, which often creates rare, high-probability accumulation opportunities.
This is not a typical dip.
Such opportunities are short-lived and extremely rare, usually appearing once every five years.
🔍 Elliott Wave Structure
The impulsive Elliott Wave cycle is complete
The market has entered the A–B–C corrective phase
Waves A and B have already formed
The market is now developing the final C wave
📐 Elliott Wave + Fibonacci + Trend-Based Retracement
Using Elliott Wave Theory, Fibonacci retracement, and trend-based retracement, price action suggests that Bitcoin is moving toward a high-confluence accumulation zone.
This same analysis framework also provides a long-term trend projection once the corrective phase is complete.
🟢 Spot Accumulation Zone
71,000 – 53,000 USDT
If BTC enters this zone:
Begin spot accumulation
Follow DCA (dollar-cost averaging)
This opportunity should not be ignored
This zone is designed for long-term investors, not short-term traders.
🚀 Long-Term Trend Projection
According to Elliott Wave expansion and trend-based Fibonacci extensions, once the corrective structure is completed and a new impulsive cycle begins, Bitcoin has the potential to expand toward the 200,000 – 240,000 USDT range over the long term.
This projection is trend-based, not time-based, and depends on market structure continuation.
⚠️ Risk Management
Avoid futures trading — futures involve extremely high risk
Spot buying only
No leverage; patience and discipline are essential
📚 Disclaimer
This post is for educational purposes only.
I am not providing financial advice, as I do not know your financial circumstances.
Always do your own research (DYOR).
Markets reward patience, structure, and discipline — not emotion.
Please Do Trade Here. 👇$BTC
557
285
68
557
·
--
The Wick Was the Whole Trade #shorts #ict #rejectionblock
$BTC $GOLD.US
The Wick Was the Whole Trade #shorts #ict #rejectionblock
$BTC $GOLD.US
$BTC $GOLD.US
1
4
262
·
--
Two Weekly Zones, One Winner: The 3 Checks Behind Every Swing Trade.
$BTC
Two Weekly Zones, One Winner: The 3 Checks Behind Every Swing Trade.
$BTC
$BTC
2
95
·
--
The candle after the sweep changed the whole day. Real gold, Tuesday 1 September 2026, an hour into London: price broke Monday's low and the candle closed back above it, which on its own looks like a sweep. But the next candle closed below, and price never closed above that low again. That's acceptance, not a visit: a run. So the trade flips: entry in the middle of the fair value gap the run left, stop above the last up candle.
The candle after the sweep changed the whole day. Real gold, Tuesday 1 September 2026, an hour into London: price broke Monday's low and the candle closed back above it, which on its own looks like a sweep. But the next candle closed below, and price never closed above that low again. That's acceptance, not a visit: a run. So the trade flips: entry in the middle of the fair value gap the run left, stop above the last up candle.
4
478
·
--
Two equal lows look like support, but that's where buyers hide their stops: it's a pool, not a floor. Real gold example, Monday 24 August 2026, London morning. The second bottom closed green, the buy went in with the stop just under the lows, price lifted for a moment, then cut through both lows and took the stop. Rewind: one candle closed below the lows, the next closed right back above, and strong candles left a fair value gap. Entry in its middle, stop under the new low (not the old bottoms), target the high between the two bottoms: about three times the risk. SWEEP OR RUN 2/3.
Two equal lows look like support, but that's where buyers hide their stops: it's a pool, not a floor. Real gold example, Monday 24 August 2026, London morning. The second bottom closed green, the buy went in with the stop just under the lows, price lifted for a moment, then cut through both lows and took the stop. Rewind: one candle closed below the lows, the next closed right back above, and strong candles left a fair value gap. Entry in its middle, stop under the new low (not the old bottoms), target the high between the two bottoms: about three times the risk. SWEEP OR RUN 2/3.
3
239
·
--
Before you short a high, three things have to happen in order: the high gets taken, a candle closes below the last low, and that fall opens a fair value gap. Real gold example: Thursday 10 September 2026, London open. Price ran above the previous day's high, took the buy stops and closed back below it. Two candles later one closed below the last low (a close, not a wick). Entry in the middle of the gap, stop over the sweep high, target the Asian low: about three times the risk. No sweep first, or only a wick through the low? Skip it. SWEEP OR RUN 1/3.
Before you short a high, three things have to happen in order: the high gets taken, a candle closes below the last low, and that fall opens a fair value gap. Real gold example: Thursday 10 September 2026, London open. Price ran above the previous day's high, took the buy stops and closed back below it. Two candles later one closed below the last low (a close, not a wick). Entry in the middle of the gap, stop over the sweep high, target the Asian low: about three times the risk. No sweep first, or only a wick through the low? Skip it. SWEEP OR RUN 1/3.
3
244
·
--
Most fair value gaps on your chart are supposed to fail. In this video you'll learn the four checks a gap must pass before you trade it, where to enter (the middle of the gap, consequent encroachment), where your stop really belongs, and the one candle close that tells you a gap is dead. Four worked trades (New York long, London short, a patience trade, the clean version) and the two mistakes that turn good-looking gaps into losses.
Most fair value gaps on your chart are supposed to fail. In this video you'll learn the four checks a gap must pass before you trade it, where to enter (the middle of the gap, consequent encroachment), where your stop really belongs, and the one candle close that tells you a gap is dead. Four worked trades (New York long, London short, a patience trade, the clean version) and the two mistakes that turn good-looking gaps into losses.
2
179
·
--
Which Candle Is the Real Order Block Most Traders Pick Wrong
Which Candle Is the Real Order Block Most Traders Pick Wrong
3
151
·
--
The Truth About ICT Order Blocks (And Why You Lose)
Most order blocks you draw were never order blocks. In this video you'll learn what an ICT order block really is, the three filters that separate the ones that hold from the ones that break, the exact entry level (the mean threshold), where your stop really belongs, and the one sign that tells you an order block is dead.
Disclaimer: Educational content only. Not financial advice. Trading involves substantial risk of loss. Past examples do not guarantee future results.
The Truth About ICT Order Blocks (And Why You Lose)
Most order blocks you draw were never order blocks. In this video you'll learn what an ICT order block really is, the three filters that separate the ones that hold from the ones that break, the exact entry level (the mean threshold), where your stop really belongs, and the one sign that tells you an order block is dead.
Disclaimer: Educational content only. Not financial advice. Trading involves substantial risk of loss. Past examples do not guarantee future results.
Most order blocks you draw were never order blocks. In this video you'll learn what an ICT order block really is, the three filters that separate the ones that hold from the ones that break, the exact entry level (the mean threshold), where your stop really belongs, and the one sign that tells you an order block is dead.
Disclaimer: Educational content only. Not financial advice. Trading involves substantial risk of loss. Past examples do not guarantee future results.
1
1
6
166



·
--
Bullish
$XAU
{future}(XAUUSDT)
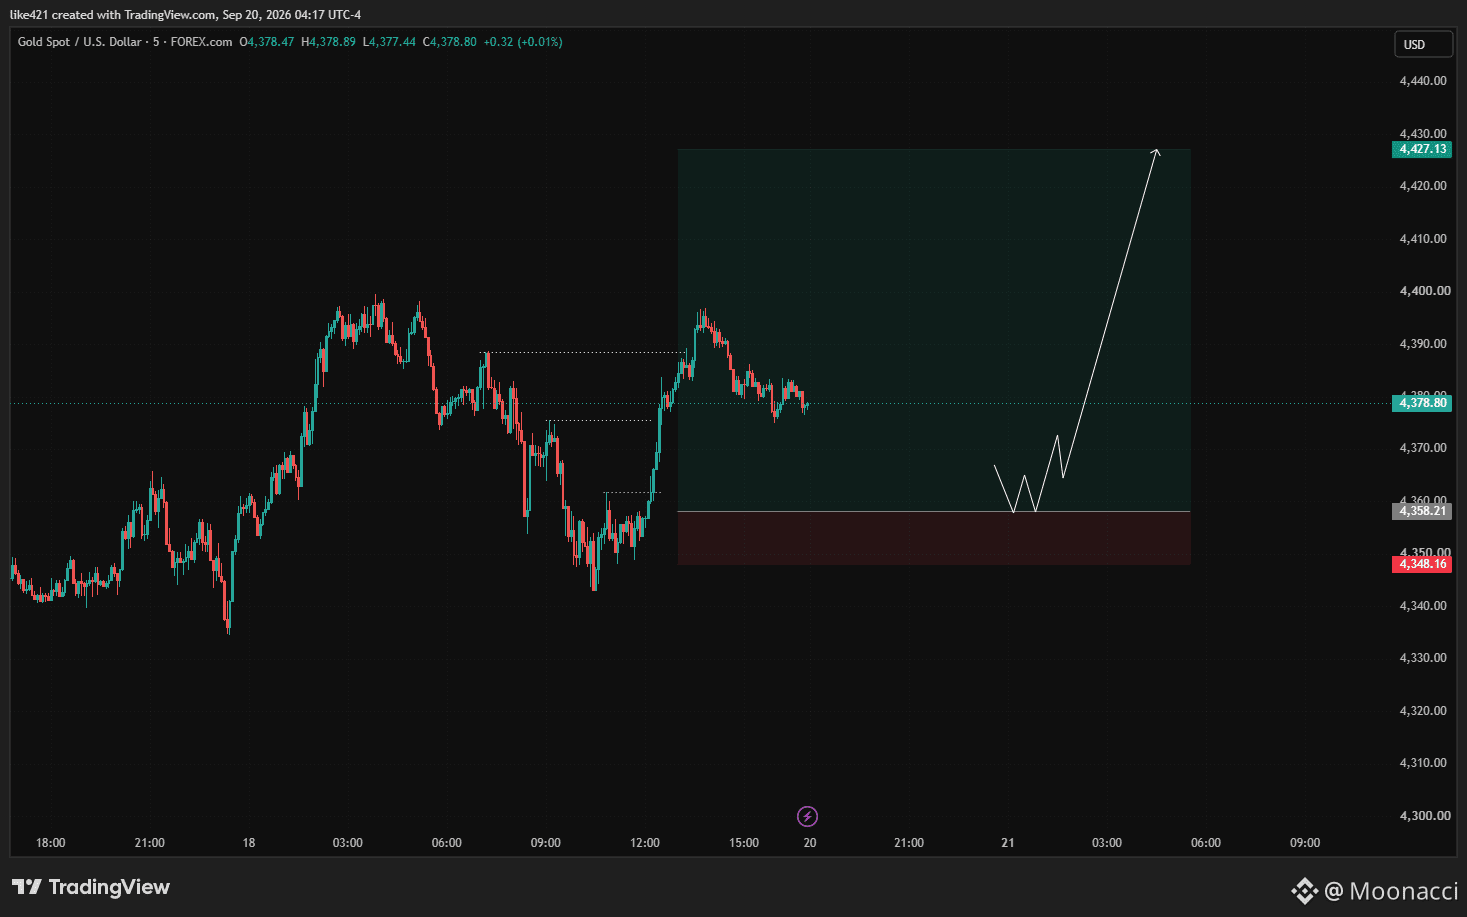
LONG 🟢
Entry: 4,358–4,362
SL: 4,348
TP1: 4,390
TP2: 4,400
TP3: 4,427
Setup: Bullish RTO / demand retest.
$XAU
LONG 🟢
Entry: 4,358–4,362
SL: 4,348
TP1: 4,390
TP2: 4,400
TP3: 4,427
Setup: Bullish RTO / demand retest.
LONG 🟢
Entry: 4,358–4,362
SL: 4,348
TP1: 4,390
TP2: 4,400
TP3: 4,427
Setup: Bullish RTO / demand retest.
1
156
·
--
Bearish
$KAT
{future}(KATUSDT)
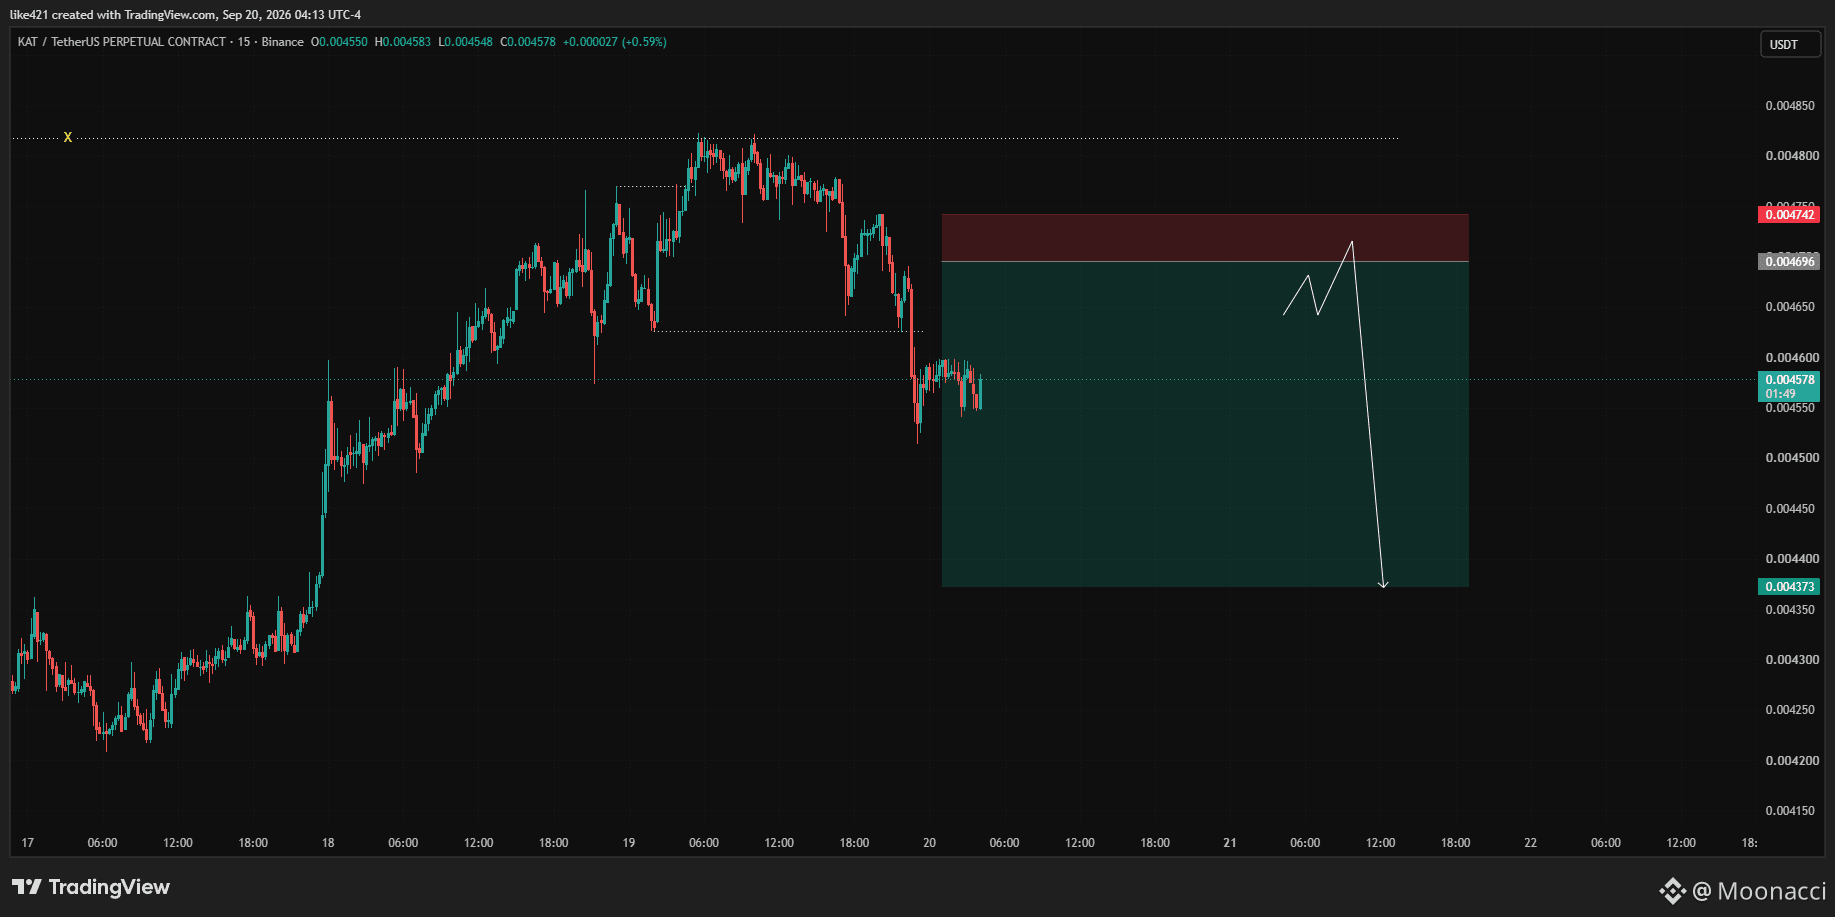
USDT — SHORT 🔴
Entry: 0.004690 – 0.004710
SL: 0.004742
TP1: 0.004575
TP2: 0.004450
TP3: 0.004373
Setup: Bearish SH + BMS + RTO
Invalidation: 15m close above 0.004742.
$KAT
USDT — SHORT 🔴
Entry: 0.004690 – 0.004710
SL: 0.004742
TP1: 0.004575
TP2: 0.004450
TP3: 0.004373
Setup: Bearish SH + BMS + RTO
Invalidation: 15m close above 0.004742.
USDT — SHORT 🔴
Entry: 0.004690 – 0.004710
SL: 0.004742
TP1: 0.004575
TP2: 0.004450
TP3: 0.004373
Setup: Bearish SH + BMS + RTO
Invalidation: 15m close above 0.004742.
1
297
·
--
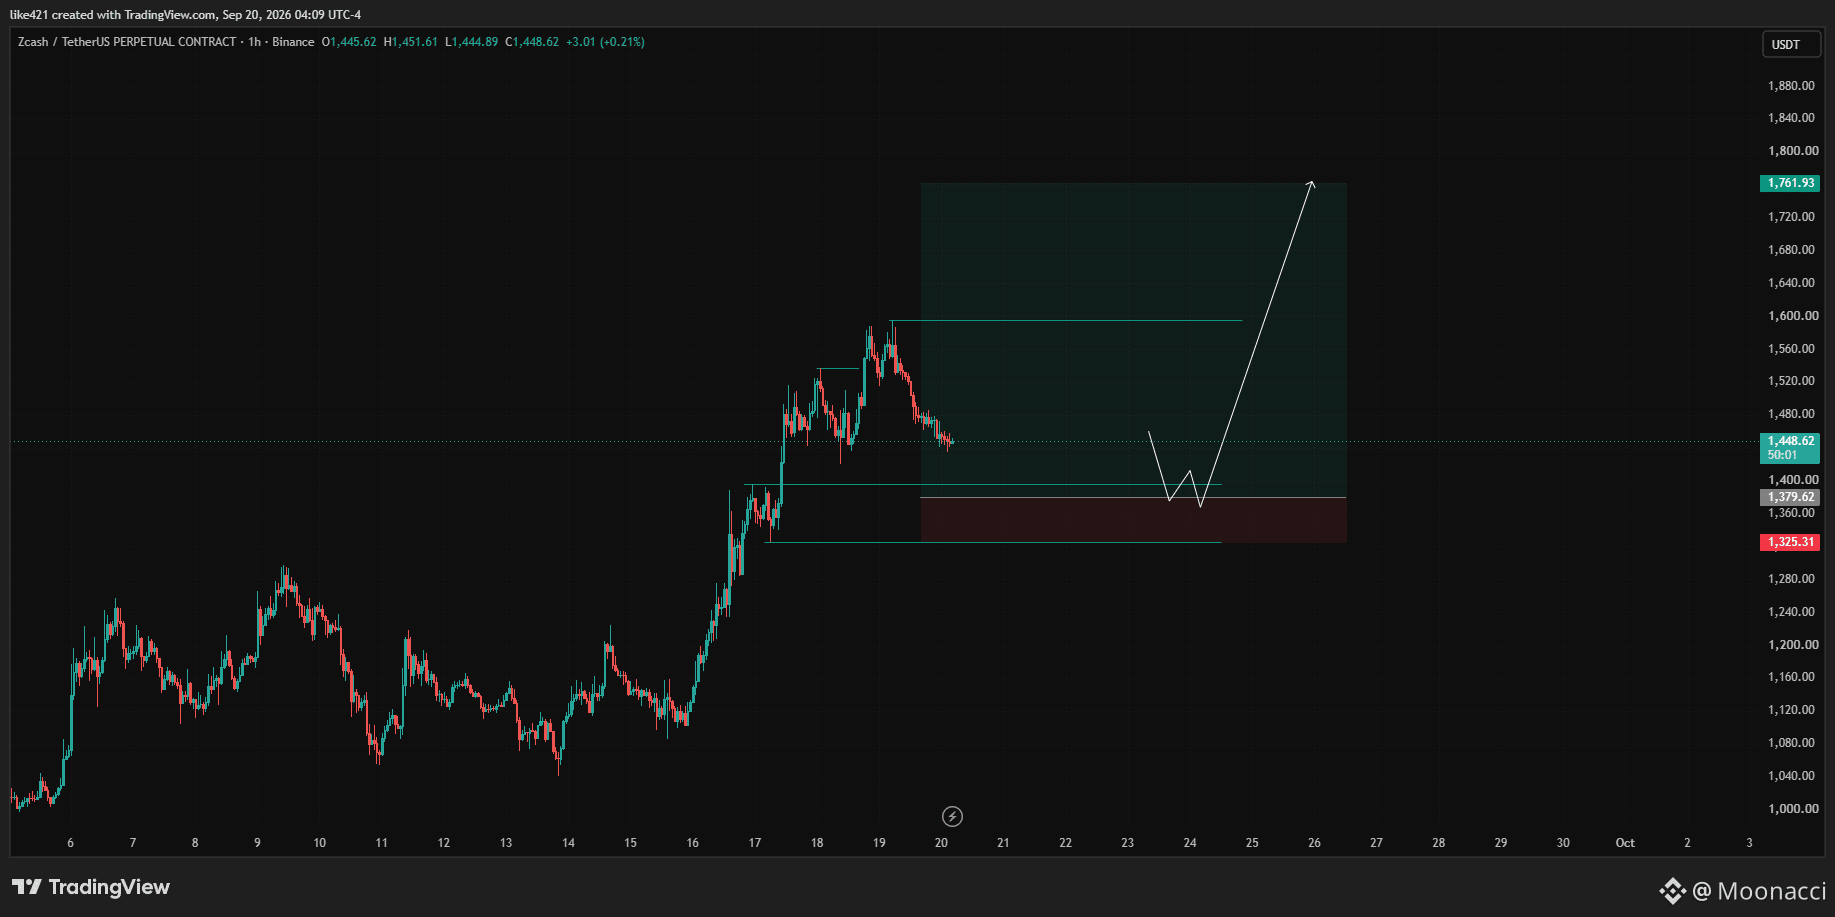
Bullish
$ZEC
{future}(ZECUSDT)
USDT — LONG 🟢
Entry: 1,380–1,400
SL: 1,325
TP1: 1,530
TP2: 1,595
TP3: 1,760
Setup: Bullish BMS → RTO / demand retest
Invalidation: 4H close below 1,325.
$ZEC
USDT — LONG 🟢
Entry: 1,380–1,400
SL: 1,325
TP1: 1,530
TP2: 1,595
TP3: 1,760
Setup: Bullish BMS → RTO / demand retest
Invalidation: 4H close below 1,325.
USDT — LONG 🟢
Entry: 1,380–1,400
SL: 1,325
TP1: 1,530
TP2: 1,595
TP3: 1,760
Setup: Bullish BMS → RTO / demand retest
Invalidation: 4H close below 1,325.
1
204
·
--
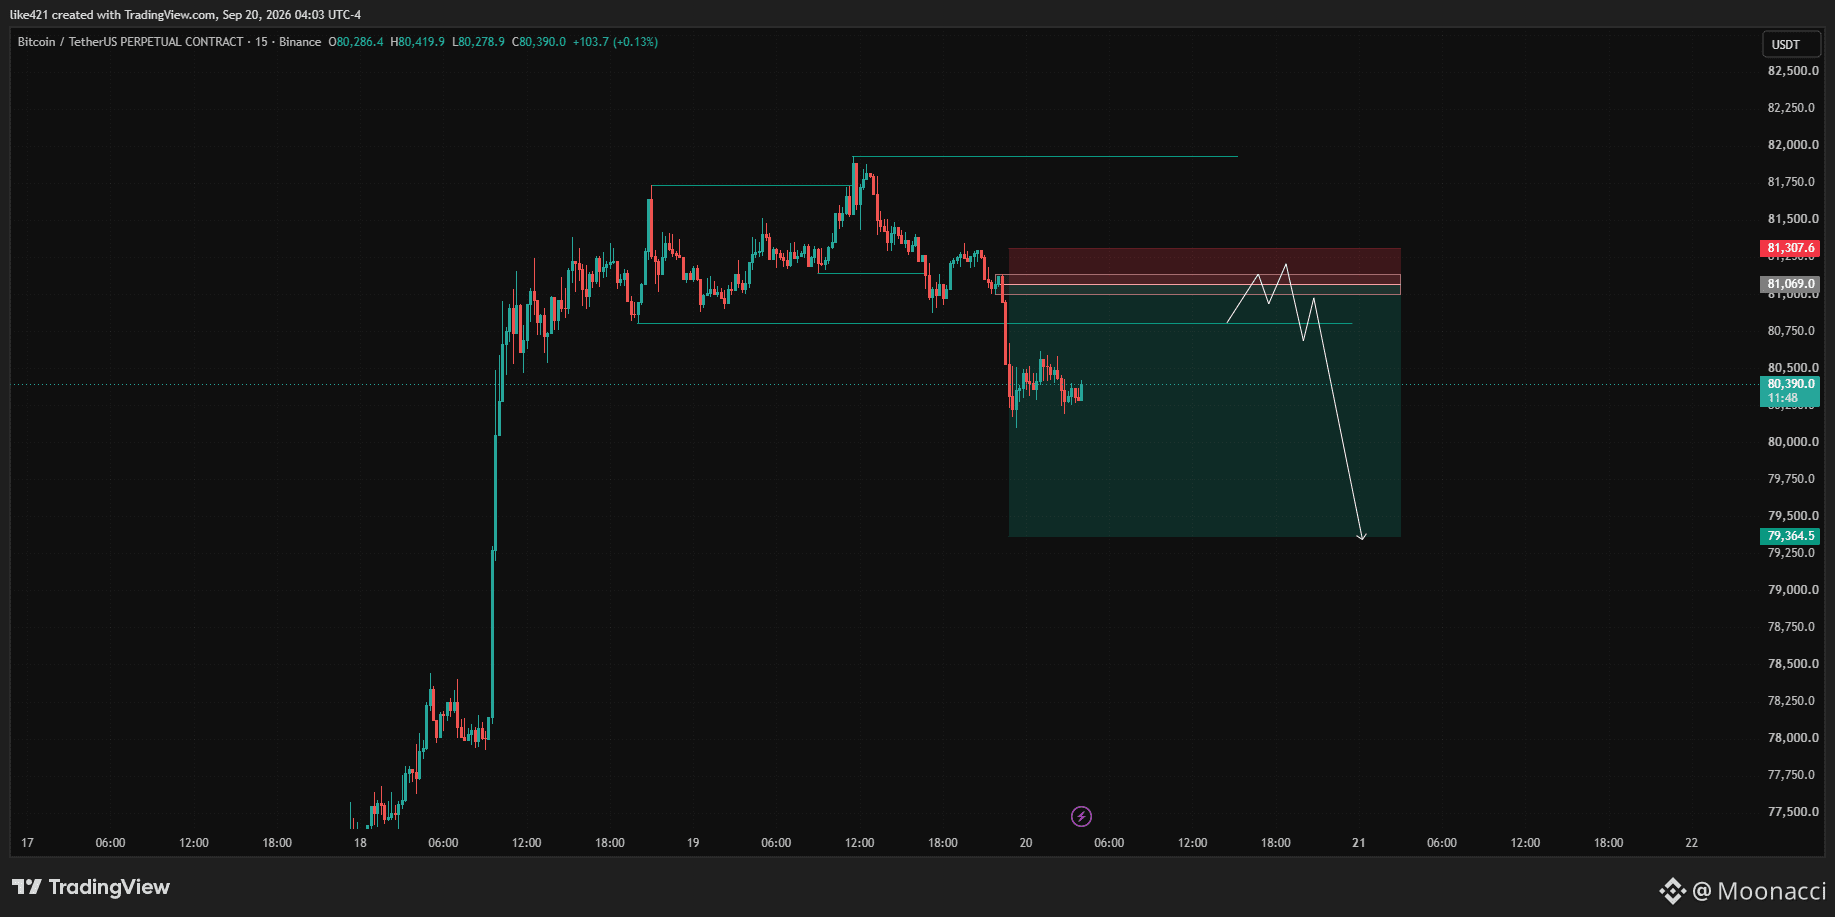
Bearish
$BTC
{future}(BTCUSDT)
SHORT
Entry: 80,950 – 81,070
SL: 81,310
TP1: 80,390
TP2: 79,800
TP3: 79,365
Setup: Bearish RTO / SH + BMS + RTO
Bias: Short on retracement into the marked supply/OB zone.
$BTC
SHORT
Entry: 80,950 – 81,070
SL: 81,310
TP1: 80,390
TP2: 79,800
TP3: 79,365
Setup: Bearish RTO / SH + BMS + RTO
Bias: Short on retracement into the marked supply/OB zone.
SHORT
Entry: 80,950 – 81,070
SL: 81,310
TP1: 80,390
TP2: 79,800
TP3: 79,365
Setup: Bearish RTO / SH + BMS + RTO
Bias: Short on retracement into the marked supply/OB zone.
69
Log in to explore more content
Join global crypto users on Binance Square
⚡️ Get latest and useful information about crypto.
💬 Trusted by the world’s largest crypto exchange.
👍 Discover real insights from verified creators.
Email / Phone number
Trending Topics
BinanceReopensWithdrawalsForMoreAssets
891,185 views
4,683 Discussing
Security Incident | Recovery Update #8: Withdrawals for More Assets to Reopen (2026-11-05)
Binance Announcement
·414 Likes
·1.9M views
Binance98PercentReplenished
211,953 views
1,925 Discussing
USStocksSlipandCryptoMarketUnderBroadPressure
20,569 views
269 Discussing