$BTC
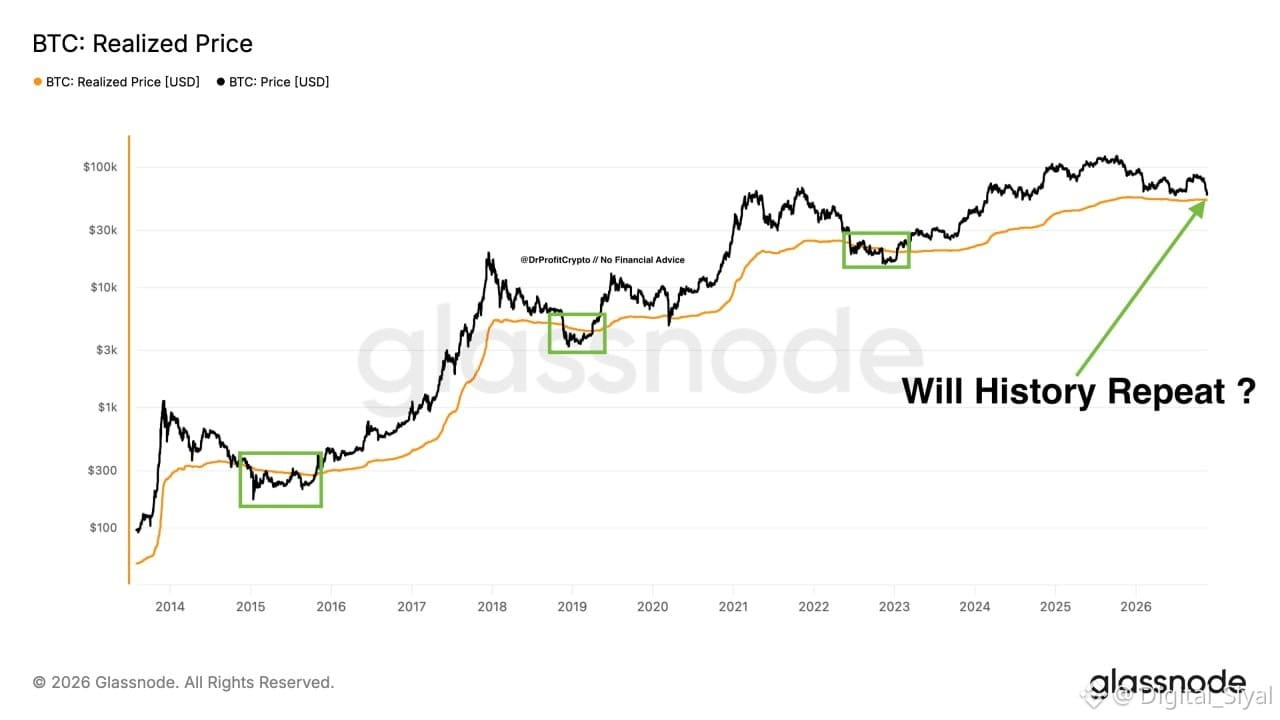
Bears have a point, but this chart is the only argument I consider as geniune and legit from the bears side. I am not saying that I consider this event as something that will happen, but I say that this is the only LEGIT argument the bears have delivered till this day for much lower prices.
If Bitcoin follows History, as it did in the last 3 bear markets, this would mean 36-37k for Bitcoin. So if a bear shares this chart, be sure, that he basically says, Bitcoin needs to drop to 36-37k if it follows history, and the reason is simple. The Long term Realized Price for BTC is currently sitting at 53k, and on average BTC went 30% lower than the long term realized price in each bear market, so this brings us to 36-37k
Personally, this is the ONLY legit argument the bears could deliver till this day, and in the end my personal opinion, I do not agree with the outcome, even if I think the analysis and idea is pretty interesting to watch
$BTC
#SolanaSets2027RoadmapToDoubleComputeCapacity #GlobalStocksFaceLongestLosingStreakSince2023 #TwentyOneCapitalAdds172.25BTC
Bears have a point, but this chart is the only argument I consider as geniune and legit from the bears side. I am not saying that I consider this event as something that will happen, but I say that this is the only LEGIT argument the bears have delivered till this day for much lower prices.
If Bitcoin follows History, as it did in the last 3 bear markets, this would mean 36-37k for Bitcoin. So if a bear shares this chart, be sure, that he basically says, Bitcoin needs to drop to 36-37k if it follows history, and the reason is simple. The Long term Realized Price for BTC is currently sitting at 53k, and on average BTC went 30% lower than the long term realized price in each bear market, so this brings us to 36-37k
Personally, this is the ONLY legit argument the bears could deliver till this day, and in the end my personal opinion, I do not agree with the outcome, even if I think the analysis and idea is pretty interesting to watch
$BTC
#SolanaSets2027RoadmapToDoubleComputeCapacity #GlobalStocksFaceLongestLosingStreakSince2023 #TwentyOneCapitalAdds172.25BTC