

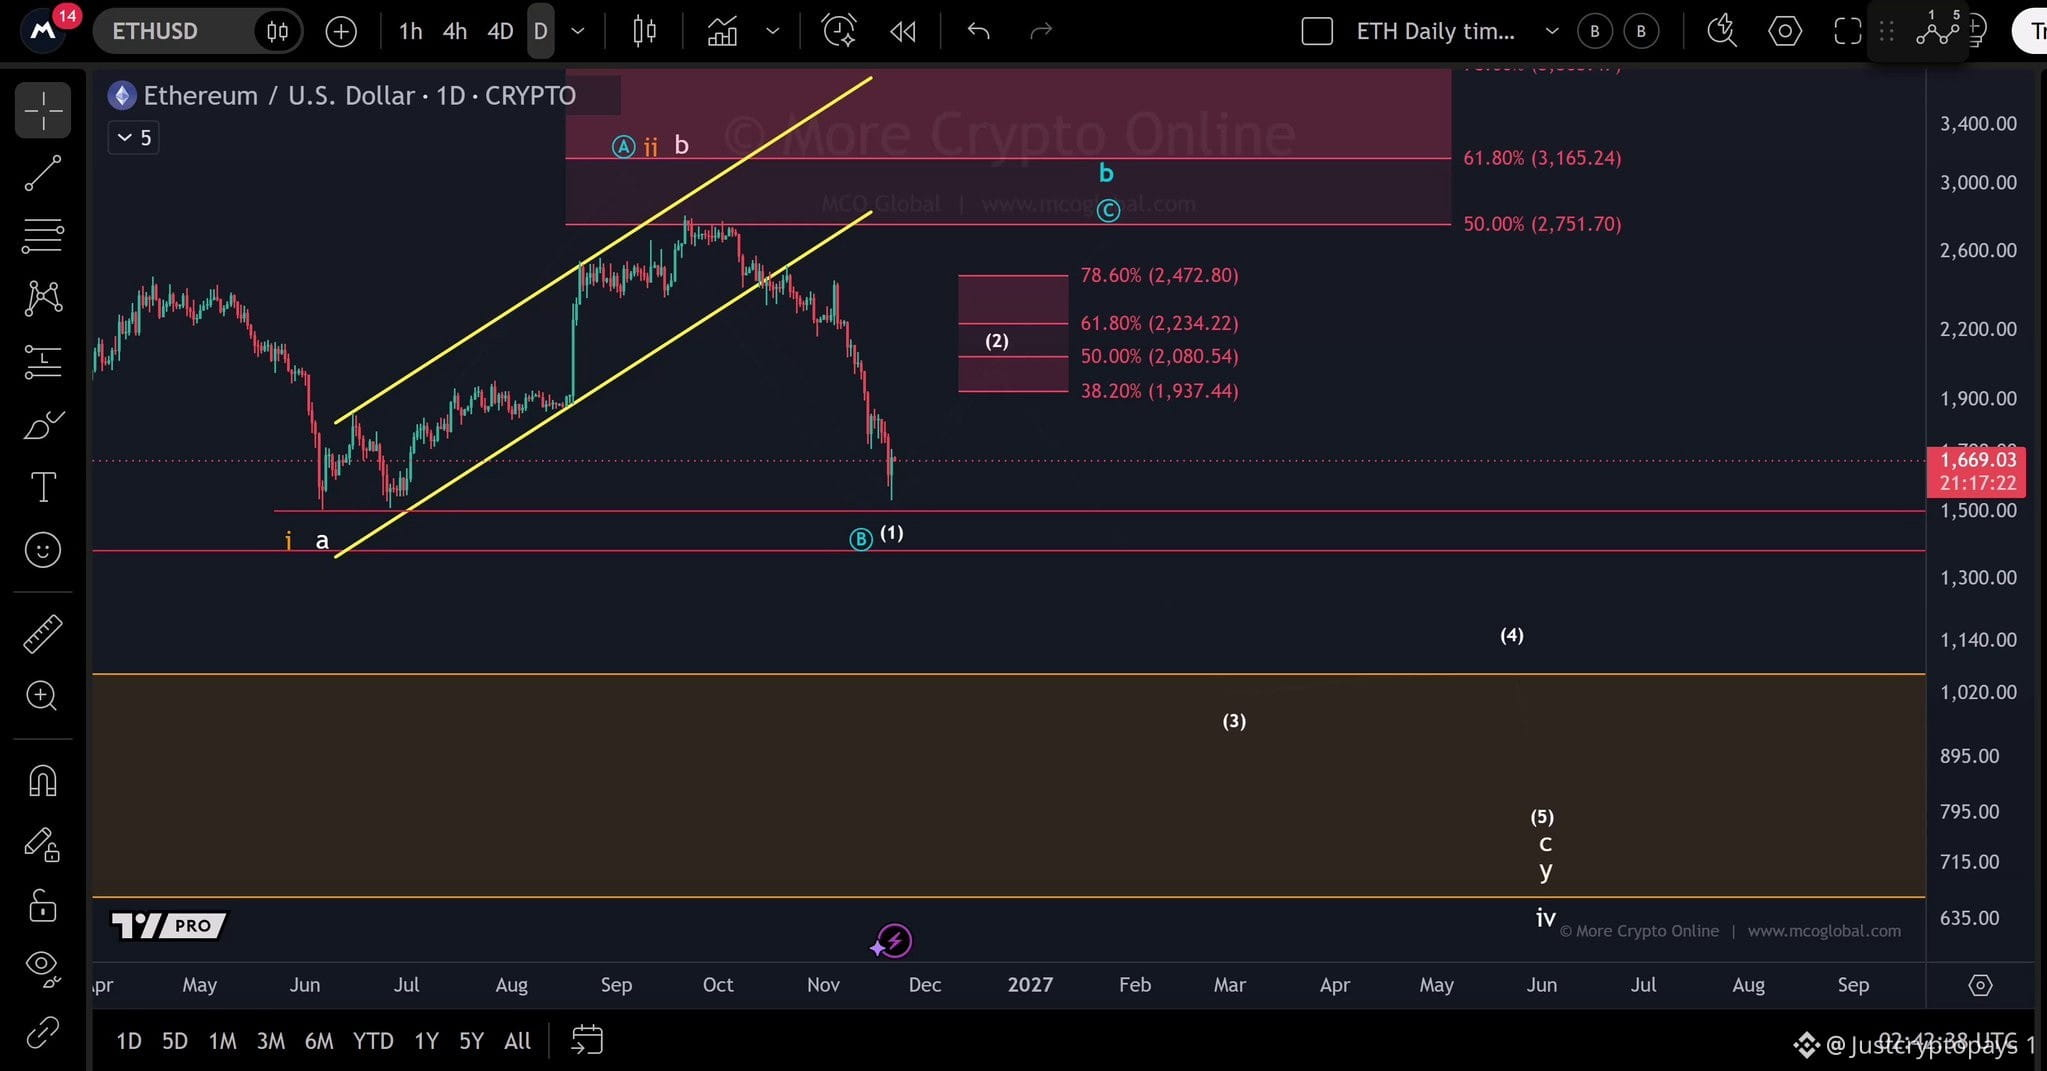
$ETH On the daily chart, the white scenario suggests that wave (1) to the downside may be complete, potentially setting the stage for a wave (2) bounce. If wave B peaked in September, wave C should develop in five waves to the downside. This would include a corrective wave (2) bounce before further declines in waves (3), (4) and (5). The red resistance zone for wave (2) sits between $1,937 and $2,472. However, there is still no clear sign of buyers taking control, as ETH continues to form lower highs and lower lows. #ETH #Ethereum
Join global crypto users on Binance Square
⚡️ Get latest and useful information about crypto.
💬 Trusted by the world’s largest crypto exchange.
👍 Discover real insights from verified creators.
Email / Phone number