
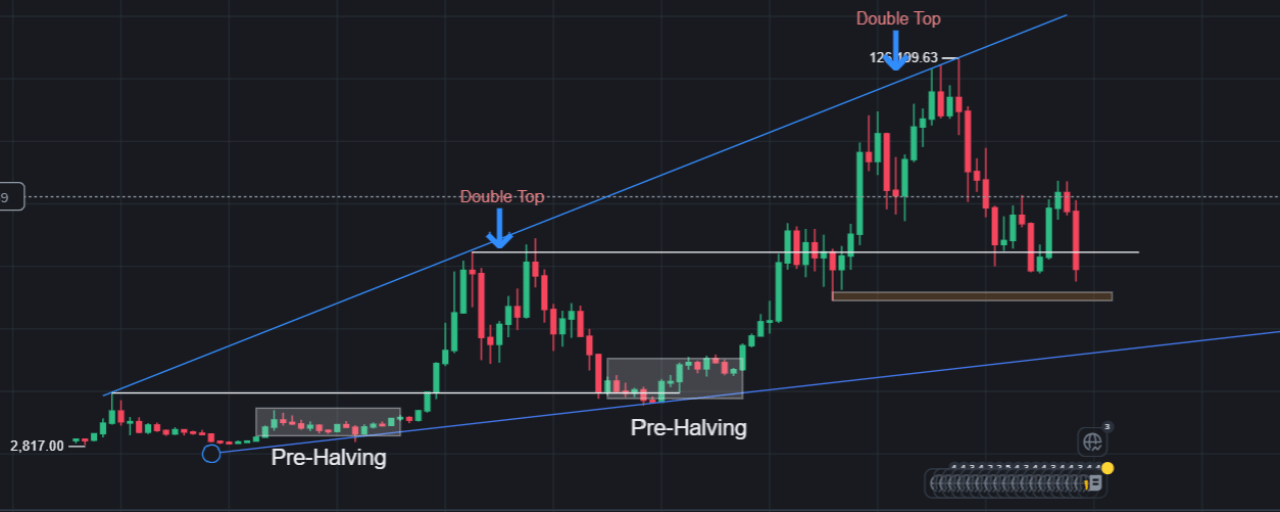


I've been studying this long-term Bitcoin chart, and something fascinating caught my attention. The similarities between the 2020–2021 and 2024–2025 market cycles are difficult to ignore. Both periods show pre-halving consolidation, powerful bullish expansion, and potential double-top formations near a major ascending resistance trendline. But the biggest question is whether we're witnessing another historical cycle reversal.
📊 LET'S GO BACK TO THE 2021 BULL RUN!
Bitcoin's third halving took place on May 11, 2020, when BTC was trading around $8,750. Following the halving, Bitcoin experienced an extraordinary rally, eventually reaching approximately $64,600 in April 2021. However, buyers couldn't sustain the momentum, and BTC suffered a major correction toward $29,000.
Interestingly, Bitcoin recovered and established another major high near $69,000 in November 2021. That second peak was only around 7% higher than the April high. Afterward, the bullish structure collapsed, and Bitcoin eventually reached approximately $15,500 in November 2022. That's a devastating correction of nearly 78% from its peak!
Now look at the current cycle. 👀
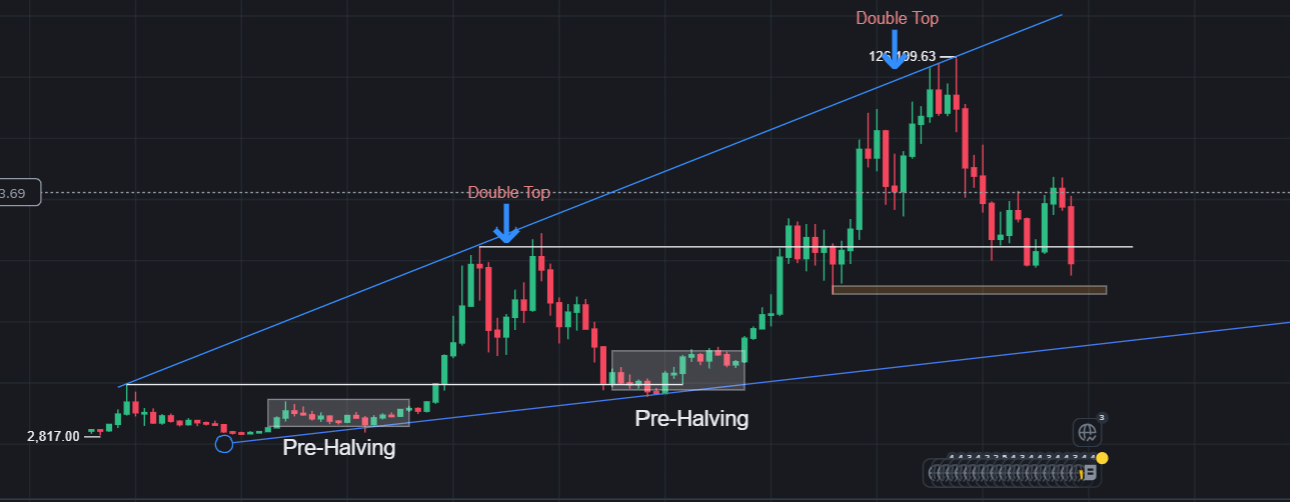
🚨 THE 2024–2025 CYCLE LOOKS SURPRISINGLY FAMILIAR!
Bitcoin's fourth halving happened on April 20, 2024, when BTC was trading near $64,000. Once again, the market experienced substantial bullish expansion, eventually reaching approximately $125,110 on the supplied chart. Other market data recorded a high near $126,200 in October 2025.
Notice something interesting? Both major cycle highs occurred roughly 18 months after their respective halvings.
Even more interestingly, the latest major peak developed near the same upper ascending resistance trendline that previously marked an important cycle-top region.
Since then, Bitcoin has experienced significant selling pressure. By November 21, 2026, BTC had fallen as low as approximately $55,150 before recovering toward $60,000. That represents a peak-to-low correction of roughly 56% from the October 2025 high.
So the current decline is already substantial, although it has not matched the approximately 78% drawdown experienced during the previous bear market.
📉 WHAT DOES THE DOUBLE-TOP STRUCTURE TELL US?
A double top typically develops when buyers make two major attempts to push prices higher but fail to sustain the breakout. Once the neckline breaks, the structure can signal a transition from accumulation and bullish expansion toward distribution and bearish continuation.
The chart highlights similar topping behavior in both cycles. However, the two formations are not identical, and a double-top label alone cannot confirm that the same outcome will follow.
The long-term ascending channel makes this analysis even more interesting. Previous bullish expansions encountered resistance near the upper boundary, while major corrections eventually moved toward lower support regions.
Could Bitcoin be following a similar path again?
🎯 KEY LEVELS I'M WATCHING NOW!
Around $59,000–$60,000, Bitcoin is attempting to stabilize following its recent sharp correction. The first important recovery area is $62,000–$65,000, followed by the broader $70,000–$75,000 resistance region.
On the downside, the recent $55,000–$58,000 region deserves close attention. A decisive breakdown below $55,000 could expose the psychological $50,000 level and increase the risk of further weakness.
However, a sustained recovery above $65,000 would be an encouraging first step, while reclaiming $70,000–$75,000 would provide stronger evidence of improving market structure.
⚠️ MY TAKE:
I'm not saying Bitcoin must repeat the 2021–2022 bear market. Markets evolve, liquidity conditions change, and historical patterns never guarantee future outcomes.
But here's what concerns me: Bitcoin has already experienced a correction exceeding 50% from its latest major peak, while the long-term chart shows a potential topping structure similar to previous cycles.
In 2021, many traders interpreted the initial corrections as buying opportunities, only to watch the market decline much further. That's why I believe protecting capital and waiting for structural confirmation are particularly important during periods like this.
For now, I'm watching whether BTC can establish a sustainable recovery above $65,000 or whether another rejection sends it back toward the recent lows.
And remember, even if Bitcoin eventually forms a major bottom, identifying that bottom in real time is much harder than recognizing it afterward.
What do you think, buddies? 👀 Is Bitcoin repeating its 2021 cycle and preparing for another major correction, or will this cycle surprise everyone with an unexpected bullish recovery?
History doesn't repeat perfectly, but sometimes the similarities are too interesting to ignore! 🎯

#BTCReboundsAbove$60KAmidWhaleDipBuying #TwentyOneCapitalAdds172.25BTC