Remember the $BULLA short we discussed❓Sometimes the best opportunities come when the market changes direction.
What's happening on the chart?
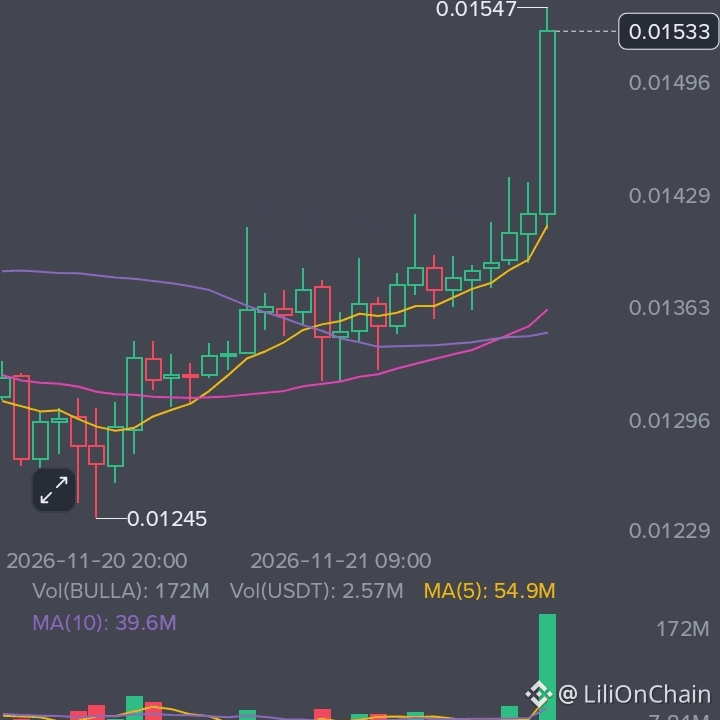
#BULLA has pushed above its moving averages with a strong bullish candle and a noticeable volume spike. Buyers are clearly showing strength, but RSI is now around 93 which signals extremely overbought conditions.
📍Levels I'm watching:
- $0.01547 – Immediate resistance
- $0.01496 – First pullback area
- $0.01418 – MA7 support
A clean breakout above $0.01547 could open the door for another move up, while rejection may bring a short-term correction.
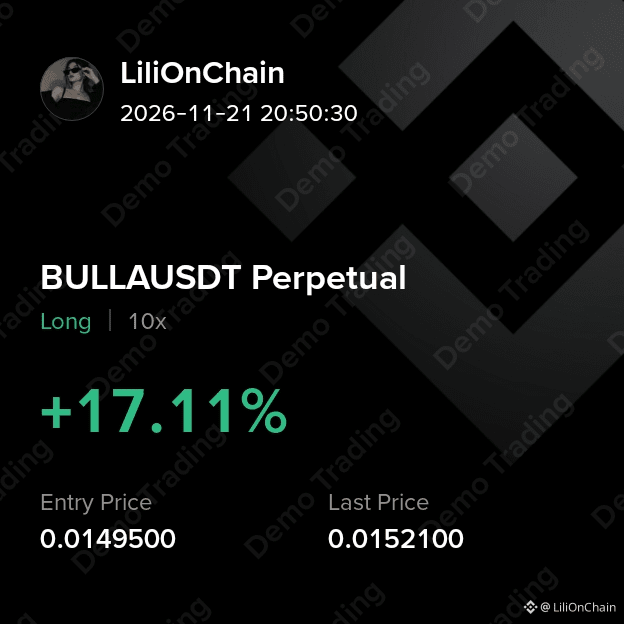
OPEN TRADE 👇🏻
$IDOL #trading $KERNEL
What's happening on the chart?
#BULLA has pushed above its moving averages with a strong bullish candle and a noticeable volume spike. Buyers are clearly showing strength, but RSI is now around 93 which signals extremely overbought conditions.
📍Levels I'm watching:
- $0.01547 – Immediate resistance
- $0.01496 – First pullback area
- $0.01418 – MA7 support
A clean breakout above $0.01547 could open the door for another move up, while rejection may bring a short-term correction.
OPEN TRADE 👇🏻
$IDOL #trading $KERNEL