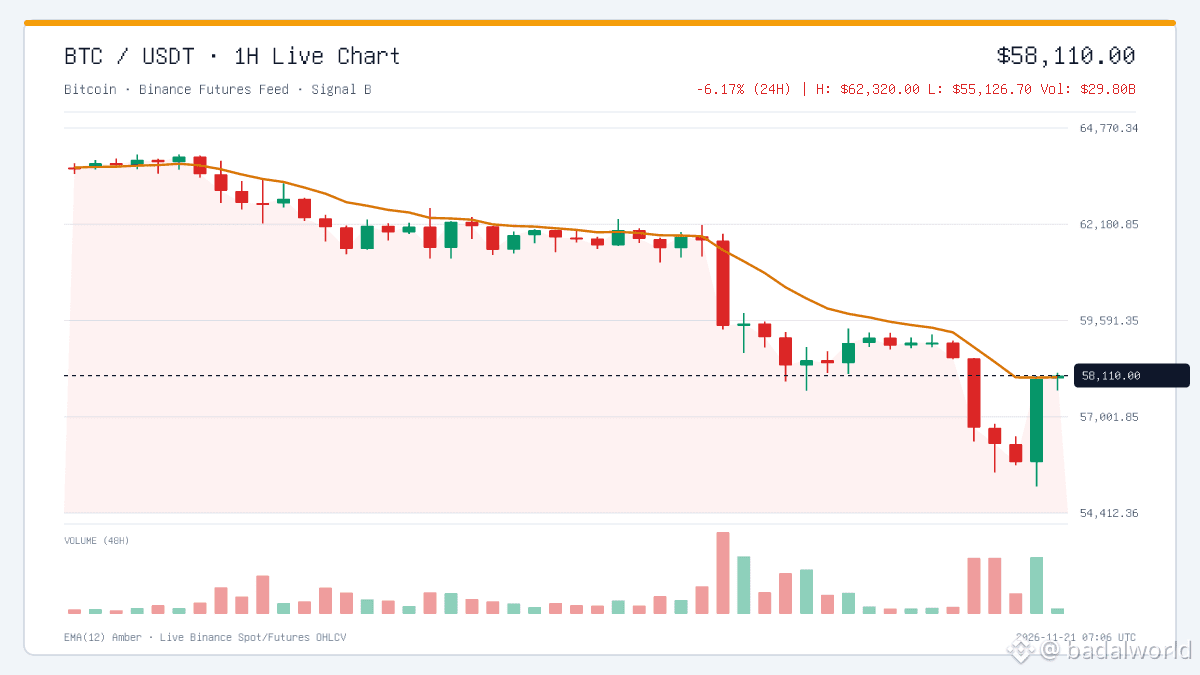
Are you still waiting for the dip to buy, or are you finally sweating through your long positions as we tap the $55k range?
The 1H chart shows $BTC testing critical liquidity zones after a 6% pullback. While institutional demand via spot ETFs has been the narrative, the current net taker buy flow of $188M suggests some are trying to catch the knife here at 58,064. We are holding above the recent lows, but with BTC dominance creeping up to 57.5%, the rest of the market is getting slaughtered. I am watching the $55,126 level closely; if that gives way, the structure shifts.
Always manage your leverage, as market volatility is no joke right now. NFA/DYOR. Do you think this is a liquidity sweep before a trend reversal, or is the macro pressure simply too heavy to ignore? 📊
#BinanceSquare #BinanceFutures #Crypto
The 1H chart shows $BTC testing critical liquidity zones after a 6% pullback. While institutional demand via spot ETFs has been the narrative, the current net taker buy flow of $188M suggests some are trying to catch the knife here at 58,064. We are holding above the recent lows, but with BTC dominance creeping up to 57.5%, the rest of the market is getting slaughtered. I am watching the $55,126 level closely; if that gives way, the structure shifts.
Always manage your leverage, as market volatility is no joke right now. NFA/DYOR. Do you think this is a liquidity sweep before a trend reversal, or is the macro pressure simply too heavy to ignore? 📊
#BinanceSquare #BinanceFutures #Crypto