$BFUSD: One Way Volume Myth Check
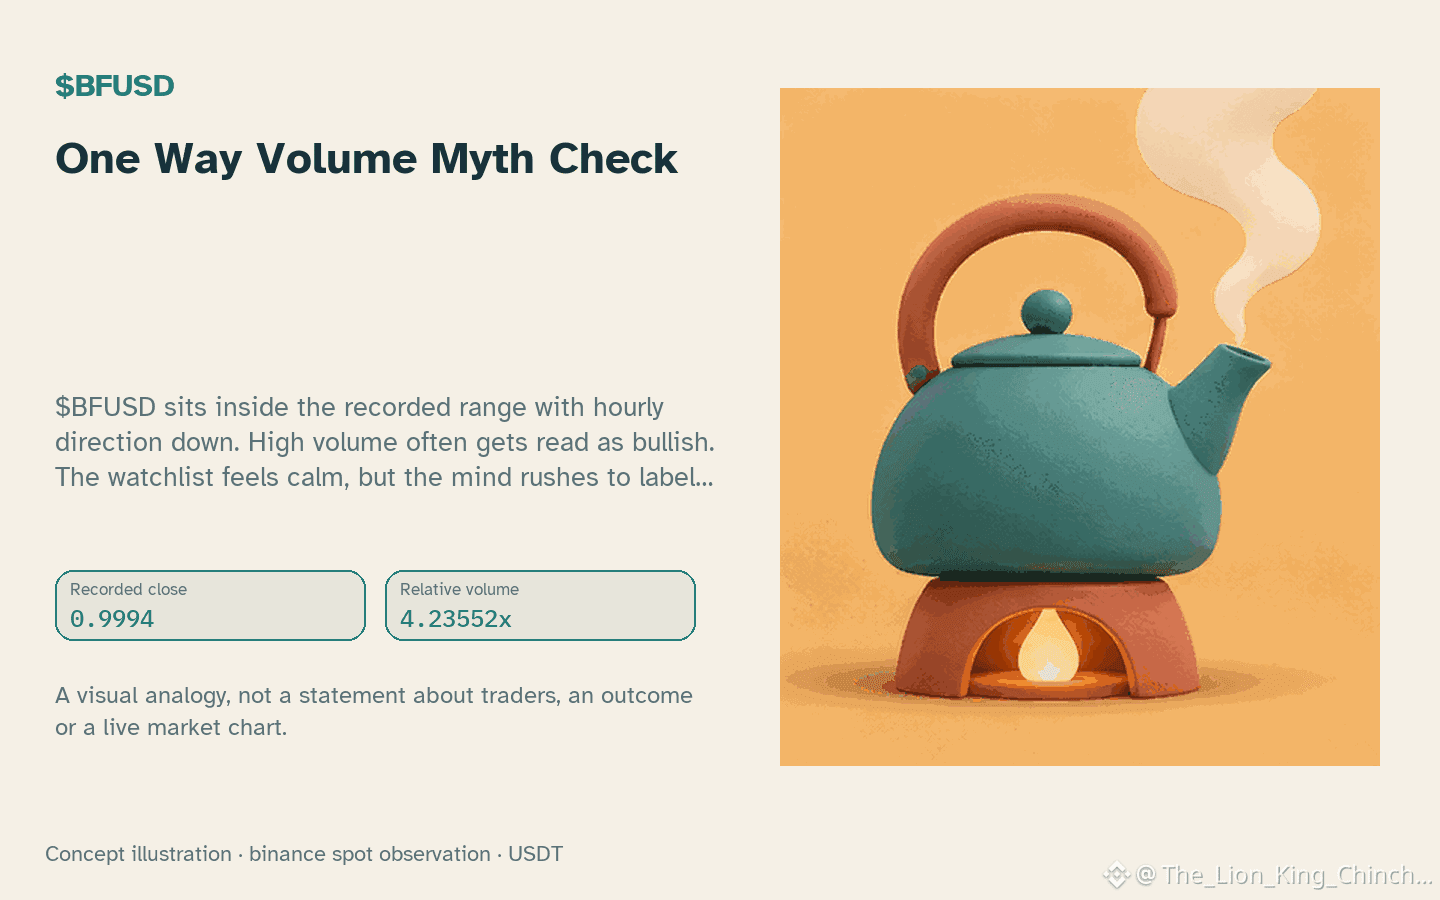
$BFUSD sits inside the recorded range with hourly direction down. High volume often gets read as bullish. The watchlist feels calm, but the mind rushes to label buyers. This is a hypothetical research habit, not a crowd claim. Volume measures effort, not intent. A candle up with high volume is not automatic accumulation. A candle down with high volume is not automatic selling panic without context. We must ask what the candle could mean, not what it must mean. The counterexample helps. Imagine a chart where price rises on high volume. Many see strength. Another view sees late entry pressure that needs rest. Now price falls on high volume. Many see weakness. Another view sees initial selling that tests support. Both are possible. The same volume can fit different stories. To check the idea, look at the close. If price closes above resistance on high volume, the bullish story gains weight. If it stays below support, the bearish story gains weight. But neither fact proves motive. We only see price and volume, not who traded. Without order flow data, causes remain hidden. The lesson is to pause before labeling. Ask if the rule fits the close, not just the bar. This keeps the analysis honest. It turns a guess into a testable question.
Probabilistic market research, not a recommendation or guaranteed return.
Have you changed the rule after seeing the candle?
#BFUSD #LearnCrypto #CryptoLearning
$BFUSD sits inside the recorded range with hourly direction down. High volume often gets read as bullish. The watchlist feels calm, but the mind rushes to label buyers. This is a hypothetical research habit, not a crowd claim. Volume measures effort, not intent. A candle up with high volume is not automatic accumulation. A candle down with high volume is not automatic selling panic without context. We must ask what the candle could mean, not what it must mean. The counterexample helps. Imagine a chart where price rises on high volume. Many see strength. Another view sees late entry pressure that needs rest. Now price falls on high volume. Many see weakness. Another view sees initial selling that tests support. Both are possible. The same volume can fit different stories. To check the idea, look at the close. If price closes above resistance on high volume, the bullish story gains weight. If it stays below support, the bearish story gains weight. But neither fact proves motive. We only see price and volume, not who traded. Without order flow data, causes remain hidden. The lesson is to pause before labeling. Ask if the rule fits the close, not just the bar. This keeps the analysis honest. It turns a guess into a testable question.
Probabilistic market research, not a recommendation or guaranteed return.
Have you changed the rule after seeing the candle?
#BFUSD #LearnCrypto #CryptoLearning