$RLUSD: Average Pricing Beyond Arithmetic
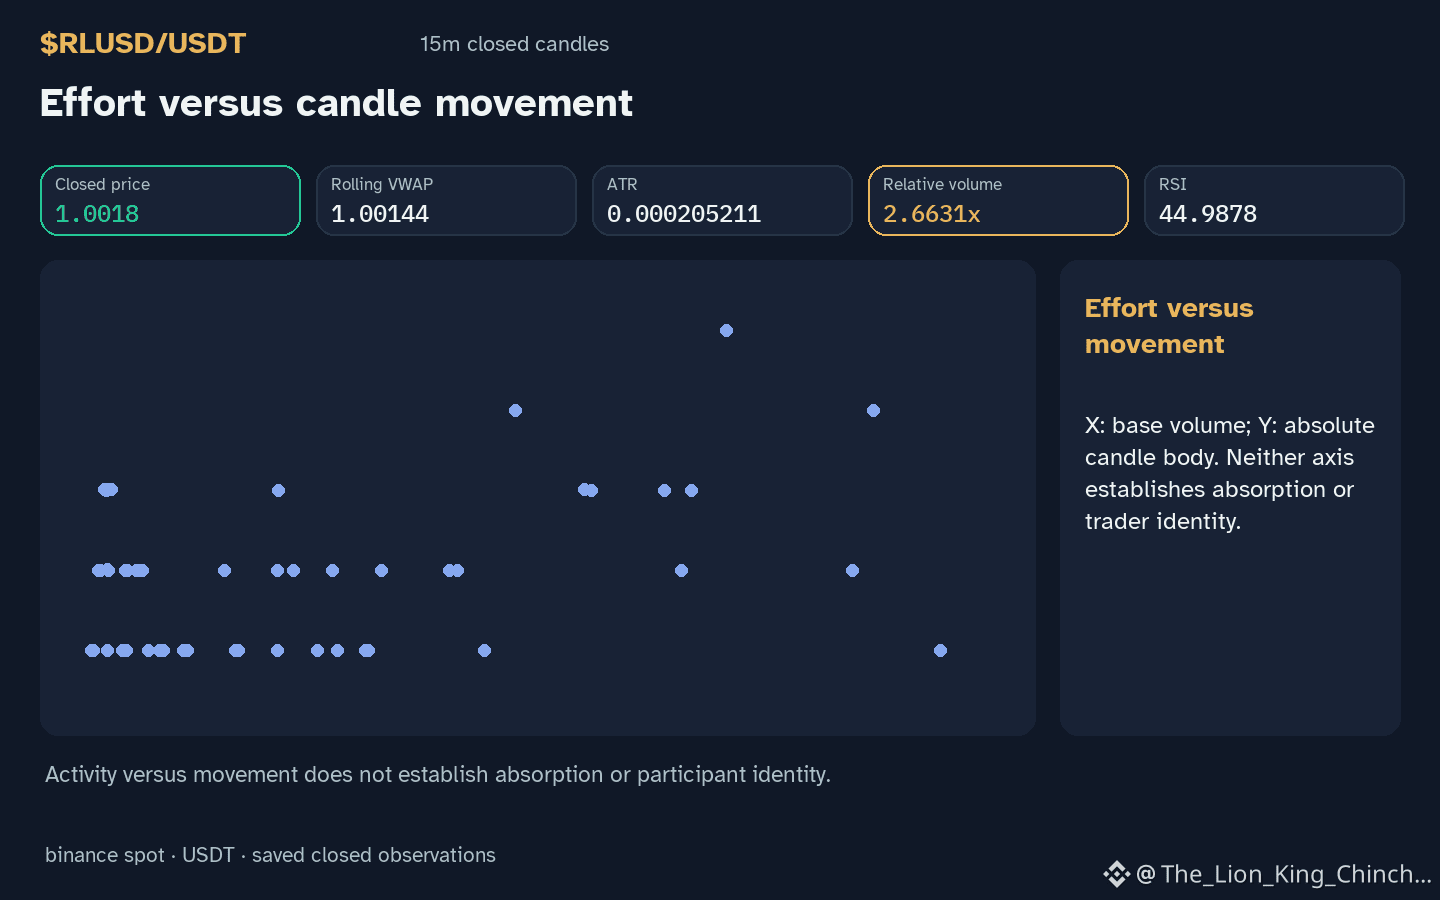
Does the $RLUSD price relationship to a moving average reveal an actual center of gravity or just a mathematical trail? The hourly direction is currently down with volume 2.66x the baseline.
Researching markets often involves a funny ritual where one stares at a line until it looks like a physical barrier. It is easy to treat a volume-weighted average price as a solid floor while the mind races to predict a rebound. In reality, this metric is a simple calculation that scales price by the size of activity. It provides a single reference point for the total value exchanged during a session, rather than a prediction of where future activity must occur.
Imagine a thought experiment where ten units move at high prices and one unit moves at a low price. The average sits near the top. This does not mean the price is destined to return there; it only records where the heaviest participation happened. If recent activity stays below this level, it suggests that current transactions are occurring at lower values than the session average.
A daily change of 0.0599281% shows how current levels deviate from the start. A useful reassessment occurs if price stays below support 1.0018 on high volume. This would indicate the weighted average is shifting lower, weakening the idea that the previous average acts as a permanent anchor.
Probabilistic market research, not a recommendation or guaranteed return.
#RLUSD #LearnCrypto
Does the $RLUSD price relationship to a moving average reveal an actual center of gravity or just a mathematical trail? The hourly direction is currently down with volume 2.66x the baseline.
Researching markets often involves a funny ritual where one stares at a line until it looks like a physical barrier. It is easy to treat a volume-weighted average price as a solid floor while the mind races to predict a rebound. In reality, this metric is a simple calculation that scales price by the size of activity. It provides a single reference point for the total value exchanged during a session, rather than a prediction of where future activity must occur.
Imagine a thought experiment where ten units move at high prices and one unit moves at a low price. The average sits near the top. This does not mean the price is destined to return there; it only records where the heaviest participation happened. If recent activity stays below this level, it suggests that current transactions are occurring at lower values than the session average.
A daily change of 0.0599281% shows how current levels deviate from the start. A useful reassessment occurs if price stays below support 1.0018 on high volume. This would indicate the weighted average is shifting lower, weakening the idea that the previous average acts as a permanent anchor.
Probabilistic market research, not a recommendation or guaranteed return.
#RLUSD #LearnCrypto