Most traders only look at USDT charts, and it quietly costs them months of performance.
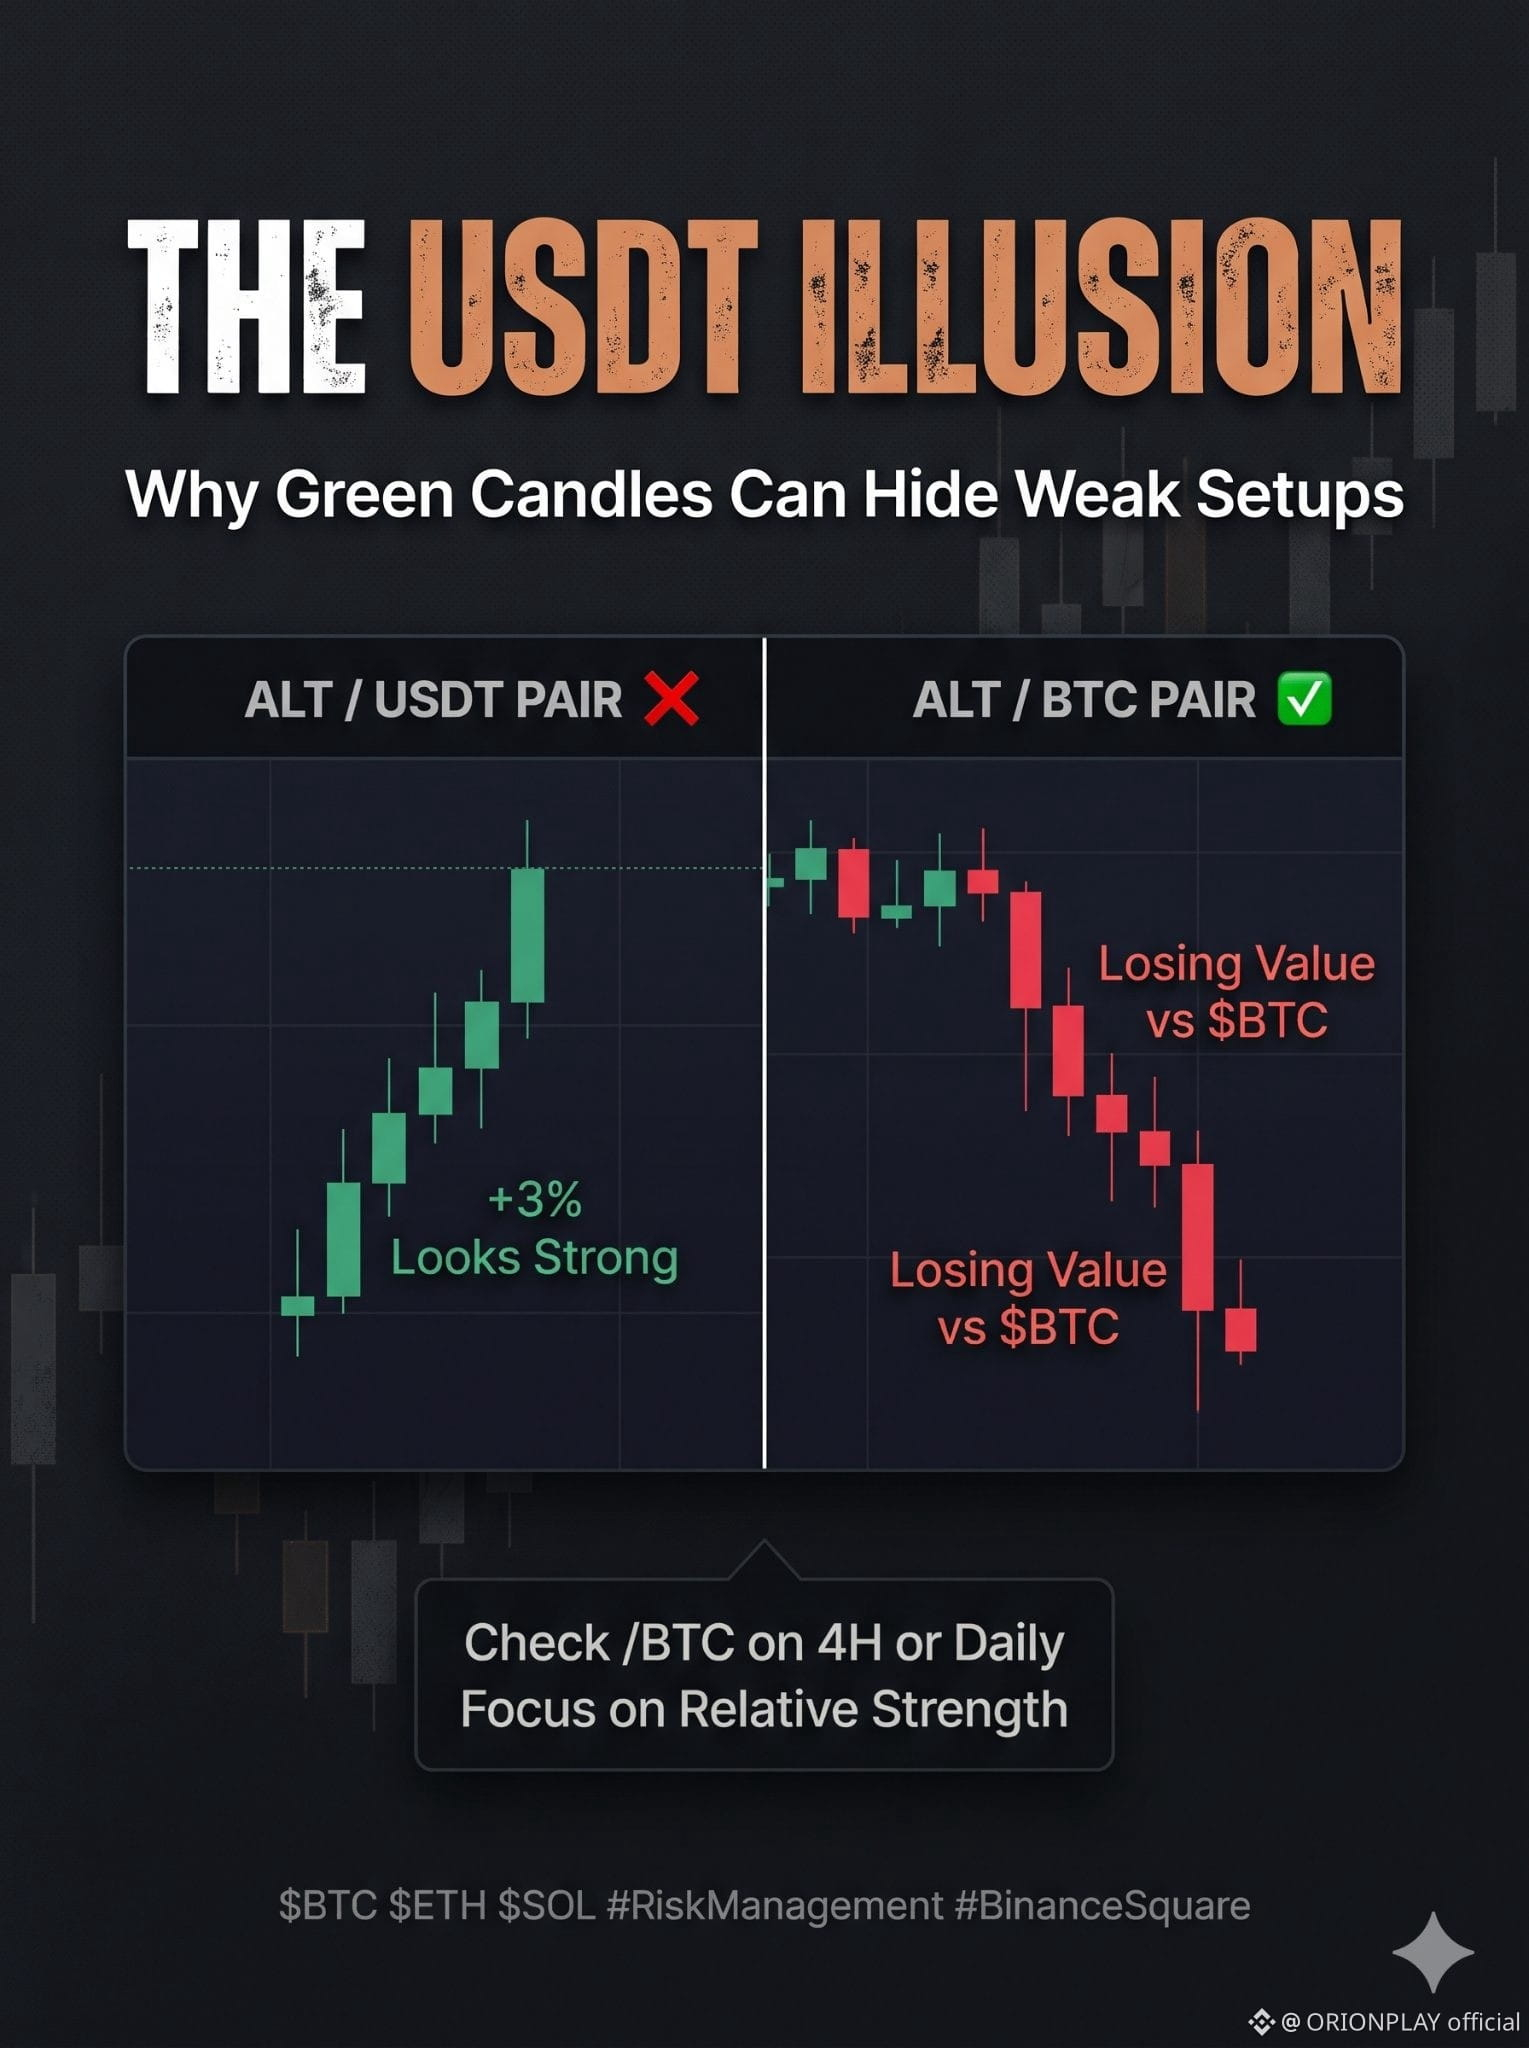
Picture a typical green day: $BTC pushes up 5%, while ETH orSOL climbs around 3%. If you only watch USDT pairs, everything looks healthy. Your altcoin position is in profit, so you assume the setup is working.
Flip over to the BTC pair, though, and the chart tells a completely different story. Your alt isn't actually showing strength. It’s losing relative value against Bitcoin. You took on wider volatility, thinner order books, and heavier downside risk just to earn less than simply holding spot $BTC.
Worse, coins that lag on their BTC pairs during a market bounce are usually the first to drop twice as hard when Bitcoin pulls back.
Before opening an altcoin swing, run a ten-second filter:
Pull up the coin's /BTC chart on the 4-hour or daily timeframe.
Check if it's holding structural support or printing lower lows against $BTC.
Focus on assets showing genuine relative strength instead of coins just getting dragged up by Bitcoin's momentum.
Green USDT candles can hide weak setups. Do you check the /BTC chart before trading alts, or stick strictly to USDT pairs?
#CryptoTrading #MarketMechanics #RiskManagement #BinanceSquare
Picture a typical green day: $BTC pushes up 5%, while ETH orSOL climbs around 3%. If you only watch USDT pairs, everything looks healthy. Your altcoin position is in profit, so you assume the setup is working.
Flip over to the BTC pair, though, and the chart tells a completely different story. Your alt isn't actually showing strength. It’s losing relative value against Bitcoin. You took on wider volatility, thinner order books, and heavier downside risk just to earn less than simply holding spot $BTC.
Worse, coins that lag on their BTC pairs during a market bounce are usually the first to drop twice as hard when Bitcoin pulls back.
Before opening an altcoin swing, run a ten-second filter:
Pull up the coin's /BTC chart on the 4-hour or daily timeframe.
Check if it's holding structural support or printing lower lows against $BTC.
Focus on assets showing genuine relative strength instead of coins just getting dragged up by Bitcoin's momentum.
Green USDT candles can hide weak setups. Do you check the /BTC chart before trading alts, or stick strictly to USDT pairs?
#CryptoTrading #MarketMechanics #RiskManagement #BinanceSquare