
Alright... $SOXS just bounced hard from $66 and everybody is asking "is the breakout here?" 😁
But but... honestly, I'm not convinced either, and that's a valid take 👀
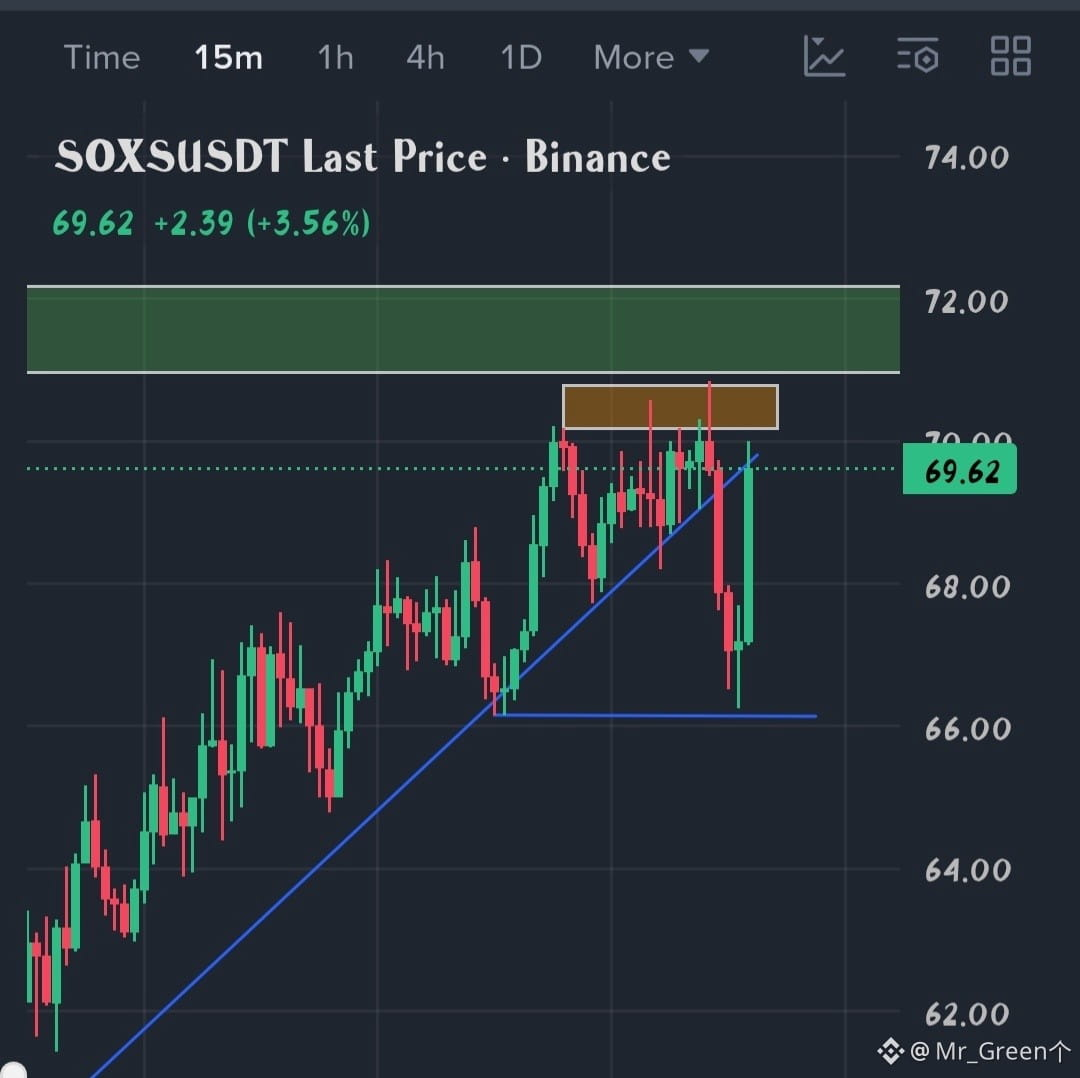
Look at this 15m chart. Price was climbing nicely along the blue trendline, then broke below it and dumped to $66.20. Now it's bouncing back up to $69.62, right at the underside of that same trendline 🎯
A broken trendline that gets retested from below often acts as resistance. And just above price, there's the $70.20-$70.80 supply zone, where price has already been rejected several times. So we're stuck between a broken trendline and a stacked resistance zone 😅
Personally, I am NOT taking a trade here... when price is in the middle of chop, there's no edge. I'm watching for a clear reaction 👀
Resistance: $70.20-$70.80, then the $71-$72 green zone
Support: $68, then $66.20, the recent low
Bullish confirmation: a strong 15m close above $70.80, then a retest that holds ✅
Bearish confirmation: a clean close below $66.20 would break the structure and open the door to $64 😅
Right now the risk/reward is poor. Buying near resistance means a tight upside and a stop below $66, and shorting after a sharp bounce means getting squeezed. Both sides can get trapped here.
⚠️ This is the 15m chart, so fakeouts happen fast. Sometimes the best trade is no trade. No trade is also a position, and it protects your capital 🧠
So what's your plan here? Are you waiting for the $70.80 breakout or the $66.20 breakdown? 👇
Follow for more weekly chart analysis and trading opportunities 🔔
Not financial advice. Always DYOR and manage your risk.
But but... honestly, I'm not convinced either, and that's a valid take 👀
Look at this 15m chart. Price was climbing nicely along the blue trendline, then broke below it and dumped to $66.20. Now it's bouncing back up to $69.62, right at the underside of that same trendline 🎯
A broken trendline that gets retested from below often acts as resistance. And just above price, there's the $70.20-$70.80 supply zone, where price has already been rejected several times. So we're stuck between a broken trendline and a stacked resistance zone 😅
Personally, I am NOT taking a trade here... when price is in the middle of chop, there's no edge. I'm watching for a clear reaction 👀
Resistance: $70.20-$70.80, then the $71-$72 green zone
Support: $68, then $66.20, the recent low
Bullish confirmation: a strong 15m close above $70.80, then a retest that holds ✅
Bearish confirmation: a clean close below $66.20 would break the structure and open the door to $64 😅
Right now the risk/reward is poor. Buying near resistance means a tight upside and a stop below $66, and shorting after a sharp bounce means getting squeezed. Both sides can get trapped here.
⚠️ This is the 15m chart, so fakeouts happen fast. Sometimes the best trade is no trade. No trade is also a position, and it protects your capital 🧠
So what's your plan here? Are you waiting for the $70.80 breakout or the $66.20 breakdown? 👇
Follow for more weekly chart analysis and trading opportunities 🔔
Not financial advice. Always DYOR and manage your risk.