

Bitcoin (BTC) Daily Market Analysis | November 20, 2026
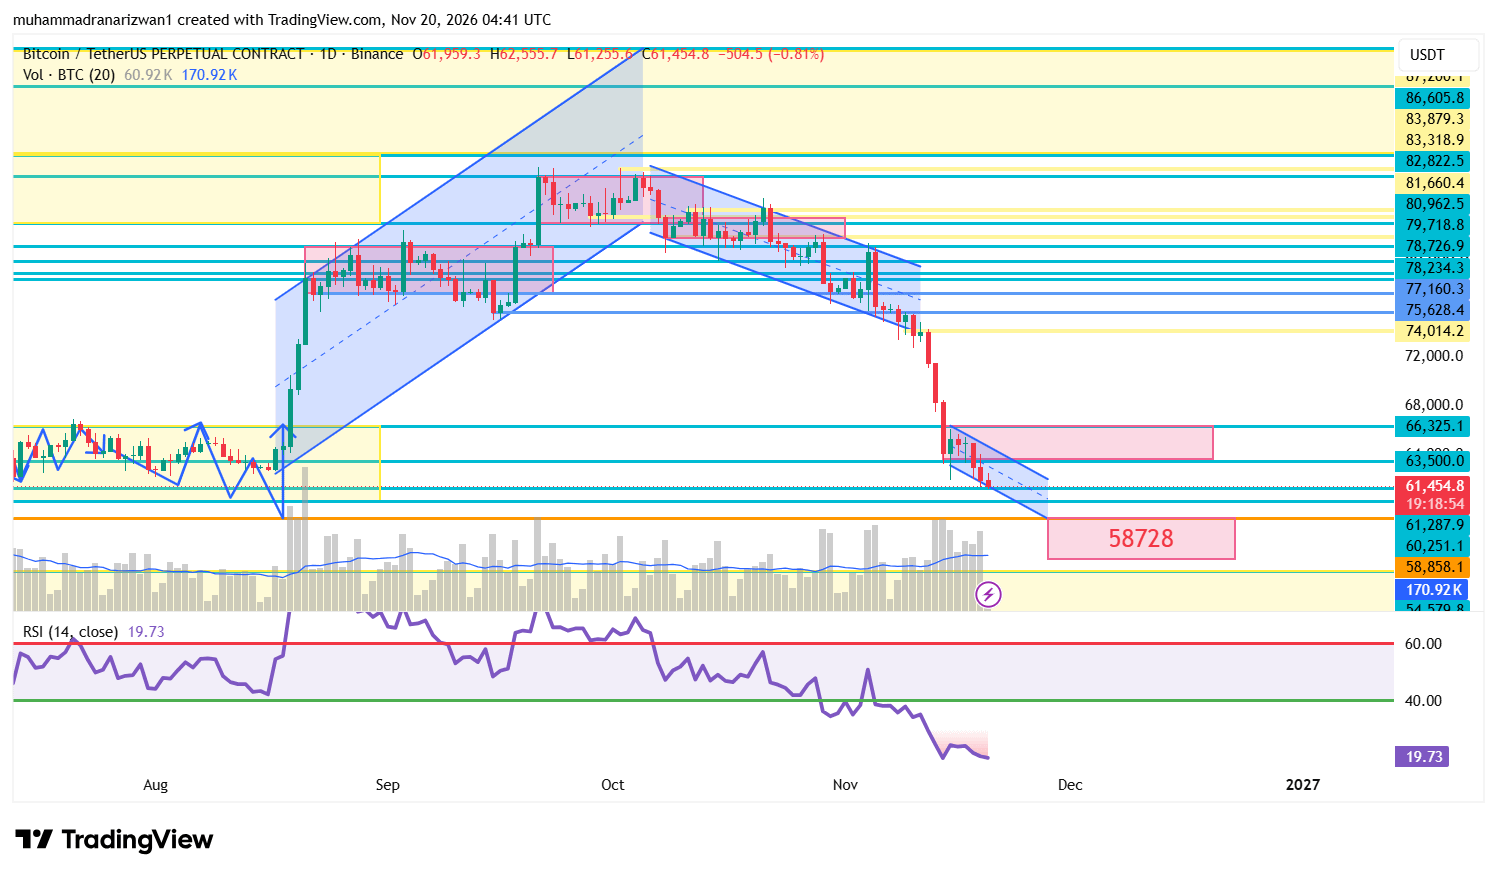
Bitcoin is facing intense selling pressure, and the market structure has turned strongly bearish. BTC is currently trading around $61,450, following a sharp breakdown from the $74K–$78K zone, with sellers dominating the daily timeframe.
The latest chart shows a clear bearish trend, while the Daily RSI has dropped to approximately 19.73, putting Bitcoin deeply into oversold territory. This increases the possibility of a short-term relief bounce, but oversold conditions alone do not confirm a trend reversal.
📉 Bitcoin Market Overview
Bitcoin has broken several important support levels, and the price is now trading near a critical support zone.
Current Price: $61,450
Daily Trend: Bearish
Daily RSI: 19.73 (Oversold)
Market Sentiment: Extreme Fear
Crypto Fear & Greed Index: 12
USDT Dominance: 8.396% (Rising)
The broader crypto market is also under pressure. According to today's market snapshot, the overall crypto market trend remains bearish, while rising USDT dominance suggests investors may be moving toward stablecoins during this period of uncertainty.
The broader market weakness and BTC's recent decline also align with today's market reports.
🔍 Technical Analysis: What Does the Chart Tell Us?
1. Strong Bearish Momentum
Bitcoin has broken down from its previous trading structure and is now forming lower highs and lower lows. The descending channel visible on the chart suggests that sellers still have control.
Until BTC reclaims major resistance levels, the overall bias remains bearish.
2. Daily RSI at 19.73 – Oversold Territory
The Daily RSI is currently around 19.73, which indicates extreme selling pressure.
Historically, deeply oversold conditions can lead to temporary relief rallies, short squeezes, or sideways consolidation. However, traders should not assume that an RSI below 20 automatically means Bitcoin has reached its bottom.
A bounce is possible, but trend confirmation is still missing.
3. Important Support Levels
The following levels are important for BTC in the coming sessions:
$61,287 – $61,000: Immediate support zone.
$60,250: Next important support.
$58,858 – $58,728: Major downside target zone if selling pressure continues.
A clean breakdown below $61,000 could accelerate the bearish momentum toward the $60,250 zone and potentially $58,700.
4. Key Resistance Levels
If Bitcoin attempts a relief rally, these levels could act as resistance:
$63,500: First major recovery level.
$66,325: Strong resistance and potential supply zone.
A recovery above $63,500 could trigger a short-term bounce, but reclaiming $66,325 would be a more meaningful signal of strength.
🎯 BTC/USDT Trading Signal
SELL / SHORT – BEARISH SETUP
Exchange: Binance Futures
Pair
BTC/USDT
Trade Setup
Short
Entry Zone
$63,300 – $63,500
Stop Loss
$66,450
TP1
$61,000
TP2
$60,250
TP3
$58,750
Entry confirmation: Wait for a bearish rejection near the entry zone instead of chasing price at current levels.
This is a conditional setup, not an instruction to enter immediately. If BTC never retests the entry zone, do not chase the trade.
🟢 What If Bitcoin Rebounds?
Because BTC's Daily RSI is deeply oversold, a temporary recovery is possible.
If buyers manage to push BTC above $63,500 and maintain momentum, the market could attempt a recovery toward $64,500–$66,325.
A strong daily close above $66,325 would weaken the immediate bearish structure and require reassessing the short setup.
🔴 What If BTC Breaks $61,000?
If BTC loses $61,000 with strong selling volume, the downside could extend toward:
$60,250
$59,500
$58,750
The $58,700 area is an important downside zone to watch if the current bearish momentum continues.
🧠 My Final Market View
Bitcoin remains bearish on the daily timeframe. The breakdown in market structure, weak sentiment, rising stablecoin dominance, and strong selling pressure continue to favor sellers.
However, the Daily RSI near 19.73 makes chasing fresh shorts at current prices risky. A pullback toward the $63,300–$63,500 resistance zone could provide a better risk-defined short opportunity if price shows rejection.
My bias: Bearish below $63,500, with $60,250 and $58,750 as downside targets. A confirmed breakout above $66,325 would require a reassessment.
The market is extremely volatile right now. Protect your capital, avoid excessive leverage, and wait for confirmation rather than trading emotionally.
Follow for daily Bitcoin analysis, market updates, and trading setups!
#BitcoinETFs #BTC☀️ #CryptoTradingInsights #BinanceSquareTalks #BTCUSDTUPDATE
Disclaimer: This content is for educational and informational purposes only and is not financial advice. Cryptocurrency trading involves significant risk. Always do your own research (DYOR) and manage your risk carefully.