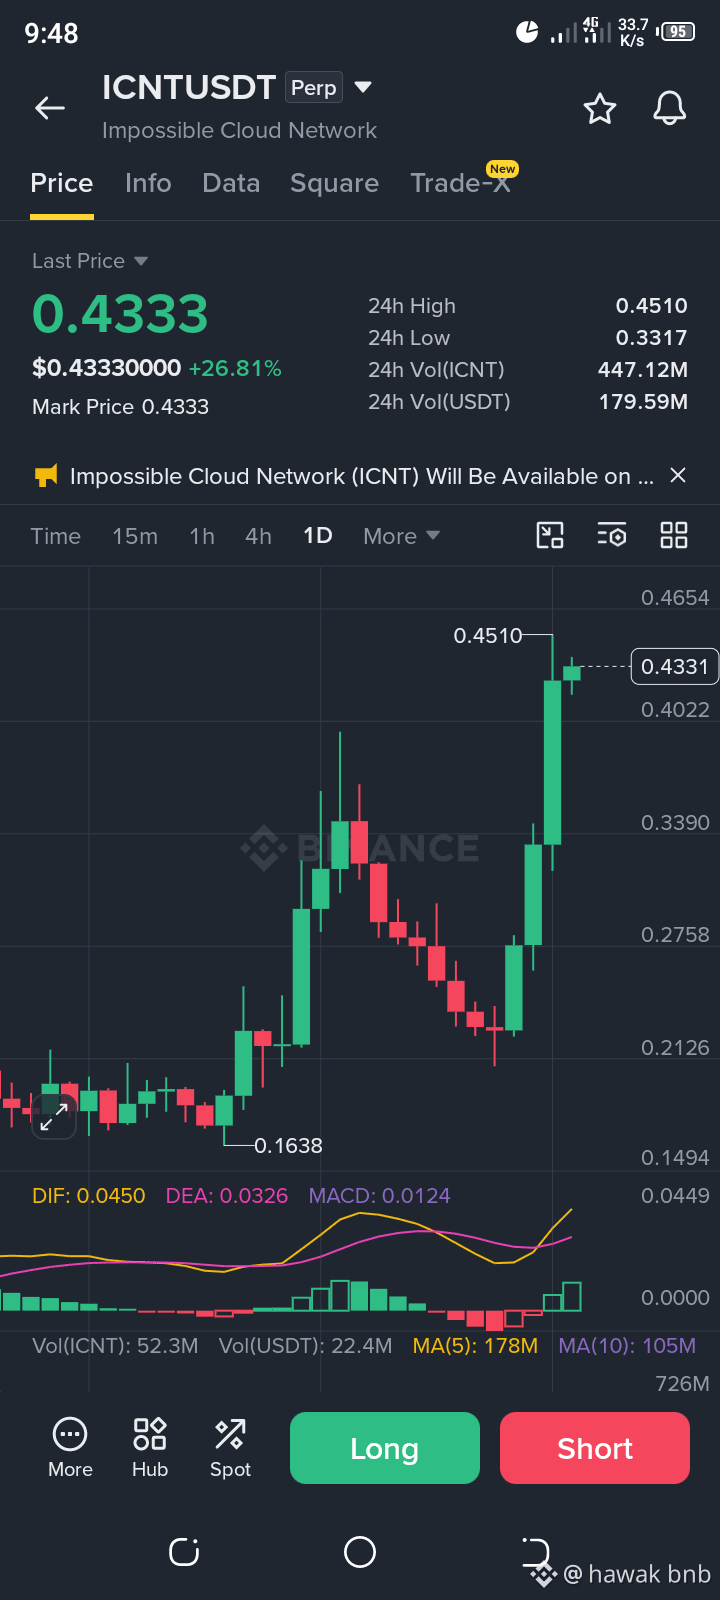
The ICNTUSDT perpetual chart on the 1-day timeframe shows strong bullish momentum, with the last price at $0.4333, up 26.81% over 24 hours. Price climbed from a local low of $0.1638 and reached a 24-hour high of $0.4510, while the 24-hour low sits at $0.3317. Trading volume is elevated at 447.12M ICNT and 179.59M USDT, supporting the sharp upward push. On the MACD indicator, DIF (0.0450) is above DEA (0.0326) with a positive histogram (0.0124), signaling upward trend strength. However, after rapid gains, short-term volatility and pullbacks near resistance around $0.4510–$0.4654 remain key risks. @icnt_sh #ICNTToken $ICNT
#NvidiaBoardReportedlySplitOverHuang’sReturn #CanGTA6'sLaunchLiftTTWOShares? #LedgerProbesTamperedWalletsInBerlinAndDubai #BTCRemainsUnderPressureAfterHawkishFOMCMinutes
#NvidiaBoardReportedlySplitOverHuang’sReturn #CanGTA6'sLaunchLiftTTWOShares? #LedgerProbesTamperedWalletsInBerlinAndDubai #BTCRemainsUnderPressureAfterHawkishFOMCMinutes