$EVAA
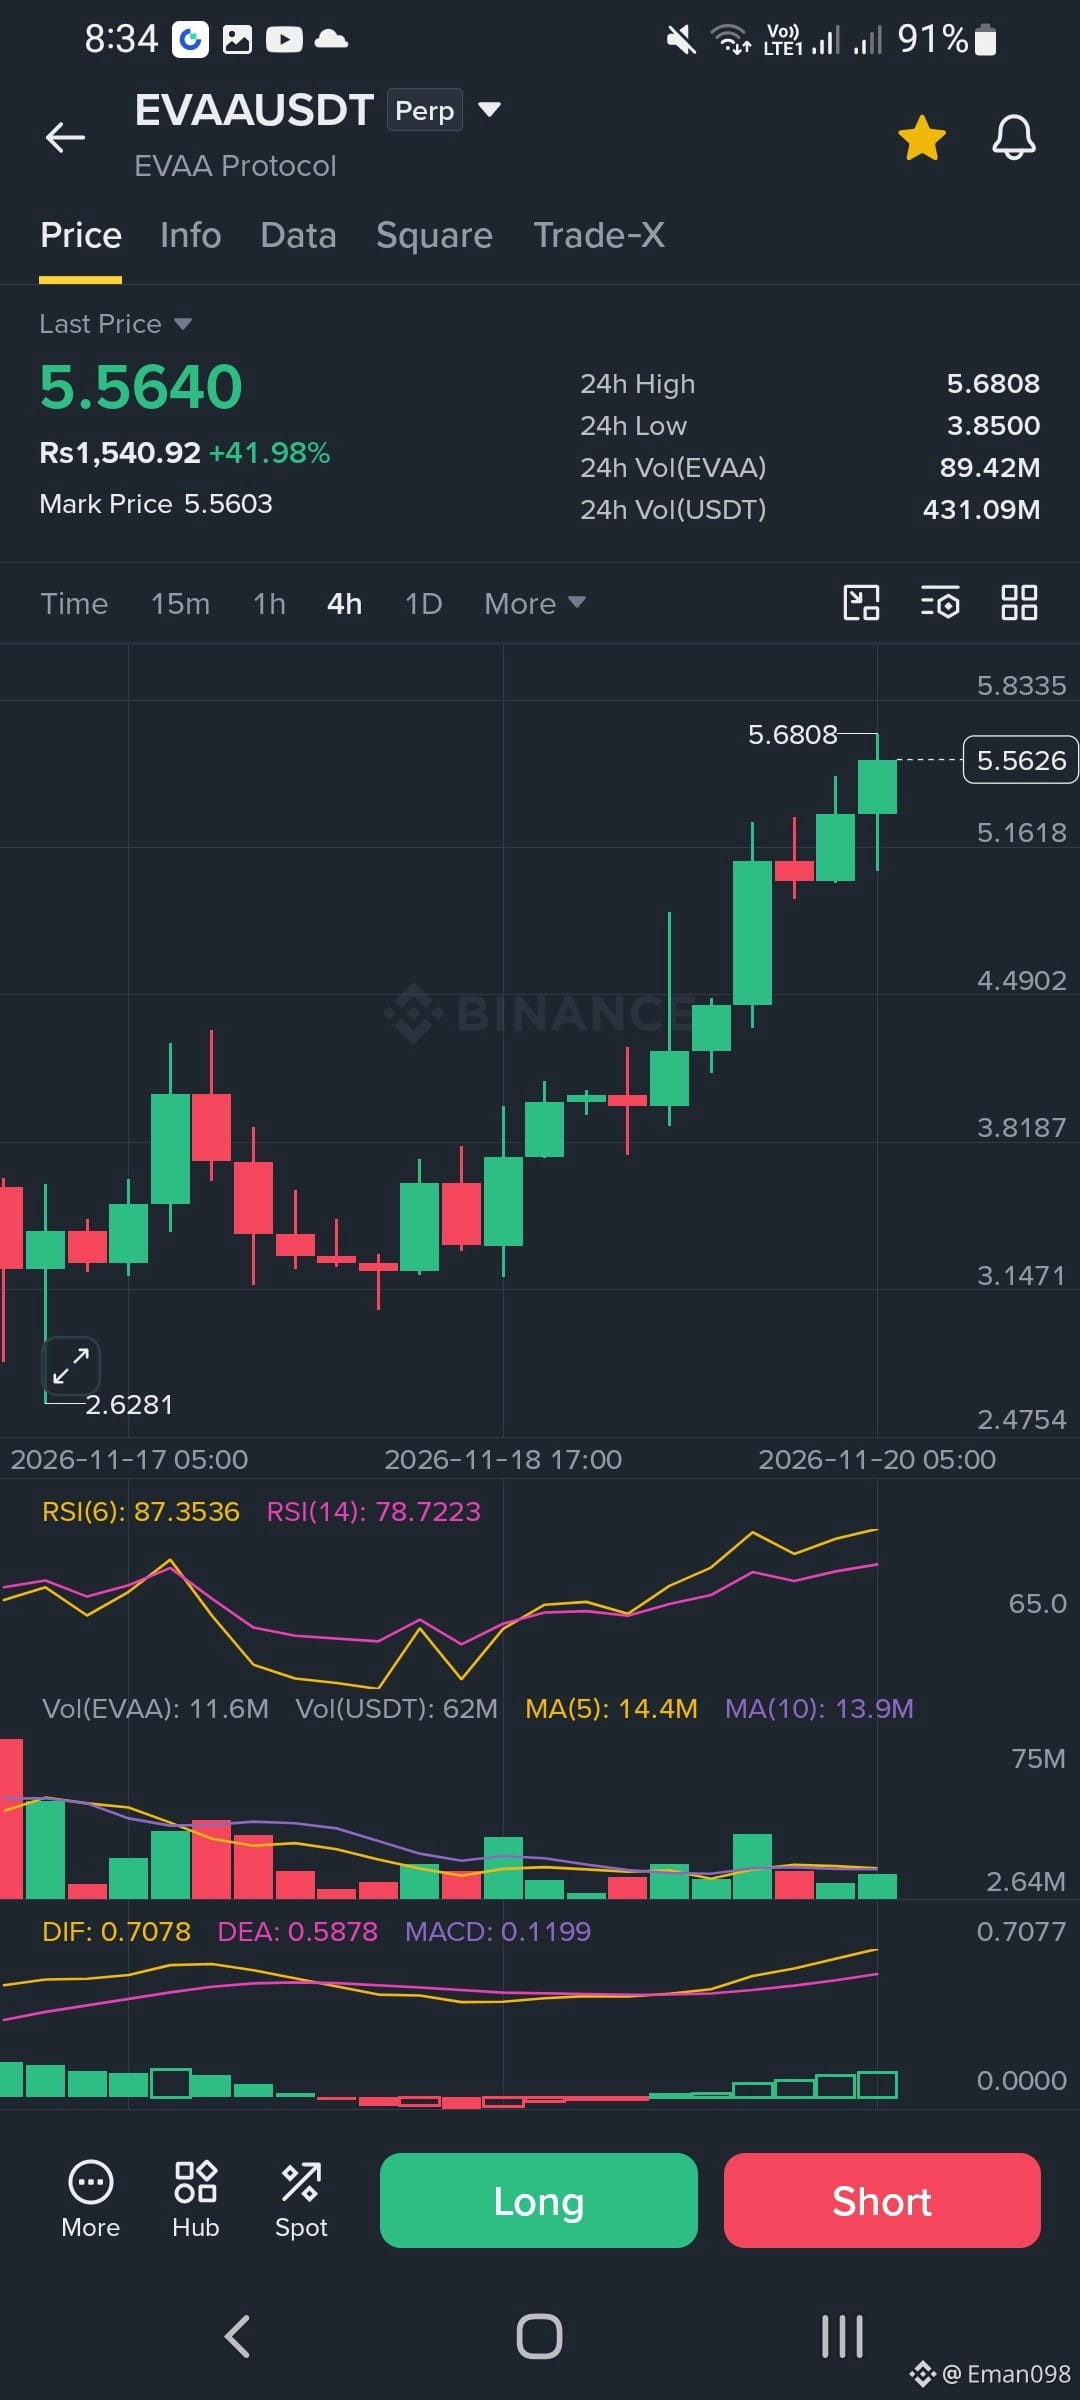
has jumped from 2.62 to 5.56 in just two days, and it's up about 42% today alone. The chart looks all green and exciting, but RSI is at 87 which means it's running very hot. When everyone is buying at once, that's often where exhaustion starts. Honestly jumping into a Long right now feels like FOMO.
Trend
Clear 4h uptrend with higher highs and higher lows. Breakout came from around 3.15.
- RSI:
RSI(6) at 87.3 and RSI(14) at 78.7, both overbought. Momentum is strong, but pullback risk is elevated.
- MACD:
DIF 0.7078 above DEA 0.5878, histogram positive and expanding. Bullish but the move is already extended.
- Volume:
Recent candles show lower volume (11.6M vs MA5 at 14.4M). Price rising on falling volume signals a weakening push.
- Resistance:
5.68 (24h high), then 5.83. The top candle has an upper wick, meaning sellers showed up at 5.68.
- Support:
5.16, then 4.49, with stronger support at 3.82.
Plan:
- Don't chase the Long here. Better entries are a retest of 5.16 or the 4.8-5.0 zone.
- Breakout Long only if a 4h candle closes above 5.68 with volume support stop below 5.35.
- Consider Short only if 5.16 breaks or a clear rejection candle forms at 5.68. Going against the trend is risky so keep size small.
- It's a perp so keep leverage low. With this volatility stay at 3x-5x max.
This is educational analysis not financial advice. Manage your own risk.
#NvidiaBoardReportedlySplitOverHuang’sReturn #CanGTA6'sLaunchLiftTTWOShares? #BTCRemainsUnderPressureAfterHawkishFOMCMinutes
has jumped from 2.62 to 5.56 in just two days, and it's up about 42% today alone. The chart looks all green and exciting, but RSI is at 87 which means it's running very hot. When everyone is buying at once, that's often where exhaustion starts. Honestly jumping into a Long right now feels like FOMO.
Trend
Clear 4h uptrend with higher highs and higher lows. Breakout came from around 3.15.
- RSI:
RSI(6) at 87.3 and RSI(14) at 78.7, both overbought. Momentum is strong, but pullback risk is elevated.
- MACD:
DIF 0.7078 above DEA 0.5878, histogram positive and expanding. Bullish but the move is already extended.
- Volume:
Recent candles show lower volume (11.6M vs MA5 at 14.4M). Price rising on falling volume signals a weakening push.
- Resistance:
5.68 (24h high), then 5.83. The top candle has an upper wick, meaning sellers showed up at 5.68.
- Support:
5.16, then 4.49, with stronger support at 3.82.
Plan:
- Don't chase the Long here. Better entries are a retest of 5.16 or the 4.8-5.0 zone.
- Breakout Long only if a 4h candle closes above 5.68 with volume support stop below 5.35.
- Consider Short only if 5.16 breaks or a clear rejection candle forms at 5.68. Going against the trend is risky so keep size small.
- It's a perp so keep leverage low. With this volatility stay at 3x-5x max.
This is educational analysis not financial advice. Manage your own risk.
#NvidiaBoardReportedlySplitOverHuang’sReturn #CanGTA6'sLaunchLiftTTWOShares? #BTCRemainsUnderPressureAfterHawkishFOMCMinutes