
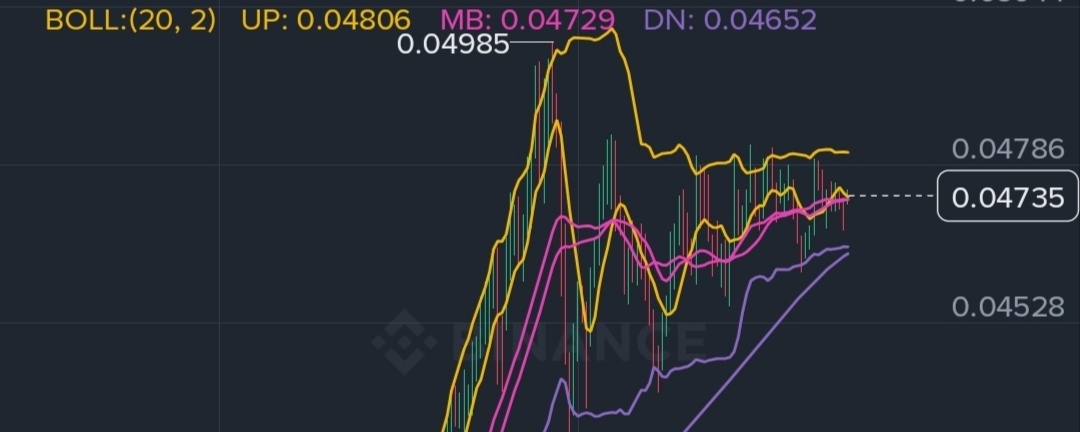

Here is a technical and market snapshot of the 1000LUNCUSDT Perpetual chart shown in the screenshot:
1. Market Overview
Last Price: 0.04740 (Mark Price: 0.04736)
24h Change: +11.61% (with Today showing +2.11% and 7 Days showing +26.27%)
24h Range: 0.04234 (Low) – 0.04985 (High)
24h Volume: 1.97B (1000LUNC) / 91.83M USDT
Timeframe: 15m chart
2. Technical Indicators (15m)
Moving Averages (MA)
MA(7): 0.04733
MA(25): 0.04730
MA(99): 0.04641
Price is hovering right around the short-term MA(7) and MA(25) cluster (~0.04730–0.04735), while holding comfortably above the MA(99) (0.04641) after a sharp rally from around 0.03814. Tightly clustered short MAs near current price often signal a brief consolidation or decision zone following a strong move.
Bollinger Bands — BOLL(20, 2)
Upper Band (UP): 0.04806
Middle Band (MB): 0.04729
Lower Band (DN): 0.04652
Price is trading slightly above the Middle Band (0.04729), putting it in neutral-to-bullish territory on the 15-minute timeframe with room toward the upper band (0.04806) if buying pressure picks up.
Volume
A clear volume spike accompanied the breakout/rally from the ~0.03814 area up toward 0.04985, followed by cooling volume during the sideways/pullback phase.
MA(5) Vol: 4.49M | MA(10) Vol: 6.36M
3. Key Levels to Watch
Immediate Resistance: ~0.04786 – 0.04806 (chart level & Bollinger upper band), followed by the 24h high at 0.04985 (and psychological/chart area near 0.05044).
Immediate Support: ~0.04729 – 0.04735 (MA(7)/MA(25)/BOLL MB), then 0.04641 – 0.04652 (MA(99) & Bollinger lower band), with deeper chart reference levels lower around 0.04528 and 0.04271.
4. Broader Context & Risk Note
While short-term momentum over the past 7 days (+26.27%) and 24 hours (+11.61%) is strong, longer-term performance on the screen shows 90 Days (-20.13%) and 180 Days (-42.12%) still in the red despite 1 Year (+57.11%). Perpetual futures also carry liquidation and volatility risk—especially after rapid spikes. (This is chart analysis for informational purposes, not financial advice.)
Are you looking at this for a short-term scalp/intraday trade, or evaluating a swing/longer-term position?