🚀 $XRP sellers gain more ground
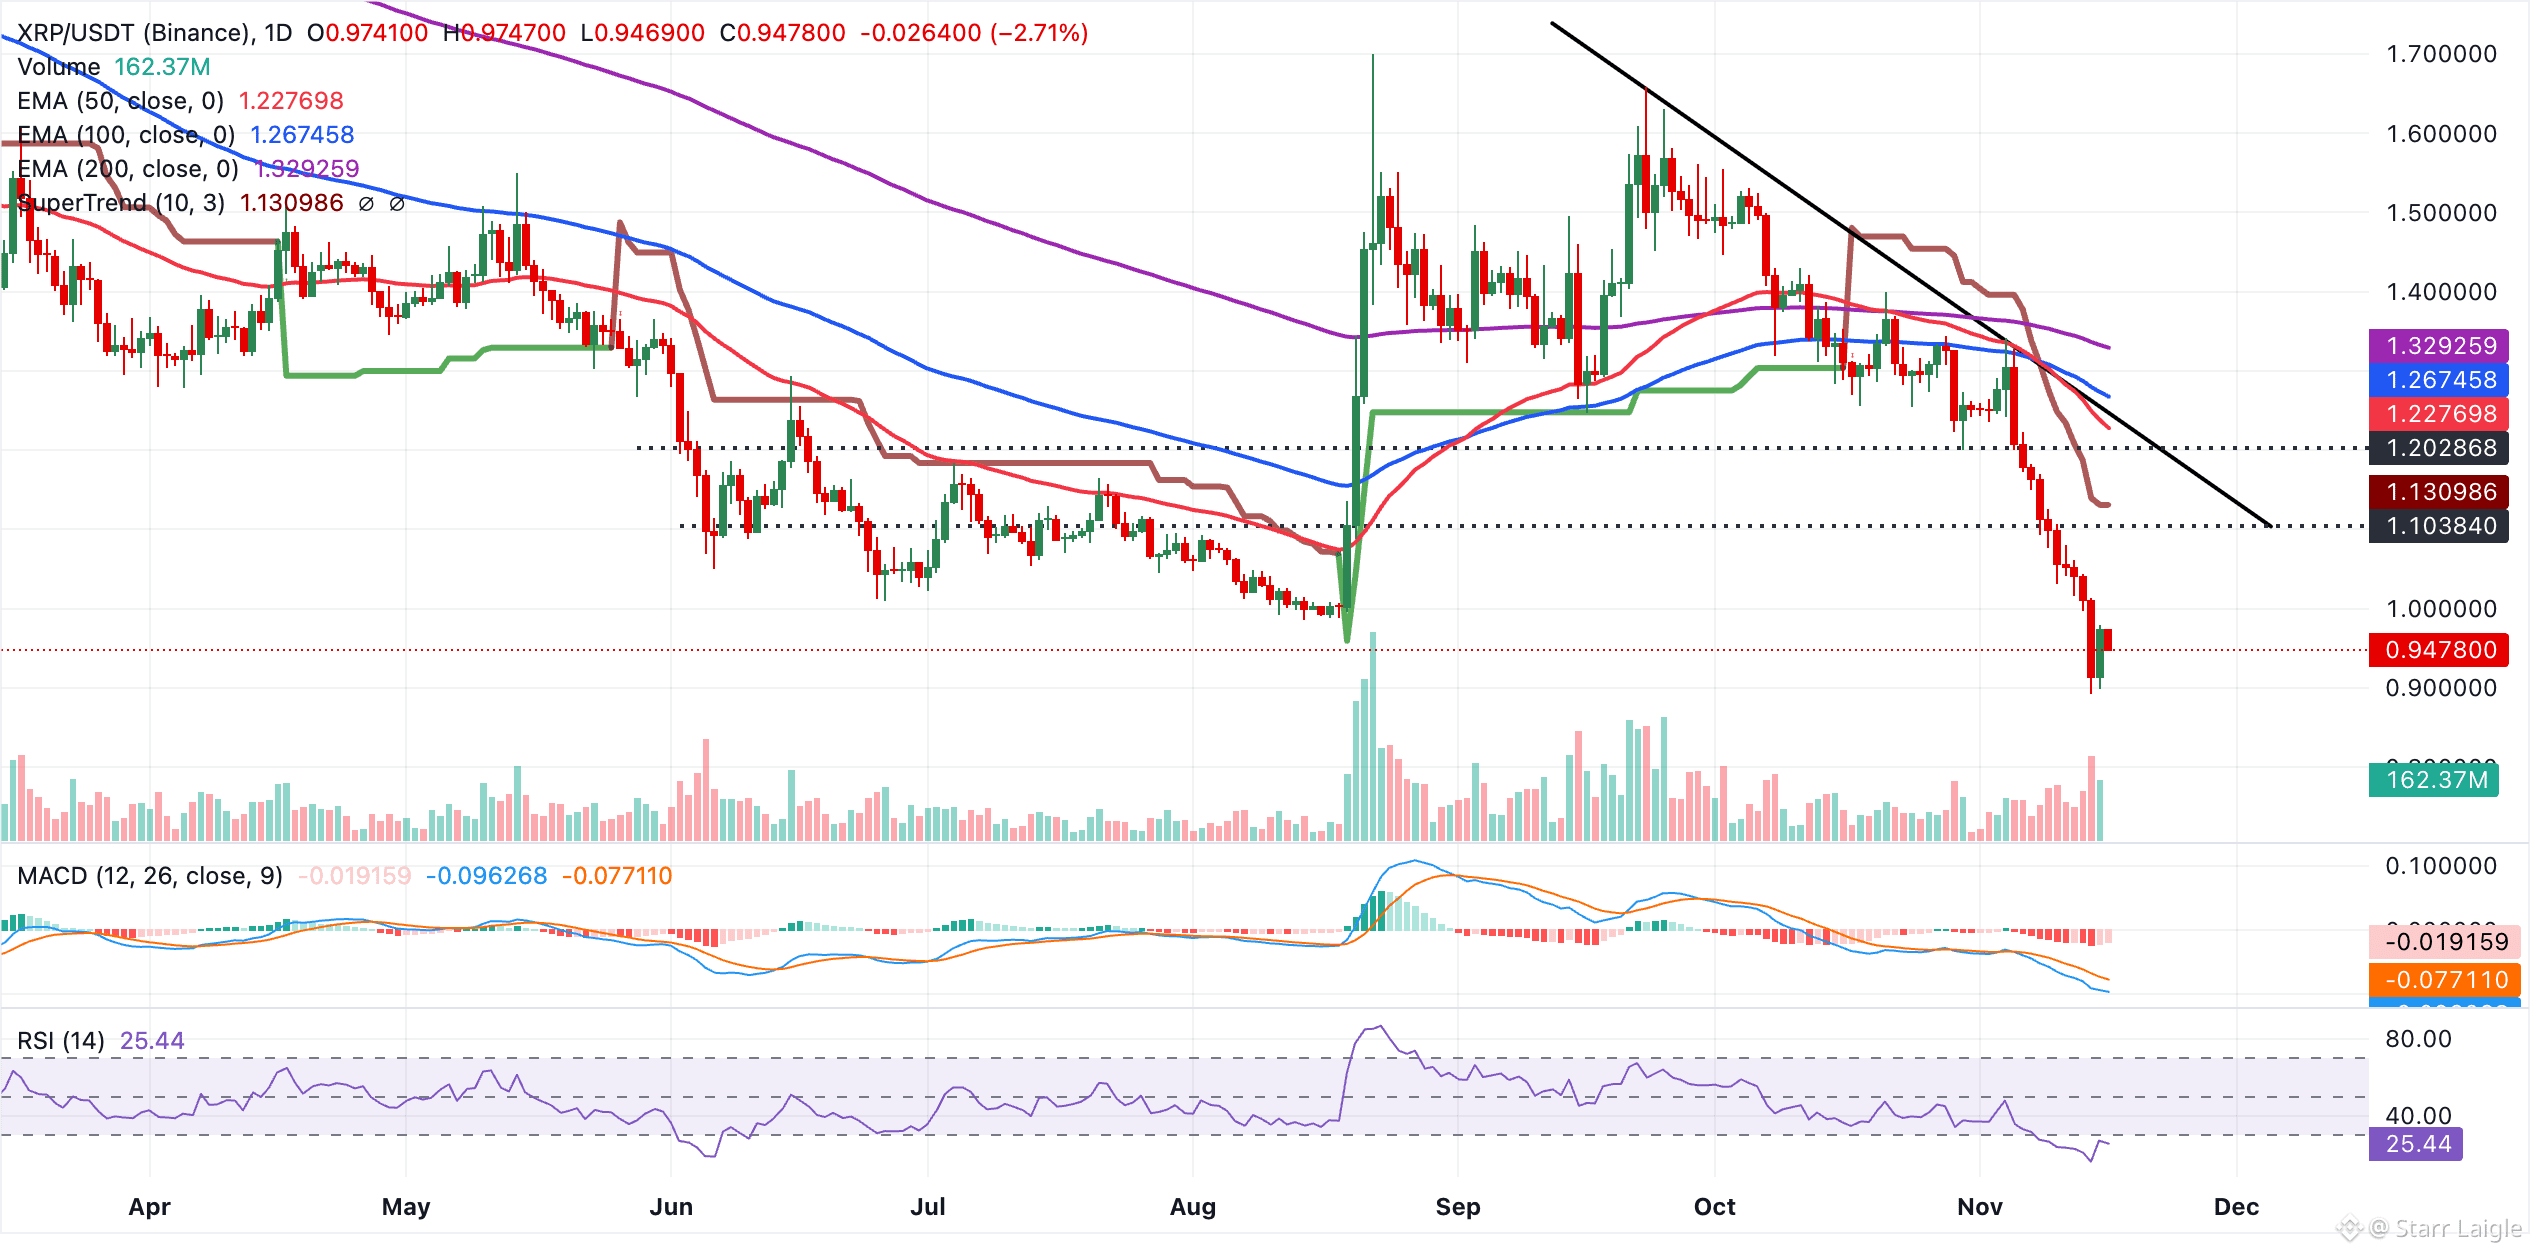
$XRP trades below $0.95, maintaining a bearish near-term bias as price holds well below the key moving averages. The 50-day EMA at $1.23, the 100-day EMA at $1.27 and the 200-day EMA at $1.33 all sit overhead, suggesting a market that remains capped after the recent slide.
The Super Trend indicator at $1.13 reinforces this topside pressure, while the RSI around 25 stays in oversold territory, hinting at stretched downside but not yet signaling a clear recovery. The MACD remains negative and below its signal line, with a subdued histogram, reinforcing the prevailing bearish tone.
Initial resistance emerges at the SuperTrend level near $1.13, ahead of a denser barrier formed by the 50-day EMA at $1.23 and the downward resistance trendline break price at $1.24. Above this area, the 100-day EMA at $1.27 and the 200-day EMA at $1.33 mark successive hurdles that would need to be reclaimed to ease the broader downside pressure.
With no clear structural support below the current price on the daily chart, traders may continue to focus on how price behaves as it approaches these overhead levels, watching for either a rejection that extends the downtrend or a sustained break that would challenge the current bearish bias.
#xrp #Xrp🔥🔥 #BTC #XRPRealityCheck #XRPHACKED
$XRP trades below $0.95, maintaining a bearish near-term bias as price holds well below the key moving averages. The 50-day EMA at $1.23, the 100-day EMA at $1.27 and the 200-day EMA at $1.33 all sit overhead, suggesting a market that remains capped after the recent slide.
The Super Trend indicator at $1.13 reinforces this topside pressure, while the RSI around 25 stays in oversold territory, hinting at stretched downside but not yet signaling a clear recovery. The MACD remains negative and below its signal line, with a subdued histogram, reinforcing the prevailing bearish tone.
Initial resistance emerges at the SuperTrend level near $1.13, ahead of a denser barrier formed by the 50-day EMA at $1.23 and the downward resistance trendline break price at $1.24. Above this area, the 100-day EMA at $1.27 and the 200-day EMA at $1.33 mark successive hurdles that would need to be reclaimed to ease the broader downside pressure.
With no clear structural support below the current price on the daily chart, traders may continue to focus on how price behaves as it approaches these overhead levels, watching for either a rejection that extends the downtrend or a sustained break that would challenge the current bearish bias.
#xrp #Xrp🔥🔥 #BTC #XRPRealityCheck #XRPHACKED